Page | 1 Agus Trilaksono
Continuous Damage Monitoring of CFRP using Fiber Bragg Grating:
In Stitched Laminate Material and
Thin Composite Structure with Stiffness Mismatch
(FBGセンサーを用いたCFRPのその場損傷検知:縫合複合材と 剛性の不整合を有する薄板積層材)
By Agus Trilaksono
10991571
Submitted to the System Design Faculty in Partial Fulfillment of the Requirements for the Degree of
DOCTORATE OF PHILOSOPHY IN
AEROSPACE ENGINEERING DEPARTMENT AT THE TOKYO METROPOLITAN UNIVERSITY
©2013 Agus Trilaksono
Accepted by Supervisor
Professor Naoyuki Watanabe
Aerospace Engineering Department, System Design Faculty Tokyo Metropolitan University
Ph.D thesis committee:
Professor Naoyuki Watanabe (Chairman) Tokyo Metropolitan University Professor Fukuchi Hajime Tokyo Metropolitan University Professor Kitazono Koichi Tokyo Metropolitan University Professor Kobayashi Satoshi Tokyo Metropolitan University
Page | 2 Agus Trilaksono
The essence of strategy is choosing to perform activities differently than rivals do. - Dr. Michael Porter (1947 - ), American Author and Professor
Page | 3 Agus Trilaksono
ABSTRACT
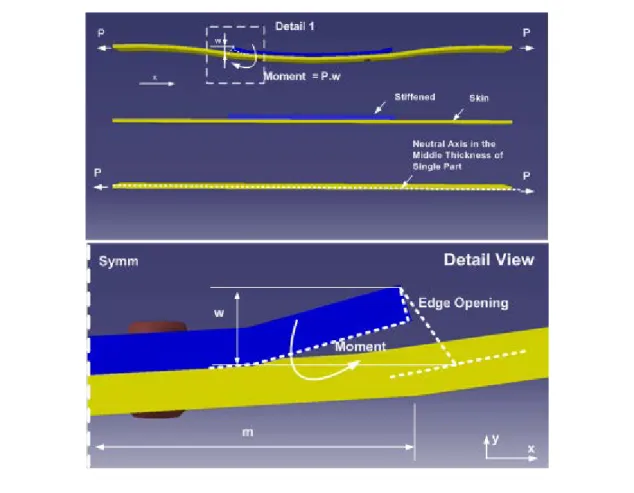
This thesis provides a comprehensive understanding of the capability of optical fiber sensor systems, namely fiber Bragg grating sensor (hereafter, ‘FBG sensor’), to monitor damage behavior in composite materials and structures under mechanical loading. The FBG sensor is embedded in two types of composite systems: (i) stitched laminate materials, (ii) thin composite structure with stiffness mismatch. The composite systems are subjected to two load cases, i.e. static tension and three-point-bending. The stitched laminate materials, which have through-thickness reinforcement in the form of stitch threads, exhibit a complex failure mechanism. Thin composite structures with stiffness mismatch exhibit secondary bending moment due to the shift of neutral-axis.
This neutral-axis shift eventually causes delamination, which is generated by high peel stresses at the edge of a stiffener.
Cohesive zone model and classical lamination theory combined with first ply failure criteria are performed to determine the preferred area for FBG sensor installation before manufacturing. Experiments were conducted to determine load distribution and failure mode within the specimen. Some non-destructive inspection, such as acoustic emission test and ultrasonic C-scan inspection, are conducted. Micro-structure microscopy is performed to observe the damage in detail. And during the static test,
Page | 4 Agus Trilaksono
FBG sensor was lit using a broadband light source then the spectrum behavior will retrieve until specimen broken.
In this research, a close understanding between the mechanical behavior as finite element analysis result and experimental results are obtained. FBG sensor has successfully detected, monitored and characterized some kinds of damage caused by both loading cases. Multi-peak occurrence is used to interpret the damage growth when specimen experienced with non-linear strain, while is experienced linear strain then wavelength broader is used. FBG sensor combined with C-scan inspection can predict the damage growth. A spectrum graph of the FBG sensor results can be used to replace a stress-strain mechanical graph for use in composite structural health monitoring.
However, the additional riveting process can potentially introduce delamination near the holes in post manufacturing. It can be seen that the original spectrum changes. Finally, recommendation on how to establish the structural health monitoring is given. This thesis has proven that FBG sensor is an effective tool to detect damage in composite materials and structures. FBG sensor has a great potential to change the conceptual design and the maintenance process of the aircraft.
Keywords: Carbon fiber, Cohesive elements, Secondary bending moment, Stitched
Laminate, Structural Health Monitoring.
Page | 5 Agus Trilaksono
ACKNOWLEGEMENTS
There are many people I would like to recognize for their help and support with my research. Without them, I would not have been able to accomplish this milestone so quickly with such satisfying results. I would like to thank my supervisor Professor Naoyuki Watanabe; he has always believed in my abilities and provided whatever advice and resources necessary for me to accomplish my goals. The rest of my thesis committee; Professor Fukuchi Hajime, Professor Kitazono Koichi and Professor Kobayashi Satoshi each spent countless hours with me to discuss aspects of my research.
While not officially a member of my thesis committee. Dr. Atsushi Kondo provided as much support as anyone else during the past few years, and added much more meaning to my work and working revisions of my various publications. A special thanks goes to Dr. Ayumu Inasawa and Dr. Morooka Satoshi who made my jobs more easily. Dr.
Shin-ichi Takeda dan Dr. Hikaru Hoshi for his kindness to teach how to operate SHM and mechanical equipment and let me used JAXA facility.
Next, I would like to acknowledge everyone who provided technical support for this project. Thanks to Dr.Tan and Dr.Arief for their friendship and share their knowledge especially introducing several test equipment in our laboratory.
Many Indonesian fellows contributed to this work by helping and providing
Page | 6 Agus Trilaksono
support me with wonderful advice, inspiration and friendship over the years. A special thanks goes to all of my lab members.
Lastly, I need to thank to all my loving family and Indonesian Aerospace members who have always given me their support. I love you all
Page | 7 Agus Trilaksono
TABLE OF CONTENTS
ABSTRACT ………3
ACKNOWLEGEMENTS ... 5
TABLE OF CONTENTS ... 7
LIST OF FIGURES ... 12
NOMENCLATURE ... 23
CHAPTER 1 : INTRODUCTION ... 26
1.1. BACKGROUND ... 26
1.1.1. Composite materials in aircraft and the structural issues. ... 26
1.1.2. Structural health monitoring (SHM) for composite. ... 30
1.1.3. SHM in composite using fiber Bragg grating (FBG) sensors. ... 35
1.1.4. Principle and capability of FBG sensor to detect damage in composite . 40 1.2. PREVIOUS RESEARCH. ... 45
1.3. RESEARCH OBJECTIVES ... 47
1.4. RESEARCH METHODOLOGY ... 49
1.5. LAYOUT OF THESIS ... 53
Page | 8 Agus Trilaksono
CHAPTER 2 : DAMAGE DETECTION AND MONITORING OF THIN
COMPOSITE STRUCTURE. ... 56
2.1. OVERVIEW ... 56
2.2. GENERAL DESIGN CONCEPT ... 57
2.3. NUMERICAL ANALYSIS ... 61
2.3.1. Specimen Configuration. ... 61
2.3.2. Methodology ... 62
2.3.2.1. FEM Analysis Parameter ... 62
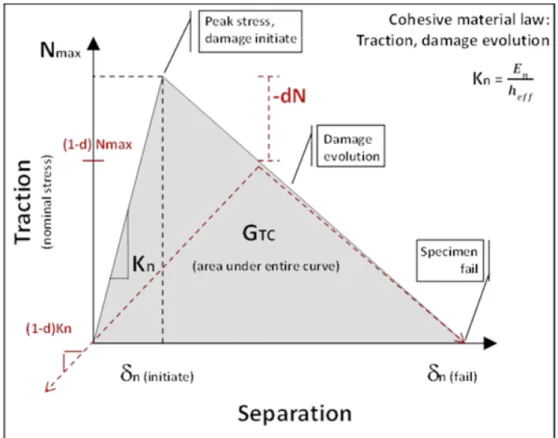
2.3.2.2. Cohesive Zone Model Laws ... 63
2.3.3. Three-dimensions and Elements Modelling... 67
2.3.4. Numerical Result ... 73
2.4. SPECIMEN FABRICATION. ... 91
2.4.1. Pre-impregnated Lay-up Preparation ... 91
2.4.2. Bonding Process and FBG Sensor Installation ... 93
2.4.3. Drilling Process ... 95
2.4.4. Strain Gauge Installation ... 97
2.5. EXPERIMENTAL PROCEDURE. ... 98
2.5.1. Tensile test ... 100
Page | 9 Agus Trilaksono
2.5.2. Three-point loading test ... 102
2.5.3. Bondable strain gauge test ... 103
2.5.4. Ultrasonic C-scan test ... 105
2.5.5. Fiber Bragg grating sensor test ... 108
2.6.RESULTS AND DISCUSSION ... 108
2.6.1. Experimental verification of numerical analysis. ... 108
2.6.1.1. Bonded joint model ... 109
2.6.1.2. Combined joint model ... 112
2.6.1.3. Ultrasonic C-scan result ... 115
2.6.2. The perspective of FBG sensor reading ... 118
2.6.2.1. Post-manufacturing spectrum ... 118
2.6.2.2. Power spectrum characteristic under tension loading ... 120
2.6.2.3. Power spectrum characteristic under three-point loading ... 129
2.6.2.4. Power spectrum characteristic under loading-unloading test ... 133
2.6.3. Damage quantification. ... 140
2.7.CONCLUSIONS ... 143
Page | 10 Agus Trilaksono
CHAPTER 3 : DAMAGE DETECTION AND MONITORING OF STITCHED
LAMINATE MATERIAL. ... 146
3.1. OVERVIEW ... 146
3.2. ASTITCHED LAMINATE CONCEPT WITH FBGSENSOR INSTALLED IN. ... 147
3.3. NUMERICAL ANALYSIS ... 148
3.3.1. Geometry and Configuration. ... 148
3.3.2. Methodology ... 149
3.3.2.1. FEM Analysis Parameter ... 149
3.3.2.2. Stitching threads modelling approach ... 152
3.3.3. Laminate Mechanical Response ... 154
3.3.4. Three dimensional and Elements Modelling ... 156
3.3.5. Numerical Result ... 156
3.4. MATERIAL AND SPECIMEN PREPARATION ... 159
3.4.1. Fabric Preform and VaRTM Preparation ... 159
3.4.2. FBG Sensor Installation ... 160
3.5. TESTING AND DAMAGE EVALUATION PROCEDURE ... 162
3.5.1. Tensile test ... 162
3.5.2. Ultrasonic C-scan test ... 164
Page | 11 Agus Trilaksono
3.5.3. Acoustic emission test. ... 165
3.5.4. Fiber Bragg grating sensor test ... 166
3.6.RESULTS AND DISCUSSION ... 167
3.6.1. Experimental Results. ... 167
3.6.1.1. Stitched laminate material. ... 167
3.6.1.2. Acoustic emission result ... 168
3.6.1.3. Ultrasonic C-scan result. ... 171
3.6.2. The perspective of FBG sensor reading ... 173
3.6.2.1. Power spectrum characteristic under tension loading. ... 174
3.6.2.2. Power spectrum characteristic under loading-unloading test ... 179
3.6.3. Damage quantification. ... 180
3.7.CONCLUSIONS ... 187
CHAPTER 4: CONCLUSIONS. ... 188
4.1. CONCLUSIONS ... 188
4.2. RECOMMENDATIONS ... 191
REFERENCES ... 193
PUBLICATION LIST ... 201
Page | 12 Agus Trilaksono
LIST OF FIGURES
Figure 1 : Composite application in commercial transport aircraft. ... 26
Figure 2 : Delamination Onset Causes. ... 28
Figure 3 : Fiber Bragg grating optics and illustration of the principle. ... 37
Figure 4 : The principle of power reflection of FBG as strain sensor; (a) No strain, (b) Under tensile strain. ... 37
Figure 5 : Calculated power reflection. ... 39
Figure 6 : Construction of FBG sensor. ... 41
Figure 7 : Design evolution charts before FBG sensor installation. ... 52
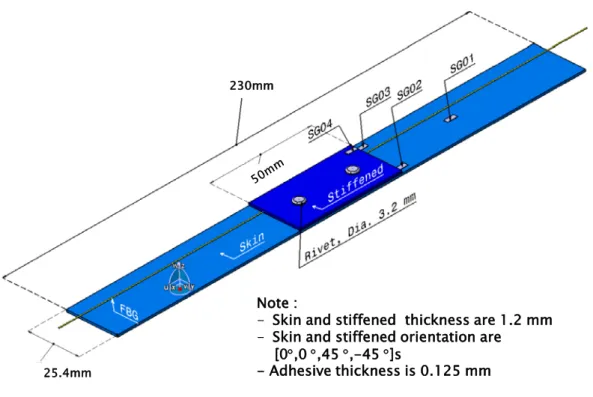
Figure 8 : Specimen for fundamental testing (composite structure with stiffness mismatch) inspired by a skin stringer structure. ... 58
Figure 9 : The secondary bending phenomena illustration in the composite structure with stiffness mismatch. ... 60
Figure 10 : Specimen dimensions and configuration with FBG sensor installed inside. 62 Figure 11 : Onset of delamination based on the cohesive zone model theory. ... 66
Figure 12 : Delamination onset based on Cohesive zone model theory. ... 67
Figure 13 : Three-dimensional solid modelling. ... 68 Figure 14 : (a) Conventional shell-to-continuum shell element and (b) continuum
Page | 13 Agus Trilaksono
shell-to-conventional solid element. ... 68
Figure 15 : 3D Element Modelling. ... 70
Figure 16 : Interaction between parts with tie constraints on the meshes. ... 71
Figure 17 : Interaction between parts with the merged nodes in the meshes. ... 71
Figure 18 : Composite lay-up to generate the model section. ... 72
Figure 19 : Composite shell to generate the model section. ... 73
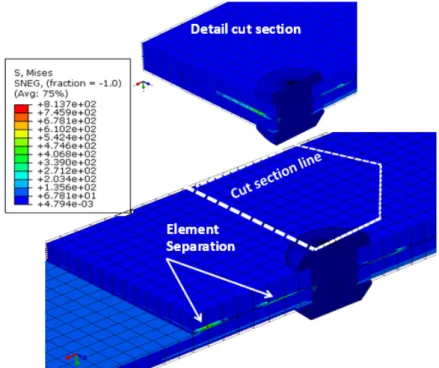
Figure 20 : Separation element locations under loading of the bonded joint. ... 74
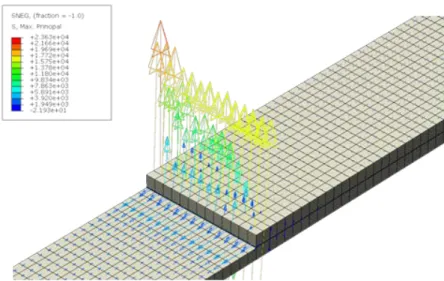
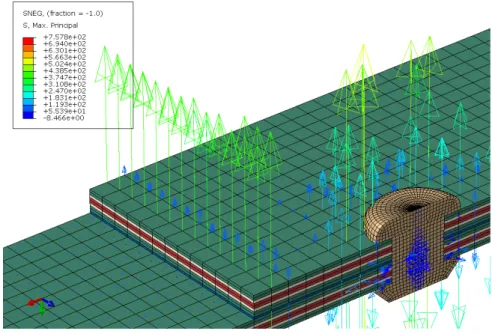
Figure 21 : Distribution of maximum principle stress vectors for the bonded joint. ... 74
Figure 22 : Separation element locations under loading for riveted and bonded joint. .. 75
Figure 23 : Distribution of maximum principle stress vectors for riveted and bonded joint. ... 76
Figure 24 : Peeling stress comparison in longitudinal (loading) direction. ... 77
Figure 25 : Peeling stress comparison in transverse direction... 77
Figure 26 : Comparison of stress concentrations near the rivet hole. ... 78
Figure 27 : Comparison of the load transferred to the stiffener. ... 79
Figure 28 : Onset of delamination based on cohesive zone model theory in a tensile test. ... 80 Figure 29 : Onset of delamination based on cohesive zone model theory in
Page | 14 Agus Trilaksono
three-point-bending test. ... 80 Figure 30 (a) (b) : Distribution of principle stress maxima and vector directions under
tensile loading for combined joint. ... 83 Figure 31 : Separation element location during tensile loading for combined joint. ... 83 Figure 32 (a) (b) : Distribution of principle stress maxima and vector direction for
combined joint under three-point loading. ... 84 Figure 33 : Separation element location during three-point-bending loading for
combined joint... 85 Figure 34 : Stress distribution profile in the longitudinal under tensile loading for
combined joint... 86 Figure 35 : Stress distribution profile in the longitudinal direction of the test under
three-point-bending loading for combined joint. ... 87 Figure 36 : Stress distribution profile in the transverse direction of the test under tensile loading for combined joint. ... 87 Figure 37 : Stress distribution profile in the transverse direction of the test under
three-point-bending loading for combined joint. ... 88 Figure 38 : Normalized load transfer in the rivet area under tensile loading. ... 89 Figure 39 : Normalized load transfer in the rivet area under three-point-bending loading.
Page | 15 Agus Trilaksono
... 89
Figure 40 : Autoclave system and curing circle process for impregnated laminate. ... 93
Figure 41 : Top is a good bond-line and bottom is a bad bond line. ... 94
Figure 42 : Adhesive gun-mixer system and specimen pre-fit. ... 95
Figure 43 : Drilling process. ... 96
Figure 44 : (a) Rivet pre-fit preparation, (b) After rivet squeezing. ... 97
Figure 45 : Rivet assembles equipment and the compressor system for rivet gun. ... 97
Figure 46 : Figure 47 : Strain gage bondable process for combining joint and bonded join only specimen. ... 98
Figure 47 : Tensile test setup. ... 102
Figure 48 : Flexural test setup. ... 103
Figure 49 : Wheatstone Bridge Circuit. ... 105
Figure 50 : The ultrasonic system illustration. ... 106
Figure 51 : Types of ultrasonic transducer used. ... 107
Figure 52 : Locations of strain gages and measurements of the bonded joint... 110
Figure 53 : Comparison between finite element analysis and experimental data at area1 for the bonded joint. ... 110 Figure 54 : Comparison between finite element analysis and experimental data at area2
Page | 16 Agus Trilaksono
for the bonded joint. ... 111
Figure 55 : Comparison between finite element analysis and experimental data at area3 for the bonded joint. ... 111
Figure 56 : Comparison between finite element analysis and experimental data at area4 for the bonded joint only. ... 112
Figure 57 : Locations of strain gages and measurements of combined joint. ... 113
Figure 58 : Comparison between finite element analysis and experimental data at area1 for the combined joint. ... 113
Figure 59 : Comparison between finite element analysis and experimental data at area2 for the combined joint. ... 114
Figure 60 : Comparison between finite element analysis and experimental data at area3 for the combined joint. ... 114
Figure 61 : Comparison between finite element analysis and experimental data at area4 for the combined joint. ... 115
Figure 62 : Tensile loading interrupt tests in bonded joint only. ... 116
Figure 63 : Tensile loading interrupt tests in combined joint. ... 117
Figure 64 : Three point bending loading interrupt tests in bonded joint only. ... 117
Figure 65 : Three point bending loading interrupt tests in combined joint. ... 118
Page | 17 Agus Trilaksono
Figure 66 : The effect of post-manufacturing processes for FBG sensor installation based on the spectrum reflection reading. ... 120 Figure 67 : Evolution of spectrum from FBG sensor reading in bonded joint only. .... 122 Figure 68 : Evolution of spectrum from FBG sensor reading in combined joint. ... 123 Figure 69 : Spectrum pattern explanation under FBG sensor reading in bonded only. 125 Figure 70 : Spectrum pattern explanation underjoint reading in combined join. ... 125 Figure 71 (a) (b) : The relationship between normalized intensity and normalized
wavelength during loading run in bonded join only structure has a mismatch stiffened at the tensile test. ... 127 Figure 72 (a) (b) : The relationship between normalized intensity and normalized
wavelength during a loading run in combined join... 128 Figure 73 (a) (b) : Comparison normalizing power intensity and wavelength for bonded join only and combined join due to resistance to damage under tension loading.
*(a) It indicated the damage start to growth. ... 129 Figure 74 : Spectrum pattern evolution under FBG sensor reading in combined join in
three-point loading. ... 130 Figure 75 (a) (b) : The correlation between normalized intensity and normalized
wavelength to during a loading run to combined join at three point bending. .. 130
Page | 18 Agus Trilaksono
Figure 76 (a) and (b) : The relationship between normalized intensity and normalized wavelength during a loading run of bonded join only at three point bending test.
... 132 Figure 77 (a) and (b) : Curve comparison in normalized intensity and wavelength
between two specimen models under three point bending test. *(b)It indicated the damage start to grow. ... 133 Figure 78 : (a). The load - displacement curve of combined join under tensile test and
location of load interrupted during test running. (b) Interrupted 1st at Displacement: 1 mm, Load: 10.6 N and Damage area: 2.7%. (c) Interrupted 2nd at Displacement: 1.5 mm, Load: 14.5 N and Damage area: 3.7%. (d) Interrupted 3rd at Displacement: 2.5 mm, Load: 23.50 N and Damage area: 9.3%. ... 135 Figure 79 : (a). The load - displacement curve of bonded join only under tensile test and location of load interrupted during test running. (b) Interrupted 1st at Displacement: 2.5 mm, Load: 25 kN and Damage area: 12%. (c) Interrupted 2nd at Displacement: 4.5 mm, Load: 32.5 kN and Damage area: 60%. (d) Interrupted 3rd at Displacement: 7 mm, Load: 25.3 kN and Damage area: 63%. ... 136 Figure 80 : (a). The load - displacement curve of combined join under three point
bending test and location of load interrupted during test running. (b) Interrupted
Page | 19 Agus Trilaksono
1st at Displacement: 6 mm, Load: 81 N and Damage area: 4.6%. (c) Interrupted 2nd at Displacement: 10 mm, Load: 130 N and Damage area: 7.4%. (d) Interrupted 3rd at Displacement: 14 mm, Load: 170 N and Damage area: 12.9%.
... 138 Figure 81 : (a). Graphic load - displacement of bonded join only under three point
bending test and location of load interrupted during test running. (b) Interrupted 1st at Displacement: 6 mm, Load: 82 N and Damage area: 1.8%. (c) Interrupted 2nd at Displacement: 10 mm, Load: 133 N and Damage area: 2.7%. (d) Interrupted 3rd at Displacement: 14 mm, Load: 176 N and Damage area: 4.6%.
... 139 Figure 82 : Quantification ratio of spectrum intensity due to damage area of bonded join only and combined joint. ... 141 Figure 83 : Quantification ratio of wavelength due to the damage area of combined join in three-point bending loading. ... 142 Figure 84 : Delamination growth: stress concentrations around rivet holes leading to
catastrophic failure in cleavage bearing mode. ... 143 Figure 85 : The schematic processes of the adopted stitching process by Toyota
Industries Corporation with FBG sensor embedded into the laminate. ... 148
Page | 20 Agus Trilaksono
Figure 86 : Specimen model configuration for stitched laminate. All dimensions in mm.
... 149
Figure 87 : Three dimensional modelling of stitching into the laminate by using rebar model. ... 151
Figure 88 : Boundary condition of the specimen. ... 151
Figure 89 : Typical rebar layer in a 20-node isoparametric element. (a) Geometry in the host element, (b) Geometry in the isoparametric domain. ... 153
Figure 90 : Three-dimensional and elements modelling of stitched laminated material. ... 156
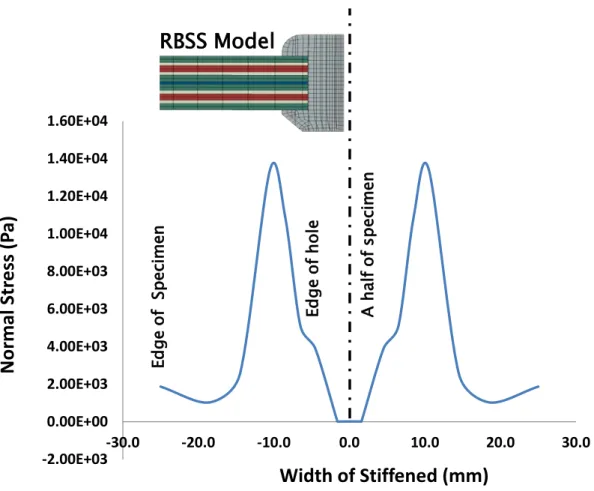
Figure 91 : Off-axis stress distribution within laminate. ... 157
Figure 92 : Stress distribution within stitched region. ... 158
Figure 93 : VaRTM sketch. ... 160
Figure 94 : FBG placement within stitched laminate material. (a) First ply failure theory result, (b) FBG position illustration within stitching configuration... 161
Figure 95 : The micro-structure photo of FBG sensor installation into the specimen. 162 Figure 96 : Tensile, AE, and Spectrum Analyzer test setups. ... 163
Figure 97 : Ultrasonic C-scan inspection. ... 165
Figure 98 : AE graph characteristic. ... 166
Page | 21 Agus Trilaksono
Figure 99 : FBG sensor joining and the losses dB calibration. ... 167 Figure 100 : Load- strain behavior of stitched laminate material... 168 Figure 101 : Mechanical behavior versus AE-Hit of stitched laminate material. ... 169 Figure 102 : Mechanical behavior versus AE-Energy of stitched laminate material. .. 169 Figure 103 : Mechanical behavior versus AE-Cumulative Energy of stitched laminate
material... 170 Figure 104 : Comparison result between energy and accumulative hit under AE test. 170 Figure 105 : C-scan result specimen2 compared with own original power spectrum. . 172 Figure 106 : C-scan result specimen3 compared with own original power spectrum. . 172 Figure 107 : C-scan result specimen4 compared with own original power spectrum. . 173 Figure 108 : Spectrum shape evolution under FBG sensor reading in stitched laminate.
... 174 Figure 109 : Spectrum evolution on profiling tensile test. ... 175 Figure 110 : Highest peak value of the power reflection result in the profiling tensile test compared with the interrupt test... 176 Figure 111 : Power reflection of the FBG sensor reading compared with the mechanical behavior. ... 177 Figure 112 : Power reflection of the FBG sensor reading compared with AE test:
Page | 22 Agus Trilaksono
accumulative hit characteristic and mechanical behavior. ... 178 Figure 113 : Power reflection of the FBG sensor reading compared with AE: energy
characteristic and mechanical behavior. ... 178 Figure 114 : Spectrum evolution in the interrupt load test. ... 179 Figure 115 : Spectrum evolution in the unloading data. ... 180 Figure 116 : (a) Interrupt test1, 20kN ... 182 Figure 117 : (a) and (b) Damage quantification based on the FBG sensor reading and mechanical behavior. ... 186 Figure 118 : Damage quantification based on the FBG sensor reading and AE
characteristic. ... 186
Page | 23 Agus Trilaksono
NOMENCLATURE
Gxz [GPa] Out-of-plane Shear Modulus K [Nmm*1] Stress Intensity Factor
KF [Nmm'J] Penalty Stiffness of Cohesive Element Ks [MPa] Stiffness of Spring Element
Ry [m] Radius of Stitch Yarn
Sarea [mm1] Stitch Thread Cross Sectional Area Sp [mm] Stitching Pitch
Ss [mm] Stitching Space
σt1 [MPa] Tensile Strength Allowable σc1 [MPa] Compressive Strength Allowable τ12 [MPa] Shear Strength Allowable
Et1 [GPa] Tensile Modulus Allowable Et2 [GPa] Compressive Modulus Allowable G12 [GPa] Shear Modulus Allowable
SD [mm-2] Stitch Density
t [mm] Thickness of Specimen Vft [%] Stitch Fibre Volume Fraction
Page | 24 Agus Trilaksono
Wt [Nmm] Stitch Fibre Strain Energy
x,y,z - With Reference to Global Coordinates x, y, z XC [MPa] Compressive Strength in Fibre Direction XT [MPa] Tensile Strength in Fibre Direction
YC [MPa] Compressive Strength Perpendicular to Fibre Direction YT [MPa] Tensile Strength Perpendicular to Fibre Direction δ [mm] Displacement
∆ [mm] Displacement Jump
∆a [mm] Equivalent Displacement Jump νij - Poisson Ratio
ρ [gm-3] Density
σB [MPa] Fibre Breaking Strength
σUTL [MPa] Ultimate Compressive Strength τ [MPa] Traction
Ay [m2] Cross Sectional Area of Yarn b [mm] Width of Specimen
d [gm-1] Denier
E [J] Absorbed Energy
Page | 25 Agus Trilaksono
Ef [GPa] Youngs Modulus of Stitch Fiber Ex [GPa] Axial Compressive Modulus Exx [GPa] In-plane Longitudinal Modulus Ezz [GPa] In-plane Transverse Modulus
F [N] Force
𝐹𝑓𝑐 - Hashin Fibre Compression Failure Criterion 𝐹𝑓𝑡 - Hashin Fibre Tension Failure Criterion 𝐹𝑚𝑐 - Hashin Matrix Compression Failure Criterion 𝐹𝑚𝑡 - Hashin Matrix Tension Failure Criterion
GIC [Nmm-1] Critical Mode I Strain Energy Release Rate GIIC [Nmm-1] Critical Mode II Strain Energy Release Rate GIIIC [Nmm-1] Critical Mode III Strain Energy Release Rate
Page | 26 Agus Trilaksono
CHAPTER 1 : INTRODUCTION
1.1. Background
1.1.1. Composite materials in aircraft and the structural issues.
Composite materials have been used in the aerospace industry over the past three decades for their stiffness-to-weight benefit. Unfortunately, the progress on composites usage was not so promising, even though the trend in transport aircraft size and flight range has been steadily increasing. Figure 1 shows the evolution composite usage at Airbus in spite of the composite usage expectation was all composite wings before the year 2000, all composite fuselage after the year 2000, and the entire airframe around 20101.
Figure 1 : Composite application in commercial transport aircraft.
Page | 27 Agus Trilaksono
There are many factors and issues associated with the insertion of the advanced materials for primary structural applications where structural integrity is the most important factor. Especially for composites, one of the primary concerns is whether or not the material is reliable and durable for the primary structural application. Composite material has high sensitivity to out-of-plane failure resulting from the low interlaminar fracture toughness and have data limitations to describe the complexity of failure mechanism2.
Figure 2 shows delamination as one of the predominant modes of failure in composite when there is no reinforcement in the thickness direction. And to increase the confidence level to implement composite material into aircraft structure, then need another technology to combine it. One of the suitable new technology to combine is by implementing strain sensor to make auto damage detection and continuous monitor the damage for Composite Structural Health Monitoring (SHM). This technology can increase market acceptance caused can increase safety and reliability the composite structure during operational.
Page | 28 Agus Trilaksono
Figure 2 : Delamination Onset Causes.
However, composite materials provide challenges for design, manufacturing, maintenance and repair over metallic parts since they tend to fail by distributing and interacting damage modes. Furthermore, damage detection in composites is more difficult than in metallic structures. And the damage in composite materials often occurs beneath the top surface. Currently successful composite non-destructive inspection (NDI) for small laboratory specimens, such as X-radio graphic detection and C-scan detection, are impractical for in service inspection of integrated structure. Although inspection specifications for in-service composite airframes have published by the FAA3, however the listed methods such as eddy-current and single-sided ultrasound are expensive, time-consuming and can be unreliable for large parts when applied to
Manufacturing
Residual Stress- induced Delaminations
Machining
Drilling
Environmental Effects
Hydrothermal
Thermal
Geometry
Skin/Stringer Debonding
Free Edge Interlaminar
Stress
Tapered Structure
Joints and Bonding
Mechanical Load
Low Velocity Impact
Page | 29 Agus Trilaksono
composite structures. It is clear that new reliable approaches for damage detection in composites need to be developed to ensure that the cost of critical structures does not become a limiting factor in their use.
There are several documents issued by the Federal Aviation Administration (FAA) that regulate how the aircraft structure may be designed and inspected3. The FAR 25, a airworthiness standards for transport category airplanes, lists the acceptable engineering design criteria for the damage tolerance, which will be discussed further in the SHM motivation section. The Code of Federal Regulations (CFR) Title 14 Part 145 requires that all maintenance be performed using methods prescribed by Advisory Circular (AC) 43.13-IB. The certified techniques include visual inspection, liquid penetrant inspection, magnetic particle inspection, eddy current inspection, ultrasonic inspection, radiography, acoustic emission, and thermography. For each of these methods, a section is written in the AC that specifies the accepted procedure for each of these methods; along with detailed diagrams, checklists and reporting formats. For each certified commercial aircraft, an Aircraft Maintenance Manual (AMM) is created by the manufacturer in conjunction with the FAA CKR Title 14 Part 39 that lists each component to be inspected, the inspection interval, the type of damage to be concerned about, and the suggested methods to be used for the inspection. One example of the airworthiness directive, it
Page | 30 Agus Trilaksono
specifies for most composite components in commercial applications, currently only visual inspections are required. The aircraft is designed to be able to survive with any invisible damage, and there is a condition that such damage not grow over the period of two inspection intervals as determined by an instrumented coin tap test. Airbus A3XX as an example, the design service goal is 24,000 flights with general visual inspections every 24 months, and a detailed tear-down inspection for crack and corrosion via ultrasonic and eddy current techniques every 6,000 flights after the first 12,000 flights.
While an A3XX under traditional practice would not undergo a thorough inspection in the first half of its expected life.
By using a SHM system, the structures would be constantly monitored without interruption of service and it reduce the aircraft grounded schedule. Its means can increase economic aspects for airliner who operate the aircraft. While in regulation, there is currently no specific provision in any of the published directives for a structural health monitoring system.
1.1.2. Structural health monitoring (SHM) for composite.
Composite Structural Heath Monitoring (SHM) has been defined in the literature5 as the “acquisition, validation and analysis of technical data facilitate
Page | 31 Agus Trilaksono
life-cycle management decisions”. More generally, SHM denotes a system with the ability to detect and interpret adverse “changes” in a structure in order to improve reliability and reduce life-cycle costs. The more fundamental challenge in designing a SHM system is knowing what "changes" to look for and how to identify them. The characteristics of damage in a particular structure plays a key role in defining the architecture of the SHM system. The resulting “changes”, or damage signature, will dictate the type of sensors that is required. The development of reliable damage detection methods is critical to maintain the integrity of those structures. The following paragraph provides descriptions of various non-destructive inspection techniques that have been developed for the detection of damage in composite materials6-7.
Visual Inspection Method - Perhaps the most natural form of evaluating composite materials is by visual inspection. Several variants of this method exist at various levels from the use of a static optical or scanning electron microscope to optical examination by eye over the structure. While microscopy can be a useful method to obtain detailed information such as micro-crack counting or delamination area. But it can only be used in the laboratory since a section must be removed from the larger structure. Visual inspection is the simplest and least expensive method. However damage in composite materials often occurs below the surface. While this method can
Page | 32 Agus Trilaksono
potentially provide some useful data for damage detection, on a large-scale structure this process would prove inefficient and ineffective.
Radiography Method - X-radiographic techniques depend on recording the difference in x-ray absorption rates through the surface of structure. These methods can be implemented in real-time digitally, or by taking static radiographs, whereas areas of different density are differentiated by the magnitude of x-ray exposure to the media on the opposite side of the surface after a predetermined excitation time. To highlight damaged regions with cracks or delamination, often a liquid penetrant is applied. These techniques are relatively inexpensive and simple to implement and interpret. They require large and costly equipment that is difficult to use in large part without removing them from the structures. The greatest challenge to use x-radiography methods in a structural application are that all require access to both sides of the surface in order to emit and collect the x-ray radiation, which is often not practical.
Strain Gauge Measurement Method - Strain gauge methods are perhaps currently
the most common way to monitor the damage in composite materials on in-service structures. A voltage applied across a foil gauge is capable of measuring strain by the change in resistance due to deformation. These devices are relatively small, tight and inexpensive making them simple to implement, and their results are easily interpreted.
Page | 33 Agus Trilaksono
They are capable of monitoring local strain to detect time-history overloads and deformation. A disadvantage to this technique is that the results from a single gauge can only cover a small area of the surface accurately. It needs a large quantity of them to monitor an entire structure, yielding a complex system with many wires. In order to avoid this situation the gauges can only be placed in a few select predicted problem areas.
Ultrasonic Scanning Method - Another commonly implemented non destructive
inspection technique is ultrasonic testing, most often referred to as A, B and C-scans.
These tests are usually conducted with two coupled water-jet heads moving in tandem on either side of the specimen surface, sending ultrasonic waves through the water stream on one side, and collecting the transmitted acoustic waves on the opposite side.
An A-scan refers to a single point measurement of density, a B-scan measures these variations along a single line, and a C-scan is a collection of B-scans forming a surface contour plot. The C-scan has been common practice in the aerospace industry since the results widely understood and can be used to scan a large area of structure, typically water is used as a couplant. Newer non-contact techniques have been attempted that use air as a couplant. Beyond the size and cost of the equipment there also is the problem that access is required for both sides of the structure. The parts must often be
Page | 34 Agus Trilaksono
disassembled for testing. Single-sided ultrasonic reflective methods are in development to remedy this problem.
Vibration-based Method - Most vibration-based damage detection techniques for
composite materials have focused on modal response. Structures can be excited by ambient energy, an external shaker or embedded actuators, and the dynamic response is then recorded. Changes in normal modes can be correlated with loss of stiffness in a structure, and usually response-history tables are used to predict the corresponding location of damage. These methods are implemented easily within the existing infrastructure of a structure at a low cost. The data they produce can be complicated to interpret. This technique holds much potential for non destructive inspection methods within composite materials. Another popular vibration measurement technique in composites is acoustic emission (AE) test. Changes in material properties can be deduced using resonant beam sensors, accelerometers, piezoelectric, or microphones to record energy being released by matrix cracking or fibers fracturing. This method has the advantage to use an array of multiple sensors to triangulate the location of damage by the signal time of flight. Again, the data from this method can be complicated to interpret, but hold much potentially useful information for the detection of damage in composite materials.
Page | 35 Agus Trilaksono
Fiber Optic Strain sensor Method - In order to cover more area on a structure for
strain measurement; another technique that has evolved is the embedded small-diameter optical fibers, which can be multiplexed to record measurement over large regions. In using this method, pulses of polarized laser light is transmitted along an optical fiber.
The gratings are placed in various locations to reflect a portion of the light at a certain wavelength. By recording the time of beam flight, the length of the fiber segment can be easily deduced. If a strain has been applied to the fiber segment, the time of flight would change active areas. Opponents of optical fiber methods claim that mere is a large shear-lag effect due to the cladding, coating and adhesion layers surrounding the optical core that makes it impossible to take accurate measurements. Furthermore, these fibers introduce weak points in a laminate as potential crack and delamination initiation sites.
But recent research has resulted that small-diameter of FBG sensor have no much influence in mechanical properties of composite. And now FBG sensor has potential widely used for aircraft structure applications since they can be easily multiplexed over long distance and can cover a wide area of inspection. In addition, it can be used as continues and real time damage detection and monitoring.
1.1.3. SHM in composite using fiber Bragg grating (FBG) sensors.
Fiber Bragg grating sensors have become of particular interest in this thesis due to
Page | 36 Agus Trilaksono
their ability to embed into the composite materials and structures. Currently the aerospace industry has one of the highest payoffs since damage can bad to catastrophic (and expensive) failures, and the vehicles involved undergo regular costly inspections.
Currently 27% of an average aircraft's life cycle cost both for commercial and military vehicles, is spent on inspection and repair8.
Figure 3 shows the FBG sensor basic operation which it follows the Fresnel reflection theory. Where light travelling has different refractive indices may both reflect and refract at the interface. While Fig.4 explains how the power reflection of FBG sensor work as strain sensors when each time light in the fiber encounter the FBG sensor’s refractive index discontinuities during loading. When a tensile strain stretches the FBG sensor, it will increase the grating period (illustrated in yellow line). Therefore tensile strain also increase λBragg.
Page | 37 Agus Trilaksono
Figure 3 : Fiber Bragg grating optics and illustration of the principle.
Figure 4 : The principle of power reflection of FBG as strain sensor; (a) No strain, (b) Under tensile strain.
Input Transmitted Reflected
(a)
(b)
Page | 38 Agus Trilaksono
The grating will typically have a sinusoidal refractive index variation over a defined length. The Bragg or reflected wavelength (λB) is defined by the relationship,
λB = 2ΠΛ (1)
Where Π is the effective refractive index of the grating in the fiber core and Λ is the grating period. When FBG sensors are being strained the wavelength of the reflection peak will be shifted. It is necessary to measure these shifts very precisely for strain measurement.
Formulation above effective for uniform strain, because Π (effective refractive index) and Λ (grating period) also uniform along the entire length of the FBG sensors
and keeping the reflection spectrum to its original narrow shape. It also means that if the non - uniform strain induced to FBG sensor, the reflection spectrum will change not as original narrow shape again. This phenomenon will use to detect the damage with monitoring the change of reflection spectrum shape. The normal shape of the reflection spectrum can be determined by the following expression. Figure 5 shows the result of spectrum shape theoretically by using the followed formulation below.
Pi =πλ0
𝑁 𝛥λ𝑖 𝑠𝑖𝑠π 𝑁 𝛥λ0λ𝑖 (2) Where,
λ𝑖 = λo + 𝛥λ𝑖 (3)
Page | 39 Agus Trilaksono
∇ = λ0
2 𝑛 (4)
N = 𝐺𝐺∇ (5) Equation (4) inserted into (5) gives;
N = 2 𝑛 𝐺𝐺λ
0 (6)
Where;
n (refraction index) = 1.46
λo (wavelength at center spectrum) = 1550 nm Gl (grid length) = 15 mm
Figure 5 : Calculated power reflection.
Page | 40 Agus Trilaksono
1.1.4. Principle and capability of FBG sensor to detect damage in composite
The optical fiber is found at 1969 when first gradient index fibers were manufactured by the cooperation of Nippon Sheet Glass Co and Nippon Electric Co for telecommunication purposes. But the damping was still high about 100 dB/km caused mainly by chemical impurities of the glass. Good progress was reached at 1976 with damping was just less than 1 dB/km and it was available in Japan, USA, and UK9.
Fiber Bragg gratings are created by "inscribing" system (periodic or aperiodic) variation of refractive index in the core of optical fiber using an intense ultraviolet (UV) source such as a UV laser. Two main processes are used: interference and masking.
Which is best depends on the type of grating to be manufactured. These fibers contain a very small inner core of 4 µm to 9 µm diameter and a cladding of pure glass (SiO2) of 50μm - 125μm diameter. The core has a higher refraction index caused by germanium
doping. The difference between the inner core and cladding in refraction indexes causes the light to propagate only inside the small core. This behavior, then as advantage of fiber optic when the light pass through, which then the changes of the light intensity is used to determine strain and temperature on the composite structure.
Page | 41 Agus Trilaksono
Figure 6 : Construction of FBG sensor.
To measure strain, the sensors must be fixed to the structure and usually by embedding during lay-up in the manufacturing process. Figure 6 shows stretching a FBG sensor cause a change in grating period and resulting a change in reflected wavelength.
To get correlation Bragg or reflected wavelength (λB) to mechanical strain and Fiber’s rated tensile strength
Can be as high as 1379 MPa
Page | 42 Agus Trilaksono
temperature is defined by the relationship below,
Because there are several refractive indices in the one raw of FBG sensor, then the value of Π is the average refractive index in the grating.
Π = (Π3 + Π2)
2 (7)
The bandwidth (Δλ) or wavelength spacing between the first minimum, is given by;
Δλ =(2δΠ0ή)
𝜋 λB 8)
Where δΠ is the variation in the refractive index, for example is Π3 - Π2 and ή is the fraction of power in the core.
The peak reflection (PB(λB)) is given by, PB(λB) = tanh2 [ Nή(V)δΠ0
Π ] (9)
Where N is the number of periodic variations. The full equation for the reflected power (PB(λ)), is given by;
PB(λB) = 𝑠𝑠𝑛ℎ2[ή(V)δΠ0�1−Г2
𝑐𝑐𝑠ℎ2�ή(V)δΠ0�1−Г2𝑁∇λ�−
𝑁∇/λ
Г2 (10)
Where,
Г= ή(V)δ1Π0 [λλ
B−1] (11)
After discussion about FBG sensors in relation to the wavelength (λB) with electrical power PB(λB). And now following how the relationship between wavelength
Page | 43 Agus Trilaksono
(λB) is the mechanical-strain. When FBG sensors are being strained the wavelength of
the reflection peak will be shifted. It is necessary to measure these shifts very precisely for strain measurement. And the wavelength of an FBG sensor change with strain and also temperature is according to the equation below;
Δλ
λ0 = ƙ ε + αrΔT (12)
Where,
Δλ = wavelength shift
λ0 = wavelength at center spectrum Ƙ = 1 – р
p = photo elastic coefficient, which is p = 0.22 ε = elastic strain
ΔT = temperature change in K
αr = glass refraction index’s coefficient thermal of expansion and, αδ = δΠ/Π
δT (13)
The expression (ƙ. ε) explains about strain caused by mechanical force (εm) and temperature (εt). While (αr. ΔT) explains about the change of the glass refraction index Π caused only by temperature. And the strain is affected by two things, namely mechanical and temperature then,
Page | 44 Agus Trilaksono
ε = εm + εt (14)
Where,
εm = mechanical strain.
εt = strain caused by environmental temperature And εt = αcΔT
αc = composite’s coefficient thermal of expansion.
Base on the equation above, will clear the behavior of FBG sensors within the influence of strain and temperature. Inserted the equation (9) and (12) into equation (9), then the equation will be,
Δλλ
0 = (1 – р) (εm + αcΔT) + δΠδT/Π ΔT (15) In case FBG sensors is installed in the structure/part without mechanical strain happen then it works as a temperature compensation only. Then the formulation FBG sensor become,
Δλλ
0 = Ƙ αcΔT + δΠδT/Π ΔT (16)
Then,
ΔT = 1
Ƙ αc+δΠδT/Π + Δλλ
0
= 1
Ƙ αc+αδ + Δλλ
0 (19)
This formulation is for FBG sensor temperature compensation.
Page | 45 Agus Trilaksono
1.2. Previous Research.
The increasing application of composite materials but with a complex damage mechanism and has difficulty to inspect encouraged authors to do research in damage detection as a structural health monitoring approach. The problem may be equally design concepts, numerically as planning in FBG sensor placement, experimentally in static test and FBG sensor reading and nondestructive inspection for damage quantifying. Damage detection in a material modification and a structure problem is focused to verify the capability of FBG sensor.
In material modification problem: Arief et al (2011) revealed the effect of Vectran-stitch in laminate in various stitch density subjected to static and fatigue loads in-plane direction11-12. Tan et al (2009) examined the effectiveness of Vectran-stitch in mode I interlaminar fracture toughness and low velocity impact13-14. Yoshimura et al (2007) showed the effect of high stitch density in a laminate to tensile properties15. Mouritz et al (1997) reported the correlation between stitching and tensile performance16. Thuis et al (1996) revealed the reducing tensile properties caused by high density stitching. Most researchers showed how complex the failure mechanism of stitched laminate material17. Parts of them explained the increasing mechanical properties of laminate after stitching process induced, but others researcher explained contrary especially in in-plane direction. This indicated how the manufacturing process