Refractive index sensing with temperature
compensation by a multimode-interference
fiber-based optical frequency comb sensing
cavity
R
YOO
E,
1,2T
AKEOM
INAMIKAWA,
2,3,4S
HUJIT
AUE,
5H
IDENORIK
ORESAWA,
1,2T
AKAHIKOM
IZUNO,
2,3,4M
ASATOMOY
AMAGIWA,
2,3,4Y
ASUHIROM
IZUTANI,
2,6H
IROTSUGUY
AMAMOTO,
2,7T
ETSUOI
WATA,
2,4ANDT
AKESHIY
ASUI2,3,4*1Graduate School of Advanced Technology and Science, Tokushima University, 2-1, Minami-Josanjima,
Tokushima, Tokushima 770-8506, Japan
2JST, ERATO, MINOSHIMA Intelligent Optical Synthesizer Project, 2-1, Minami-Josanjima,
Tokushima, Tokushima 770-8506, Japan
3Institute of Post-LED Photonics (pLED), Tokushima University, 2-1, Minami-Josanjima, Tokushima,
Tokushima 770-8506, Japan
4Graduate School of Technology, Industrial and Social Sciences, Tokushima University, 2-1,
Minami-Josanjima, Tokushima, Tokushima 770-8506, Japan
5School of System Engineering, Kochi University of Technology, 185 Miyanokuchi, Tosayamada, Kami,
Kochi 782-8502, Japan
6Graduate School of Engineering, Osaka University, 2-1, Yamadaoka, Suita, Osaka 565-0871, Japan 7Center for Optical Research and Education, Utsunomiya University, 7-1-2, Yoto, Utsunomiya, Tochigi
321-8585, Japan
Abstract: We proposed a refractive index (RI) sensing method with temperature
compensation by using an optical frequency comb (OFC) sensing cavity including a multimode-interference (MMI) fiber, namely, the MMI-OFC sensing cavity. The MMI-OFC sensing cavity enables simultaneous measurement of material-dependent RI and sample temperature by decoding from the comb spacing frequency shift and the wavelength shift of the OFC. We realized the simultaneous and continuous measurement of RI-related concentration of a liquid sample and its temperature with precisions of 1.6 × 10⁻⁴ RIU and
0.08 °C. The proposed method would be a useful means for the various applications based on RI sensing.
© 2019 Optical Society of America under the terms of the OSA Open Access Publishing Agreement
1. Introduction
Refractive index (RI) is an important physical quantity of materials. Furthermore, RI is a useful parameter for the characterization and identification of materials, such as for the determination of the concentrations of liquid solutions [1], molecular identification [2] and biosensing [3]. The fiber-based RI sensor is a powerful means for RI measurement because of its compactness, simplicity, flexibility, noise robustness and availability in various environments and has been applied in many applications in sucrose sensing [4], gas pressure sensing [5] and biomolecule sensing [6]. In the conventional RI fiber sensors, which are based, for example, on surface plasmon resonance (SPR) [7], interference with a core-offset fiber [8] or multimode interference (MMI) [9], the change of RI is measured by a shift of transmitted optical spectrum. However, the sensitivity of the conventional RI sensing is limited due to the relatively broad bandwidth of a spectral dip (or peak) and spectral resolution of a spectrometer.
#367929 https://doi.org/10.1364/OE.27.021463
Journal © 2019 Received 20 May 2019; revised 21 Jun 2019; accepted 22 Jun 2019; published 16 Jul 2019 Corrected: 18 July 2019
To overcome this issue, RI fiber sensors based on radio-frequency (RF) signal measurement have been developed, in which the RI is retrieved by an RI-dependent optical beat signal generated using, for example, fiber Bragg gratings (FBGs) [10], Fabry-Perot interferometers [11], and chip-scale microring resonators [12]. To obtain a high-quality optical beat signal for highly sensitive RI measurement, we recently proposed an optical-frequency comb (OFC)-based RI sensor [13,14]. The OFC [15–17] is regarded as a group of a vast number of phase-locked narrow-linewidth continuous-wave (CW) light sources with a constant frequency spacing of frep (typically, 50–100 MHz) over a broad spectral range. The
OFC is widely applied for high precision spectroscopy or measurement; for instance, atomic spectroscopy [17], gas spectroscopy [18], solid spectroscopy [19], spectroscopic ellipsometry [20], strain sensing [21,22], ultrasonic-wave sensing [23], distance measurement [24,25], optical microscopy [26–29], and 3D shape measurement [30]. The OFC further has an interesting feature: a photonic RF conversion function in a fiber OFC cavity [13,14,22,23]. Our previous study [13,14] revealed that the OFC-based RI sensing can achieve an RI resolution of 4.88 × 10⁻⁶ RIU and RI accuracy of 5.35 × 10⁻⁵ RIU by the combination with an
MMI fiber sensor incorporated in the OFC cavity, namely, an MMI-OFC sensing cavity, which has accomplished an equivalent or higher sensitivity compared to the conventional RI-sensing fiber sensor.
Although the highly sensitive RI measurement was realized based on the MMI-OFC sensing cavity, further improvements of the sensitivity and stability of RI measurement was expected if the sample temperature fluctuation was stabilized or monitored. This is because the RI of a sample is dependent on the temperature of the sample, and the instability of the fiber structure at the sensing region due to temperature fluctuations led to the instability of RI measurement with the MMI-OFC sensing cavity.
In this article, to improve the RI measurement with the MMI-OFC sensing cavity, we realized simultaneous measurement of temperature with the same configuration of MMI-OFC-sensing cavity for RI measurement by simultaneous monitoring of an optical spectral shift in the optical frequency region and a comb spacing shift in the RF region of the OFC. We confirmed the fundamental sensitivity of the MMI-OFC sensing cavity depending on sample temperature and RI-related concentration of a liquid sample. Furthermore, we demonstrated simultaneous and continuous measurement of temperature and RI-related concentration of a liquid sample.
2. Principle of operation
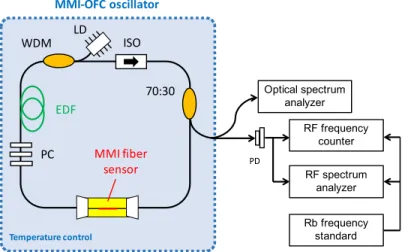
Figure 1 shows the configuration of an MMI-OFC sensing cavity. The MMI-OFC sensing cavity is comprised of a fiber OFC ring cavity with an intracavity MMI fiber sensor. The MMI fiber sensor is composed of a clad-less multi-mode fiber (MMF) with a pair of single-mode fibers (SMFs) at the two ends [9], and has good compatibility with fiber OFC cavities [13,14]. The intracavity MMI fiber sensor acts as a RI-dependent tunable optical bandpass filter at the multi-mode interference wavelength λMMI. λMMI is given by
( )
2 , MMF MMI MMF sam MMF n m D n L λ = (1)where nMMF is the RI of the MMF, LMMF is the geometrical length of the MMF, nsam is the RI
of the target sample, DMMF(nsam) is the effective core diameter of the MMF with a function of nsam, and m is the interference index of the MMI fiber sensor. Thus, the optical spectrum of
the OFC shows the RI-dependent shift owing to the intracavity MMI fiber sensor, namely, λMMI shift (∆λMMI).
On the other hand, the OFC exhibits the comb-tooth-like ultradiscrete multimode spectrum with a constant frequency spacing frep given by
, rep c f nL = (2)
where c is the speed of light in vacuum, n is the group RI of the cavity fiber, and L is the geometrical length of the fiber cavity. Since frep is determined by the optical cavity length nL,
it is sensitive to the cavity disturbance changing nL; in other words, frep can be used for
quantitative analysis of a physical quantity acting as the cavity disturbance. The intracavity MMI fiber sensor will change the optical cavity length at the intracavity MMI fiber sensor and the group RI of the cavity fiber owing to the spectral shift of the OFC, leading to the RI-dependent frep shift, namely, ∆frep.
λMMI and frep are shifted by a temperature change of a sample because the temperature
change leads to a change of sample RI and/or changes of RI and geometrical shape in the MMI sensor fiber. Thus, by observing ∆λMMI and ∆frep, we consider realizing the simultaneous
measurement of the RI and sample temperature as follows,
Δ
f
repΔ
λ
MMI
=
∂
f
rep∂
C
∂
f
rep∂
T
∂
λ
MMI∂
C
∂
λ
MMI∂
T
Δ
C
Δ
T
,
(3)where ∆C and ∆T are RI-related sample parameters, i.e., sample concentration and temperature, respectively. The coefficient matrix is comprised of the slope coefficients between ∆λMMI or ∆frep and ∆C or ∆T. From Eq. (3), if the coefficient matrix is regular, one
can determine ∆C and ∆T from the simultaneous measurement of ∆λMMI and ∆frep and the
inverse matrix calculation of them.
To demonstrate the MMI-OFC sensing cavity with the temperature compensated RI sensing, a custom-built ring-cavity erbium-doped fiber (EDF) laser with an intracavity MMI fiber sensor, which was mode-locked by a nonlinear polarization rotation technique, was employed as an OFC generator (the fundamental comb spacing or repetition rate, 43 MHz; the center wavelength, 1555 nm; and the spectral bandwidth, 15 nm). The intracavity MMI-fiber sensor was made with a core-less multimode MMI-fiber (MMF, the core diameter, 125 µm; the length, 58 mm, FG125LA, Thorlabs) spliced with single-mode fibers (SMF-28-100, Thorlabs) at each terminal. The intracavity MMI-fiber sensor was sunk in a liquid sample with a glass tube. The glass tube had an inlet port and an outlet port to externally change and stir the liquid sample. ∆λMMI or ∆frep were obtained with an optical spectrum analyzer (OSA,
AQ6315A, Yokogawa Electric Corp.), an RF spectrum analyzer (RFSA, E4402B, Keysight Technologies), or an RF frequency counter (53230A, Keysight Technologies).
Fig. 1. Schematic diagram of the MMI-OFC. PC, polarization controller for mode-locking; EDF, Er-doped fiber; WDM, wavelength division multiplexer; ISO, polarization independent isolator; 70:30, branch coupler; LD, laser diode; PD, photo detector.
3. Results
3.1 Temperature dependencies of ∆λMMI and ∆frep in the MMI-OFC sensing cavity
We first investigated ∆λMMI and ∆frep with respect to different sample temperatures. The
ethanol/water solution (ethanol concentration of 0−15% v/v with interval of 5% v/v) was used for samples with different temperatures (26.5−29.0 °C with interval of 0.5 °C). The same experiment was repeated for 3 sets of ethanol/water samples with each temperature, and their standard deviations under each of the samples’ temperatures were determined.
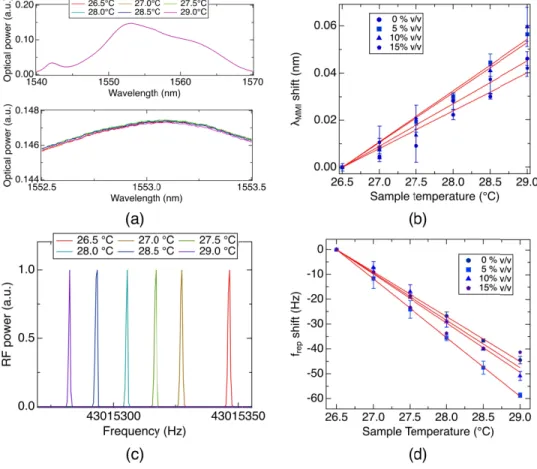
Figure 2(a) shows the temperature-dependent optical spectra of the MMI-OFC sensing cavity for the ethanol concentration of 0% v/v. Figure 2(b) shows the relation between sample temperature and ∆λMMI with respect to different ethanol concentrations. We confirmed the
temperature-dependent increase of ∆λMMI. The slope coefficients between temperature and ∆λMMI were determined to be 0.016 nm/°C for 0% v/v, 0.022 nm/°C for 5% v/v, 0.021 nm/°C
for 10% v/v, and 0.018 nm/°C for 15% v/v. Thus, the mean slope coefficient, namely, ∂λMMI/∂T, was obtained to be 0.020 nm/°C. The accuracy of the temperature-dependent ∆λMMI
was 3.9 × 10⁻³ nm, which was defined by the root mean square error between the measured
plots and its fitting line in Fig. 2(b).
Figure 2(c) shows the temperature-dependent RF spectra of the MMI-OFC sensing cavity for the ethanol concentration of 0% v/v. Figure 2(d) shows the relation between sample temperature and ∆frep with respect to different ethanol concentrations. We confirmed the
temperature-dependent decrease of ∆frep. The slope coefficients between temperature and ∆frep
were determined to be −18.01 Hz/°C for 0% v/v, −23.63 Hz/°C for 5% v/v, −19.74 Hz/°C for 10% v/v, and −19.00 Hz/°C for 15% v/v, respectively. Thus, the mean slope coefficient, namely, ∂frep/∂T, was found to be −20.46 Hz/°C. An opposite sign of slope coefficient
between the temperature-dependent ∆λMMI and ∆frep was obtained. The accuracy of the
temperature-dependent ∆frep was 1.17 Hz, which was defined by the root mean square error
between the measured plots and its fitting line in Fig. 2(d).
EDF WDM ISO 70:30 PC Optical spectrum analyzer MMIfiber sensor RF frequency counter RF spectrum analyzer Rb frequency standard PD Temperaturecontrol MMI-OFCoscillator LD
Fig. 2 shift w respec chang conce 3.2 RI-relate cavity We next inve different etha (ethanol conc different tem repeated for deviations we Figure 3(a cavity at a co concentration concentration ∆λMMI were de nm/% v/v for namely, ∂λMM dependent ∆λ between the m Figure 3( cavity at a co 2. Temperature-dep with respect to tem ct to different eth ge. (d) Temperatu entrations. ed concentrati estigated ∆λMM anol concentrat centrations of mperatures (26. 3 sets of etha ere determined a) shows the c onstant temper n and ∆λMMI w n-dependent inc etermined to b r 28.0 °C, and MI/∂C, was obta λMMI was 8.7 measured plots c) shows the onstant temper pendent optical sp mperature change. anol concentration ure sensitivity o ion dependen MI and ∆frep wi
tions of the liq 0−15% v/v wi 0−29.0 °C w anol/water sam
for each of the concentration-d rature of 26 °C with respect to crease of ∆λMM e 0.029 nm/% d 0.035 nm/% ained to be 0.0 × 10⁻³ nm, w
and its fitting concentration-rature of 26 °C
pectral shift and R (b) Temperature ns. (c) RF spectra f RF spectrum ncies of ∆λMMI ith respect to m quid sample w ith interval of ith interval of mples with eac
e sample conce dependent optic C. Figure 3(b) different sam MI. The slope co v/v for 26.0 °C v/v for 29.0 ° 0315 nm/% v/v which was def
line in Fig. 3(b -dependent RF C. Figure 3(d)
RF spectral shift. (a sensitivity of opti al shift with respe with respect to and ∆frep in th
material-depen were used. The
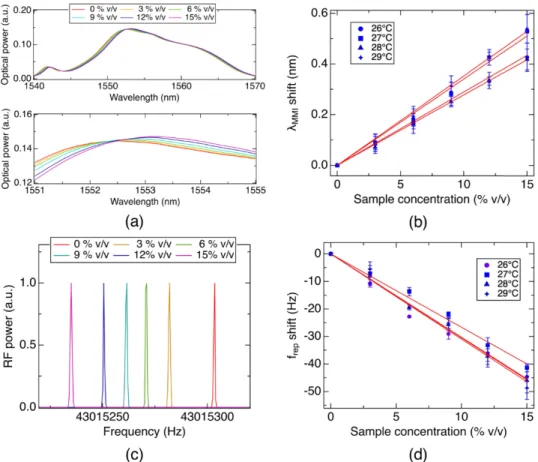
f 3% v/v) was f 1 °C). The ch concentrati entrations. cal spectra of ) shows the re mple temperatu oefficients betw C, 0.034 nm/% °C. Thus, the m v. The accurac fined by the r b). F spectra of t ) shows the re a) Optical spectral ical spectrum with ect to temperature different ethanol the MMI-OFC ndent RI for w e ethanol/water
used for samp same experim ion, and their the MMI-OFC elation betwee ures. We confi ween concentr % v/v for 27.0 ° mean slope co cy of the conce root mean squ
the MMI-OFC elation betwee l h e l C sensing which the r solution ples with ment was standard C sensing en sample irmed the ration and °C, 0.028 oefficient, entration-uare error C sensing en sample
concentration and ∆frep with respect to different sample temperatures. We confirmed the
concentration-dependent decrease of ∆frep. The slope coefficients between concentration and ∆frep were determined to be −3.10 Hz/% v/v for 26.0 °C, −2.66 Hz/% v/v for 27.0 °C, −3.05
Hz/% v/v for 28.0 °C, and −3.03 Hz/% v/v for 29.0 °C. Thus, the mean slope coefficient, namely, ∂frep/∂C, was obtained to be −2.96 Hz/% v/v. An opposite sign of the slope
coefficient between the concentration-dependent ∆λMMI and ∆frep was confirmed again. The
accuracy of the concentration-dependent ∆frep was 0.85 Hz, which was defined by the root
mean square error between the measured plots and its fitting line in Fig. 3(d).
According to the results of the temperature and RI-related concentration dependencies, we can estimate the precision of the MMI-OFC sensing cavity. The precision of the temperature measurement was 0.08°C, which is estimated from Eq. (3) by applying the accuracies of ∆λMMI of 3.9 × 10⁻³ nm and ∆frep of 1.17 Hz obtained by Figs. 2(b) and 2(d). The precision of
the RI-related concentration measurements with the MMI-OFC sensing cavity was estimated to be 0.34% v/v corresponding to 1.6 × 10⁻⁴ RIU, which is estimted from Eq. (3) by applying
the accuracies of ∆λMMI of 8.7 × 10⁻³ nm and ∆frep of 0.85 Hz obtained by Figs. 3(b) and 3(d).
This result indicates that the MMI-OFC sensing cavity has the potential for RI sensing with temperature compensation with high precision.
Fig. 3. Concentration-dependent optical spectral shift and RF spectral shift. (a) Optical spectral shift with respect to sample ethanol-concentration change. (b) Ethanol-concentration sensitivity of optical spectrum with respect to different sample temperature. (c) RF spectral shift with respect to ethanol-concentration change. (d) Ethanol-concentration sensitivity of RF spectrum with respect to different sample temperature.
3.3 Simultaneous measurement of temperature and concentration of a liquid sample To highlight the proposed method, we demonstrated simultaneous measurement of temperature and RI-related concentration of an ethanol/water solution.
We first increase the temperature of a sample stepwise from 26.5 °C to 29.0 °C by a heater attached to the liquid sample tube under a constant ethanol concentration of 0% v/v. We also gently stirred the sample by flowing it in and out using a syringe after changing the temperature to achieve a uniform temperature of the sample. As shown in Figs. 4(a) and 4(b), we clearly confirmed the temperature-dependent ∆λMMI increase and ∆frep decrease. Then, we
determined ∆C and ∆T by substituting the measured ∆λMMI and ∆frep for Eq. (3) as shown by
the blue line in Figs. 4(c) and 4(d). The determined ∆C and ∆T values well reflect their actual changes: stable concentration within 1% v/v and step-by-step increase of temperature by 0.5 °C within the deviation of below 0.3 °C from the actual change. If the temperature compensation was not performed, in which the change of sample RI was determined with only ∆frep, the estimation error of ∆C was degraded to 16.9% v/v by the temperature change
from 26.5 °C to 29.0 °C, as shown by the green line in Fig. 4(c).
Fig. 4. Simultaneous measurement of temperature and RI-related concentration of an ethanol/water solution under the variable temperature (26.5-29.0°C) and the constant ethanol concentration (0% v/v). (a) Temporal behavior of the λMMI shift. (b) Temporal behavior of frep
shift. (c) Temporal behavior of the sample concentration change estimated by using only ∆frep (green line) and by using both the ∆frep and ∆λMMI via Eq. (3) (blue line). (d) Temporal behavior
of the sample temperature change estimated by using both the ∆frep and ∆λMMI via Eq. (3) (blue line).The red line in Fig. 4(d) indicates the setting temperature of the ethanol/water solution. The arrows indicate the times at which the temperature was changed. The arrow heads indicate the times at which the sample was stirred.
We next increase the sample concentration stepwise from 0% v/v to 15% v/v by adding ethanol with a pipette under a constant temperature (26.0 °C). We also gently stirred the sample by flowing it in and out using a syringe after the ethanol application to achieve a uniform sample concentration. As shown in Figs. 5(a) and 5(b), we clearly confirmed the concentration-dependent ∆λMMI increase and ∆frep decrease. Then, we determined ∆C and ∆T
by substituting the measured ∆λMMI and ∆frep for Eq. (3) as shown by the blue line in Figs. 5(c)
and 5(d). The determined ∆C and ∆T values again well reflect their actual changes. The measurement stability was approximately 1% v/v in the concentration estimation and below 0.2 °C in the temperature estimation. Importantly, even in the fixed temperature condition, the temperature instability due to the limited control capability of the sample temperature can be compensated by using the proposed method.
Fig. 5. Simultaneous measurement of temperature and RI-related concentration of an ethanol/water solution under the constant temperature (26.0°C) and the variable ethanol concentration (0-15% v/v). (a) Temporal behavior of the λMMI shift. (b) Temporal behavior of frep shift. (c) Temporal behavior of the estimated sample concentration change (blue line). The
red line in Fig. 5(c) indicates the actual concentration of the ethanol/water solution. (d) Temporal behavior of the estimated sample temperature change. The arrows indicate the times
stirred.
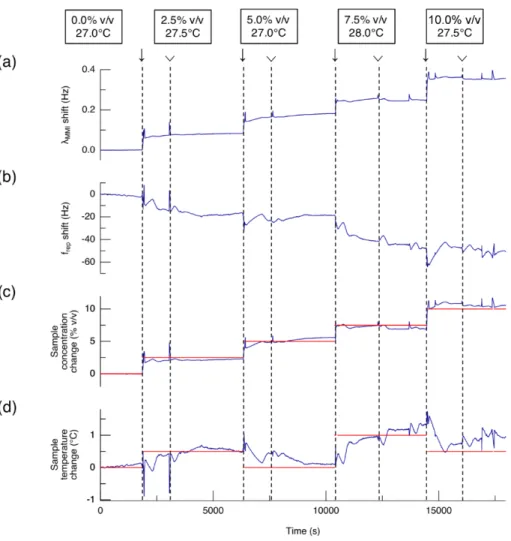
We finally changed both the concentration and temperature of a sample. The protocol of the experiment is as follows:
(1) The ethanol concentration and temperature were initially set to 0% v/v and 27.0 °C, respectively.
(2) The ethanol concentration and temperature were simultaneously increased by 2.5% v/v and 0.5 °C, respectively.
(3) The ethanol concentration and temperature were simultaneously increased by 2.5% v/v and decreased by 0.5°C, respectively.
(4) The ethanol concentration and temperature were simultaneously increased by 2.5% v/v and 1.0 °C, respectively.
(5) The ethanol concentration and temperature were simultaneously increased by 2.5% v/v and decreased by 0.5 °C, respectively.
These changes were sensitively reflected in ∆λMMI and ∆frep, as shown in Figs. 6(a) and
6(b), respectively. By using Eq. (3), ∆C and ∆T were determined, as shown by the blue line in Figs. 6(c) and 6(d). Both ∆C and ∆T could be determined with reasonable precisions even with the simultaneous changes in sample temperature and concentration. These results indicated the feasibility of the MMI-OFC sensing cavity for the temperature-compensated RI sensing or the simultaneous measurement of the material-depended RI and the sample temperature.
Fig. 6. Simultaneous measurement of temperature and RI-related concentration of an ethanol/water solution under the variable temperature and the variable ethanol concentration. (a) Temporal behavior of the λMMI shift. (b) Temporal behavior of frep shift. (c) Temporal
behavior of the estimated sample concentration change. (d) Temporal behavior of the estimated sample temperature change. The red line in Figs. 6(c) and 6(d) respectively indicate the actual concentration of the ethanol/water solution and the setting temperature of the ethanol/water solution. The arrows indicate the times at which the temperature was changed and/or the ethanol was applied. The arrow heads indicate the times at which the sample was stirred.
4. Discussion
In the proposed MMI-OFC sensing cavity, the RI sensing with temperature compensation was realized by observing the optical spectral shift ∆λMMI and the RF spectral shift ∆frep. Our
finding is that the material-dependent RI and the sample temperature can change both the ∆λMMI and ∆frep, although with different slope coefficients. First, we discuss the detection
mechanism to corroborate the regularity of the slope coefficient matrix in Eq. (3). The concentration of the sample can change the RI of the sample. The temperature of the sample can change not only the RI of the sample via the thermo-optic effect but also the RI of the MMF, the length of the MMF and the diameter of the MMF via the thermo-optic effect or the thermal expansion effect. Thus, the partial derivatives of λMMI against concentration and
, sam MMI MMI sam n C n C λ λ ∂ ∂ =∂ ∂ ∂ ∂ (4) . sam
MMI MMI MMI MMF MMI MMF MMI MMF
sam MMF MMF MMF n n L D T n T n T L T D T λ λ ∂ λ λ λ ∂ =∂ +∂ ∂ +∂ ∂ + ∂ ∂ ∂ ∂ ∂ ∂ ∂ ∂ ∂ ∂ ∂ (5)
In contrast, as shown in Eq. (2), the repetition frequency frep is a function of cavity
parameters, including the geometrical length of the fiber cavity, which would be modulated by the diameter and the length of the MMF, and the RI of the fiber cavity. The repetition frequency frep is also a function of the RI of the sample because the RI-dependent wavelength
shift of the MMI fiber sensor must change the optical length of the cavity via the wavelength dispersion of the cavity fiber. In the same manner as the interference wavelength λMMI, the
partial derivatives of frep against concentration and temperature are given by,
,
rep rep sam
sam f f n C n C ∂ = ∂ ∂ ∂ ∂ ∂ (6) .
rep rep sam rep MMF rep MMF rep MMF
sam MMF MMF MMF
f f n f n f L f D
T n T n T L T D T
∂ = ∂ ∂ + ∂ ∂ + ∂ ∂ + ∂ ∂
∂ ∂ ∂ ∂ ∂ ∂ ∂ ∂ ∂ (7)
Therefore, the discriminant equation of the coefficient matrix of Eq. (3) can be expressed with Eqs. (4)-(7) as follows,
rep MMI rep MMI
rep MMI rep MMI MMF
sam MMF MMF sam
rep rep
sam MMI MMI MMF
sam MMF MMF sam
rep MMI rep MMI MM
sam MMF MMF sam f f D C T T C f f n n n n n T f f n L C n L L n T f f D n D D n λ λ λ λ λ λ λ λ ∂ ∂ ∂ ∂ = − ∂ ∂ ∂ ∂ ∂ ∂ ∂ − ∂ ∂ ∂ ∂ ∂ ∂ ∂ ∂ ∂ ∂ ∂ ∂ ∂ = + − ∂ ∂ ∂ ∂ ∂ ∂ ∂ ∂ ∂ ∂ ∂ + − ∂ ∂ ∂ ∂ . F T ∂ (8)
According to the discriminant equation of the coefficient matrix, the importance of the detection mechanism is the presence of the temperature dependent changes of the MMI fiber sensor, i.e., the RI, the geometrical length and the diameter of the MMF. Since our results indicated that the discriminant equation is not 0, in other words, the slope coefficient matrix is regular, the temperature dependent MMF change was effectively utilized for the simultaneous measurement of the RI sensing with temperature compensation using the MMI-OFC sensing cavity.
We also discuss the validity of the slope coefficients of the ∆λMMI and the ∆frep. These
slope coefficients are determined by the concentration-dependent and temperature-dependent change of sample RI nsam. In general, it is known that the water/ethanol mixture shows a
concentration-dependent RI change on the order of 5 × 10⁻⁴ (RIU/% v/v) [31] and
temperature-dependent RI change on the order of 1 × 10⁻⁴ (RIU/°C) [32]. Therefore, these RI
changes are comparable to each other, as shown in our results. In our previous research, the RI sensitivity of the MMI sensor used in this experiment was 130.3 nm/RIU [13]. From these values, the concentration-dependent and temperature-dependent ∆λMMI slopes are estimated as
0.061 nm/% v/v and 0.013 nm/°C, which are in reasonable agreement with the experimental data. An RI sensitivity of −6.19 × 10³ Hz/RIU was determined by RI-dependent ∆λ
MMI and the
slope coefficient of −2.90 Hz/% v/v was estimated, which is comparable to the experimental value ( = −2.96 Hz/% v/v). In the same manner, a temperature-dependent ∆frep with slope
coefficient of −10.72 Hz/°C is calculated. This theoretical value was slightly different from the experimental value ( = −20.46 Hz/°C), this might be due to the presence of the temperature-dependent shape change of the MMI fiber sensor. Further study is required to evaluate the temperature effect on the MMI fiber sensor for the ∆frep measurement, which will
clarify the mechanism of the refractive index sensing with temperature compensation for more detail.
The limitation of this study is the accuracy of the temperature measurement. Although the effect of the temperature-compensated RI measurement was demonstrated in this study, the precision of the temperature measurement was still limited to 0.08 °C. The accuracy of the temperature measurement was also limited by the variation of the slope coefficients as shown in Figs. 2 and 3. To improve the accuracy of the temperature measurement, one possibility is to employ an all polarization-maintaining (PM) fiber-based OFC sensing cavity, which might be stable against environmental perturbations owing to the insensitive property of the PM fiber against the environmental perturbations. Although further studies are required for the practical application, we believe that our findings of the simultaneous measurement capability of temperature and RI-related concentration will improve the RI sensing with the MMI-OFC sensing cavity.
5. Conclusion
In conclusion, we proposed an RI sensing method with temperature compensation by using an MMI-OFC sensing cavity. We provided a proof-of-principle demonstration of the proposed method by the simultaneous measurement of temperature- and concentration-dependent spectral shifts of ∆λMMI and ∆frep slopes, realizing the simultaneous measurement of
temperature and concentration of a liquid sample. We expected that the RI sensing with temperature compensation based on the MMI-OFC sensing cavity will be an effective way to precisely characterize and identify materials in various fields and opens a new aspect of OFC-based instrumentations.
Funding
Exploratory Research for Advanced Technology (ERATO) MINOSHIMA Intelligent Optical Synthesizer Project (JPMJER1304), Japan Science and Technology Agency (JST), Japan; Grant-in-Aid for Exploratory Research (15K13384) from the Japan Society for the Promotion of Science (JSPS).
Acknowledgments
The authors thank Ms. Natsuko Takeichi and Ms. Shoko Lewis, Tokushima University, for the English proofreading of the manuscript.
References
1. R. Budwig, “Refractive index matching methods for liquid flow investigations,” Exp. Fluids 17(5), 350–355 (1994).
2. C. Wu, A. B. Khanikaev, R. Adato, N. Arju, A. A. Yanik, H. Altug, and G. Shvets, “Fano-resonant asymmetric metamaterials for ultrasensitive spectroscopy and identification of molecular monolayers,” Nat. Mater. 11(1), 69–75 (2011).
3. A. V. Kabashin, P. Evans, S. Pastkovsky, W. Hendren, G. A. Wurtz, R. Atkinson, R. Pollard, V. A. Podolskiy, and A. V. Zayats, “Plasmonic nanorod metamaterials for biosensing,” Nat. Mater. 8(11), 867–871 (2009). 4. S. K. Chauhan, N. Punjabi, D. K. Sharma, and S. Mukherji, “A silicon nitride coated LSPR based fiber-optic
probe for possible continuous monitoring of sucrose content in fruit juices,” Sens. Actuators B Chem. 222, 1240–1250 (2016).
5. B. Sutapun, M. Tabib-Azar, and A. Kazemi, “Pd-coated elastooptic fiber optic Bragg grating sensors for multiplexed hydrogen sensing,” Sens. Actuators B Chem. 60(1), 27–34 (1999).
biosensing,” Opt. Express 16(25), 20834–20847 (2008).
7. D. Monzón-Hernández and J. Villatoro, “High-resolution refractive index sensing by means of a multiple-peak surface plasmon resonance optical fiber sensor,” Sens. Actuators B Chem. 115(1), 227–231 (2006).
8. G. Yin, S. Lou, and H. Zou, “Refractive index sensor with asymmetrical fiber Mach–Zehnder interferometer based on concatenating single-mode abrupt taper and core-offset section,” Opt. Laser Technol. 45, 294–300 (2013).
9. H. Fukano, T. Aiga, and S. Taue, “High-sensitivity fiber-optic refractive index sensor based on multimode interference using small-core single-mode fiber for biosensing,” Jpn. J. Appl. Phys. 53(4S), 04EL08 (2014). 10. Y. Yang, M. Wang, Y. Shen, Y. Tang, J. Zhang, Y. Wu, S. Xiao, J. Liu, B. Wei, Q. Ding, and S. Jian,
“Refractive index and temperature sensing based on an optoelectronic oscillator incorporating a Fabry-Perot fiber Bragg grating,” IEEE Photonics J. 10(1), 6800309 (2018).
11. J. Zhang, Q. Sun, R. Liang, J. Wo, D. Liu, and P. Shum, “Microfiber Fabry-Perot interferometer fabricated by taper-drawing technique and its application as a radio frequency interrogated refractive index sensor,” Opt. Lett.
37(14), 2925–2927 (2012).
12. L. Stern, A. Naiman, G. Keinan, N. Mazurski, M. Grajower, and U. Levy, “Ultra-precise optical to radio frequency based chip-scale refractive index and temperature sensor,” Optica 4(1), 1–7 (2017).
13. R. Oe, S. Taue, T. Minamikawa, K. Nagai, K. Shibuya, T. Mizuno, M. Yamagiwa, Y. Mizutani, H. Yamamoto, T. Iwata, H. Fukano, Y. Nakajima, K. Minoshima, and T. Yasui, “Refractive-index-sensing optical comb based on photonic radio-frequency conversion with intracavity multi-mode interference fiber sensor,” Opt. Express
26(15), 19694–19706 (2018).
14. R. Oe, T. Minamikawa, S. Taue, T. Nakahara, H. Koresawa, T. Mizuno, M. Yamagiwa, Y. Mizutani, H. Yamamoto, T. Iwata, Y. Nakajima, K. Minoshima, and T. Yasui, “Improvement of dynamic range and repeatability in a refractive-index-sensing optical comb by combining saturable-absorber-mirror mode-locking with an intracavity multimode interference fiber sensor,” Jpn. J. Appl. Phys. 58(6), 060912 (2019).
15. T. Udem, J. Reichert, R. Holzwarth, and T. W. Hänsch, “Accurate measurement of large optical frequency differences with a mode-locked laser,” Opt. Lett. 24(13), 881–883 (1999).
16. T. Udem, R. Holzwarth, and T. W. Hänsch, “Optical frequency metrology,” Nature 416(6877), 233–237 (2002). 17. M. Niering, R. Holzwarth, J. Reichert, P. Pokasov, T. Udem, M. Weitz, T. W. Hänsch, P. Lemonde, G.
Santarelli, M. Abgrall, P. Laurent, C. Salomon, and A. Clairon, “Measurement of the hydrogen 1S- 2S transition frequency by phase coherent comparison with a microwave cesium fountain clock,” Phys. Rev. Lett. 84(24), 5496–5499 (2000).
18. S. A. Diddams, L. Hollberg, and V. Mbele, “Molecular fingerprinting with the resolved modes of a femtosecond laser frequency comb,” Nature 445(7128), 627–630 (2007).
19. A. Asahara, A. Nishiyama, S. Yoshida, K. I. Kondo, Y. Nakajima, and K. Minoshima, “Dual-comb spectroscopy for rapid characterization of complex optical properties of solids,” Opt. Lett. 41(21), 4971–4974 (2016). 20. T. Minamikawa, Y.-D. Hsieh, K. Shibuya, E. Hase, Y. Kaneoka, S. Okubo, H. Inaba, Y. Mizutani, H.
Yamamoto, T. Iwata, and T. Yasui, “Dual-comb spectroscopic ellipsometry,” Nat. Commun. 8(1), 610 (2017). 21. N. Kuse, A. Ozawa, and Y. Kobayashi, “Static FBG strain sensor with high resolution and large dynamic range
by dual-comb spectroscopy,” Opt. Express 21(9), 11141–11149 (2013).
22. T. Minamikawa, T. Ogura, Y. Nakajima, E. Hase, Y. Mizutani, H. Yamamoto, K. Minoshima, and T. Yasui, “Strain sensing based on strain to radio-frequency conversion of optical frequency comb,” Opt. Express 26(8), 9484–9491 (2018).
23. T. Minamikawa, T. Masuoka, T. Ogura, K. Shibuya, R. Oe, E. Hase, Y. Nakajima, Y. Yamaoka, T. Mizuno, M. Yamagiwa, Y. Mizutani, H. Yamamoto, T. Iwata, K. Minoshima, and T. Yasui, “Ultrasonic wave sensing using an optical-frequency-comb sensing cavity for photoacoustic imaging,” OSA Continuum 2(2), 439–449 (2019). 24. K. Minoshima and H. Matsumoto, “High-accuracy measurement of 240-m distance in an optical tunnel by use of
a compact femtosecond laser,” Appl. Opt. 39(30), 5512–5517 (2000).
25. I. Coddington, W. C. Swann, L. Nenadovic, and N. R. Newbury, “Rapid and precise absolute distance measurements at long range,” Nat. Photonics 3(6), 351–356 (2009).
26. T. Ideguchi, S. Holzner, B. Bernhardt, G. Guelachvili, N. Picqué, and T. W. Hänsch, “Coherent Raman spectro-imaging with laser frequency combs,” Nature 502(7471), 355–358 (2013).
27. E. Hase, T. Minamikawa, T. Mizuno, S. Miyamoto, R. Ichikawa, Y.-D. Hsieh, K. Shibuya, K. Sato, Y. Nakajima, A. Asahara, K. Minoshima, Y. Mizutani, T. Iwata, H. Yamamoto, and T. Yasui, “Scan-less confocal phase imaging based on dual-comb microscopy,” Optica 5(5), 634–643 (2018).
28. E. Hase, T. Minamikawa, S. Miyamoto, R. Ichikawa, Y.-D. Hsieh, Y. Mizutani, T. Iwata, H. Yamamoto, and T. Yasui, “Scan-Less, Kilo-Pixel, Line-Field Confocal Phase Imaging with Spectrally Encoded Dual-Comb Microscopy,” IEEE J. Sel. Top. Quant. 25(1), 2879017 (2019).
29. K. Shibuya, T. Minamikawa, Y. Mizutani, H. Yamamoto, K. Minoshima, T. Yasui, and T. Iwata, “Scan-less hyperspectral dual-comb single-pixel-imaging in both amplitude and phase,” Opt. Express 25(18), 21947–21957 (2017).
30. T. Kato, M. Uchida, and K. Minoshima, “No-scanning 3D measurement method using ultrafast dimensional conversion with a chirped optical frequency comb,” Sci. Rep. 7(1), 3670 (2017).
31. J. V. Herráez and R. Belda, “Refractive indices, densities and excess molar volumes of monoalcohols + water,” J. Solution Chem. 35(9), 1315–1328 (2006).
32. A. N. Bashkatov and E. A. Genina, “Water refractive index in dependence on temperature and wavelength: a simple approximation,” Proc. SPIE 5068, 393–395 (2003).