九州大学学術情報リポジトリ
Kyushu University Institutional Repository
Mechanisms of endothelial cell coverage by pericytes: computational modelling of cell wrapping and in vitro experiments
杉原, 圭
http://hdl.handle.net/2324/4060054
出版情報:九州大学, 2019, 博士(医学), 課程博士 バージョン:
権利関係:やむを得ない事由により本文ファイル非公開 (2)
Mechanisms of endothelial cell coverage by pericytes: computational modelling of cell wrapping and in vitro experiments
J R Soc Interface. 2020 Jan;17(162):20190739.
https://royalsocietypublishing.org/doi/10.1098/rsif.2019.0739
Kei Sugihara1, Saori Sasaki2,5, Akiyoshi Uemura3, Satoru Kidoaki2 and Takashi Miura1,4
1Department of Anatomy and Cell Biology, Graduate School of Medical Sciences, Kyushu University, Fukuoka, Japan,2Laboratory of Biomedical and Biophysical Chemistry, Institute for Materials Chemistry and Engineering, Kyushu University, Fukuoka, Japan,
3Department of Retinal Vascular Biology, Nagoya City University Graduate School of Medical Sciences, Nagoya, Japan,4CREST, Japan Science and Technology Agency, Kawaguchi, Japan,5Current Address: Department of Mechanical Engineering, Graduate School of Engineering, Kyushu University, Fukuoka, Japan
Author correspondence: Kei Sugihara [email protected], Takashi Miura miura [email protected]
Abstract
Pericytes (PCs) wrap around endothelial cells (ECs) and perform diverse functions in physiological and pathological processes. Although molecular interactions between ECs and PCs have been extensively studied, the morphological processes at the cellular level and their underlying mechanisms have remained elusive. In this study, using a simple cellular Potts model, we explored the mechanisms for EC wrapping by PCs. Based on the observedin vitro cell wrapping in 3D PC–EC coculture, the model identified four putative contributing factors: preferential adhesion of PCs to the extracellular matrix (ECM), strong cell–cell adhesion, PC surface softness, and larger PC size. While cell–cell adhesion can contribute to the prevention of cell segregation and the degree of cell wrapping, it cannot determine the
orientation of cell wrapping alone. While atomic force microscopy revealed that PCs have a larger Young’s modulus than ECs, the experimental analyses supported preferential ECM adhesion and size asymmetry. We also formulated the corresponding energy minimization problem and numerically solved this problem for specific cases. These results give biological insights into the role of PC–ECM adhesion in PC coverage. The modelling framework presented here should also be applicable to other cell wrapping phenomena observed in vivo.
Keywords
cellular Potts model; pericyte; vascular morphogenesis; cell wrapping
1 Introduction
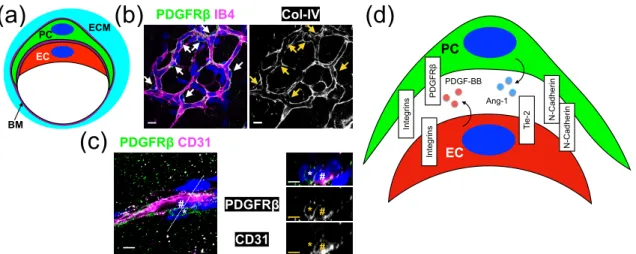
PCs wrap around vascular ECs in smaller vessels including capillaries and venules, and play diverse functions in physiological and pathological processes. Typically, PCs are sandwiched by the basement membrane, but also have direct contact with ECs (figure 1a–c).
They are observed not only in mature vessels, but also in immature vessels or vascular sprouts. As physiological functions, PCs contribute to vascular remodelling, stabilization, and integrity [1], as well as blood flow regulation through their contractility [2, 3]. They also work in the context of regeneration, fibrosis, tumour angiogenesis, and diabetic retinopathy [4].
The molecular interaction between PCs and ECs has been extensively researched (figure 1d). One of the best known factors involved in this is platelet-derived growth factor receptor (PDGFR) signalling during angiogenesis [5]. PCs, which express PDGFRβ, are recruited to the blood vessels by PDGF-BB secreted by ECs, especially their tip cells at the end of the vascular sprouts [6]. At the direct contact between PCs and ECs, N-cadherin acts as a cell adhesion molecule [7, 8]. Integrins have also been researched, but the focus has mainly been placed on TGFβ activation [9, 10]. The vascular phenotypes of several mural
cell-specific integrin subtype-deficient mouse lines have been reported. Integrinβ1-deficient PCs failed to wrap around capillary vessels, although they existed in greater numbers and were located adjacent to the vessels [11]. However, the loss of integrinα5 or α6 in mural cells had no apparent effect on physiological vascular morphology [12, 13].
Although vascular morphogenesis is of great interest in mathematical and computational biology, the mechanism by which PCs cover ECs has not been elucidated. A large number of models have been proposed for vascular morphogenesis, including vasculogenesis [14, 15], angiogenesis [16], and remodelling [17]. However, few models in vascular morphogenesis consider mural cells or PCs [18–20]. Notably, to the best of our knowledge, none of the models focused on the cellular morphology. One reason for this is the dearth of good model frameworks to deal with cellular morphology.
The cellular Potts model (CPM), or Glazier–Graner–Hogeweg model, is a lattice-based computational modelling framework and one of the few models that can deal with cellular morphology. The model was initially developed for multicellular cell sorting, where different cell types segregate with each other in multicellular aggregates [21, 22]. Thanks to its intuitive representation of cells as assemblies of lattices and the ease of combining multiscale mechanisms, this modelling framework was applied to many complex biological phenomena including vascular morphogenesis as a tool for in silico experiments [15, 23, 24]. In contrast, few theoretical or analytical studies have been performed on this modelling framework, possibly because of its complexity.
In this study, to reveal the mechanism of EC wrapping by PCs, we explored the mechanistic components contributing to the simplified phenomenon using a two-dimensional (2D) CPM. We identified four putative contributors: preferential ECM adhesion of PCs, PC surface softness, cellular size asymmetry, and strong cell–cell adhesion. While PCs showed larger Young’s moduli than ECs, as revealed by atomic force microscopy (AFM), experimental and bioinformatic analyses supported stronger PC adhesion to ECM and an asymmetry in size between PCs and ECs. By formulating and numerically solving the corresponding mechanical model as an energy minimization problem, we also gained theoretical insights into the numerical results of our computational model.
2 Methods
2.1 Model
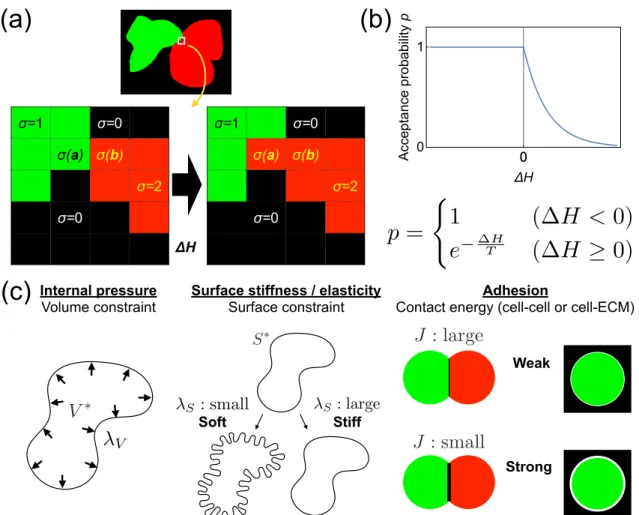
In this study, we explored the process of PC coverage using a simple 2D CPM. CPM is a lattice-based model in which each pixel has its own cell ID σ(i) and each cell ID has its own cell typeτ(σ(i)) (figure 2a). An energy function (called the HamiltonianH) is defined for each condition. For time evolution, a pixel is chosen randomly, and the cell ID of a neighbour is assumed to be copied to the chosen pixel. Based on the calculated difference of the Hamiltonian ∆H, it is then decided whether or not to accept this process according to the acceptance probability p = min(1,exp(−∆HT )) (figure 2b). T denotes the degree of surface fluctuation, an analogy from thermal fluctuations (temperature) in statistical mechanics.
We only considered two cells with different cell types (PC and EC). We defined the HamiltonianH as follows (figure 2c):
H = Hadhesion+Hvolume+Hsurface
= X
i,j: neighbour
J(τ(σ(i)), τ(σ(j)))(1−δσ(i),σ(j))
+X
σ
λV,τ(σ)
Vσ−Vτ(σ)∗ 2
+X
σ
λS,τ(σ)
Sσ−Sτ(σ)∗ 2
.
In this model, basically we incorporated two general properties of cells into the energy function: contact-dependent adhesion and size conservation for volume and surface area.
For adhesion,J represents an adhesion energy parameter for a cell-type pair. δ is Kronecker delta. For size conservation, we considered that the cells tended to retain their volumeV∗ and surface areaS∗with cell-type-specific elastic coefficientsλ. V represents a volume (area in 2D) of a cell, andS stands for surface area (perimeter in 2D). Surface area constraints did not appear in the first CPM, but were introduced later with the negative adhesion parameterJ <0 to improve the agreement with the actual biological conditions [25]. In the simplest possible form, the surface area constraints can be integrated into the contact
energy term as interfacial tension. However, we introduced this surface constraint because it is natural to assume that cells maintain their surface area in a contact-independent manner and this term also allows us to distinguish the cell surface elasticity from the effects of adhesion and cohesion [26].
All CPM simulations were performed using CompuCell3D 3.7.7 or 3.7.8 [27]. We defined the neighbour order for copying attempts and adhesion energy calculation as 2, which means each pixel has eight neighbour pixels. We regarded one Monte Carlo step (MCS) as N2 trials (N: domain lattice number). To prevent unrealistic fragmentation of cells, we also imposed a penalty on the Hamiltonian if a cell is fragmented [23], by using the Connectivity plugin in the CompuCell3D system. The Coverage Index was defined as the ratio of PC–EC interface area to the total EC surface area. For all simulations, we set the initial condition as the square cells (PC and EC) of 20 pixels×20 pixels, adjacent to each other. Unless otherwise specified, the Coverage Index was represented by calculating the mean value at 2000 MCS for five independent simulation trials. All sets of parameters used in this study are described in electronic supplementary material (ESM).
2.2 Whole-mount mouse retina immunohistochemistry
Retinas were collected from ICR mice at postnatal day 5 (Japan SLC). After fixation, permeabilization, and blocking, the retinas were incubated with primary antibodies overnight and then with secondary antibodies and other staining reagents overnight at 4◦C (listed in ESM). The samples were observed with a Nikon A1 confocal microscope.
2.3 Cell culture
Human umbilical vein endothelial cells (HUVEC, C2517A; Lonza) and RFP Expressing Human Umbilical Vein Endothelial Cells (RFP-HUVEC, cAP-0001RFP; Angio-Proteomie) were cultured in Endothelial Cell Growth Medium 2 (ECGM2, C-22111; PromoCell) and used up to passage 7. Human pericytes from placenta (hPC-PL, C-12980; PromoCell) and GFP Expressing Human Placental Microvascular Pericytes (GFP-PC, cAP-0029GFP;
Angio-Proteomie) were cultured in Pericyte Growth Medium (PGM, C-28040; PromoCell) and used up to passage 6.
2.4 2D and 3D in vitro experimental models
For 2D culture, a 1:1 mix of hPC-PL stained with CellTracker Green CMFDA (C7025;
Thermo Fisher Scientific) and HUVEC stained with Rhodamine-conjugated UEA-I lectin (RL-1062; Vector Laboratories) was sparsely seeded. For 3D culture, 4.0×10⁵ CMFDA-
stained hPC-PL and HUVEC stained with CellTracker Red CMTPX (C34552; Thermo Fisher Scientific) were centrifuged together. The cell pellets were gently suspended and incubated in type I collagen gel (Cellmatrix I-A, KP-7000; Nitta Gelatin) for 4 h. Cells were observed by live imaging using the stage-top incubator or the observation was performed after fixation using a Nikon A1 microscope.
2.5 Atomic force microscopy
HUVEC and hPC-PL were harvested and sparsely subcultured on glass-bottomed dishes 2 days before the measurement. For measurements of cell stiffness, a QI mode atomic force microscope system (AFM, JPK NanoWizard 4; JPK Instruments, Germany) was used.
A force–indentation curve was acquired by the indentation test. The probe was silicon tip rounded to a nominal tip radius of 30 nm with 0.06 N/m nominal spring constants (qp-BioAC-CI; Nanocensors, Switzerland), and the indenting force was 500 pN for all of the AFM measurements. Measurements were performed in the supranuclear region of the cell. 16 points per cell were automatically selected at the interval of 1.25–2.5 µm. All measurements were carried out in the corresponding culture medium under atmospheric pressure. The sample was maintained at 37◦C by a Petri dish heater (JPK Instruments, Germany). Young’s modulus of the cell was calculated according to the Hertz model [28,29].
The semivertical angle was 18.42◦ and Poisson’s ratio was 0.5. The points not well fitted were excluded from the analysis. The reproducibility was ensured by two independent experiment sets performed on different dates.
2.6 Actin cytoskeleton staining and quantification
After fixation, permeabilization, and blocking, sparsely seeded cells were incubated with Alexa Fluor 488 Phalloidin (1:40, A12379; Thermo Fisher Scientific) and Hoechst 33342 (1:500, H342; Dojindo) for 1 h at room temperature. Cells were observed using a Nikon A1 confocal microscope. Image processing was performed using Fiji [30]. For signal intensity quantification in supranuclear regions, max projection images of phalloidin staining z-stack higher than the nuclear centre plane were used. Mean signal intensity was determined for each microscopic field (128×128µm).
2.7 Cell size quantification
For size quantification, cells were stained with CMFDA and Hoechst 33342. Cells were sparsely cultured on dish or in Matrigel (356237; Corning) for 2D and 3D culture respectively.
Cells were fixed and then observed using a Nikon A1 confocal microscope. Image processing performed using Fiji is described in ESM.
2.8 Adhesion assay
Flat-bottomed 96-well plates (167008; Thermo Fisher Scientific) were coated with ECM components: CellMatrix type I-C or IV (1:10 dilution in HCl (pH 3.0), 631-00771 or 638-05921; Nitta Gelatin), 4% Matrigel, 10µg/mL laminin (L2020; Sigma), or 20µg/mL fibronectin (194931; MP Biomedicals). After treatment by 1% BSA, a total of 2×10⁴ cells per well were seeded. After 30 min of incubation, attached cells were fixed and stained with 5 mg/mL Crystal Violet solution (09803-62; Nacalai Tesque). Cells were lysed using 2%
SDS solution and absorbance at 570 nm was measured using Thermo Scientific Multiskan FC.
2.9 Bioinformatic analysis
From GEO Datasets, we found two datasets using the same cell origins as ours: GSE109322 (RNA-seq, [31]) and GSE86885 (microarray, [32]). For RNA-seq data, the data preprocessed
using cuffdiff [33] in the work of [31] were used for the subsequent analyses. For microarray data, we performed the gene expression analysis using GEO2R. GO enrichment analyses were performed for the differentially expressed genes, defined as those with log2FC≥1 and adjustedpvalue<0.05, using DAVID 8.6 [34]. Illumina probe IDs and gene symbols were converted to Ensembl Gene IDs using illuminaHumanv4.db in Bioconductor [35]. Data visualization was performed using Mathematica (Wolfram Research).
2.10 Quantitative reverse-transcription PCR (RT-qPCR)
Total RNA samples were extracted from cultured HUVEC and hPC-PL using Trizol Reagent (15596018; Ambion Life Technologies) or Sepasol-RNA I Super G (09379-84; Nacalai Tesque).
They were then reverse-transcribed to cDNA using ReverTra Ace qPCR RT Kit (FSQ-101;
Toyobo). Quantitative PCR was performed using an Applied Biosystems 7500 instrument (Applied Biosystems) and THUNDERBIRD SYBR qPCR Mix (QPS-201; Toyobo). Relative fold differences of mRNA expression were calculated using theGAPDH reference gene by the relative standard curve method. Primers used in this study are listed in ESM.
2.11 Spheroid experiment
Spheroids consisting of 5×10² cells each of RFP-HUVEC and GFP-PC were formed overnight in PrimeSurface 3D Culture Spheroid Plates (MS-9096U; Sumitomo Bakelite Co., Ltd) in 1:1 mix of ECGM-2 and PGM. They were collected and gently dissolved in the gel solution containing 3.0 mg/mL type-I collagen (PSC-1-100; Nippi) and 20% Matrigel.
Integrinβ1 functional blocking antibody (AIIB2, MABT409; Merck) was mixed directly into the gel. After 30-minute gelation at 37◦C, spheroids were incubated for 8 h. After fixation, they were stained with DAPI (1:1000, D523; Dojindo) and optically cleared for 3–4 days by Scale A2 [36] before the observation by Nikon A1 confocal microscope. The proportion of the surface occupied by ECs was quantified as described in ESM.
2.12 Statistical analyses
For cell adhesion assay experiments, Student’st-test was used. For spheroid experiments, Student’st-test or one-way ANOVA and post-hoc Tukey test were used. Otherwise, Mann–
Whitney U test was used. All quantitative plots and charts in this paper were prepared using Mathematica.
3 Results
3.1 Modelling framework of cell wrapping
Because vascular morphogenesis is complex, we first examined whether cell wrapping can occur in simplifiedin vitro experimental systems. In 2D monolayer coculture of hPC-PL and HUVEC, we observed that some PCs transiently wrapped around ECs (figure 3a, movie S1 in ESM). Because cellular behaviour typically differs in a three-dimensional (3D) environment compared with that in on-dish 2D culture, we next investigated whether the wrapping phenomenon can also be observed in 3D culture. When we cultivated both cell types in type I collagen gel, we observed cell aggregates containing several ECs and PCs.
Notably, we observed some cell aggregates in which PCs surrounded ECs (figure 3b). While the morphogenetic process is not the same as the actual wrappingin vivo, these results confirmed that cell wrapping could occur even in simplified experimental systems with a small number of cells. Moreover, these processes occurred within a few hours, implying that the wrapping process principally relies on physical or mechanical properties, and does not involve transcriptional changes induced by cell–cell contact.
Given that the cell wrapping was observed in the in vitro experimental conditions, we modelled the simplified wrapping process as a 2D CPM which considered only a single PC and a single EC. In this model, we considered only two general properties of cells, size conservation and contact-dependent adhesion (figure 2c). We started by searching a set of parameters that reproduced the EC coverage by PCs (figure 4a, movie S2 in ESM). In this simulation, cell–cell adhesion was set stronger than cell–ECM adhesion. Moreover, the
PC surface was set to larger and softer than that of ECs. To characterize cell wrapping, we introduced the Coverage Index as the ratio of the PC–EC contact area to the total EC surface area (figure 4c). In 2D CPM, the perimeter was used for the index calculation. We noted that, despite the stochastic fluctuation, the index reached a plateau by around 200 MCS (figure 4b). In this study, we mainly focused on stabilized morphology. Hereafter, to examine the steady-state, the simulation results were analyzed at 2000 MCS with safety margin unless otherwise specified. Next, we sought to identify the putative mechanistic components contributing to PC coverage.
3.2 PC surface softness can contribute to the cell wrapping in CPM, but is not consistent with the AFM measurement
Because we incorporated the adhesion and size conservation terms, we first assessed the effect of PC surface elasticity and adhesive properties. In this model, we have two types of cell adhesion parameters: cell–cell and cell–surrounding environment (e.g., ECM) adhesion.
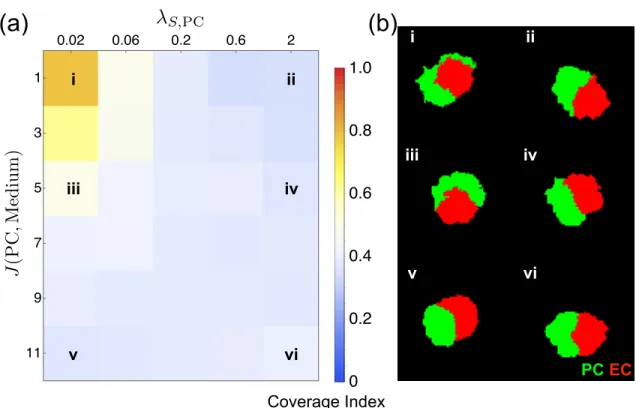
For simplicity, we neglected the size asymmetry between the two cell types. We evaluated the contributions of PC surface elasticity (λS,PC) and the adhesive strength between PCs and the external environment, in the case of in vivo or 3D in vitro, ECM components (J(PC,Medium)). When PC softness was combined with strong adhesion between PCs and ECM, we observed the PC coverage in the simulations (figure 5). In particular, when the PC surface was stiff enough, the PC–ECM adhesion had little effect on the wrapping (figure 5, ii, iv, and vi).
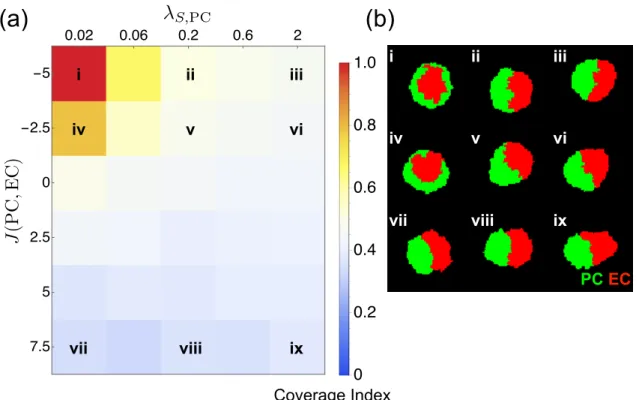
We assessed the effect of PC surface elasticity (λS,PC) and PC–EC adhesion (J(PC,EC)).
PC wrapping was only observed when low PC surface elasticity was combined with strong PC–EC adhesion (figure 6). In both cases, the inhibition of either mechanistic component independently had a negative impact on the cell wrapping (figures 5, 6).
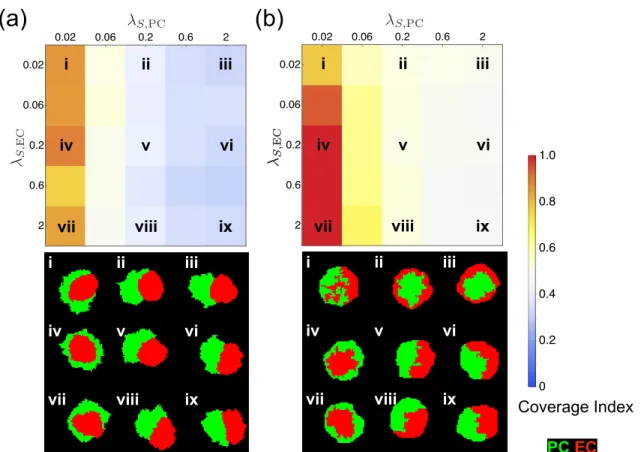
Next, we evaluated the effect of the relative elasticity difference between PCs and ECs in our modelling framework. We considered two mechanisms mentioned above, strong PC–EC interaction and preferential ECM adhesion of PCs. In the case of strong PC–EC
adhesion, the PC surface has to be softer than that of ECs for the cell wrapping (figure 7b). When both cells are equally very soft, the cell wrapping does not occur (figure 7b, i). However, when PCs have stronger ECM adhesion than ECs, PC surface softness itself plays an essential role in PC coverage, and EC elasticity appears to be much less critical (figure 7a).
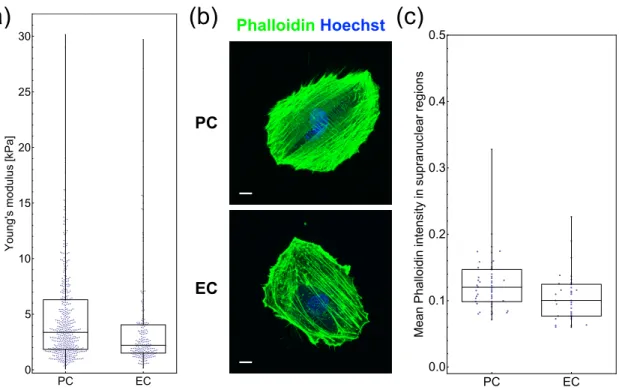
In the simulations, the surface softness enabled PCs to wrap around ECs, when combined with either strong PC–EC adhesion or preferential ECM adhesion of PCs. Moreover, each scenario regarding the adhesive properties requires different relative surface elasticity between PCs and ECs. Hence, we experimentally evaluated the cellular elasticity using AFM. Young’s modulus of the cells is known to vary widely and to be especially large in thin regions such as lamellipodia reflecting dish substrate [37]. Therefore, for consistency, the measurement was performed only in supranuclear regions. The measurement revealed that PCs have slightly (around 1.5-fold) larger Young’s modulus than ECs (figure 8a).
Despite the large variance, the statistically significant difference was also confirmed by another independent data set (figure S1 in ESM). According to the cellular tensegrity model, cellular elasticity is determined mainly by the balance of the cytoskeleton, including actin and microtubules [38]. This AFM measurement is also consistent with the experimental observation that PCs have a much more prominent actin cytoskeleton than ECs (figure 8b) and the F-actin intensity quantification in supranuclear regions (figure 8c). The measured elasticity also suggested the importance of preferential ECM adhesion of PCs for the cell wrapping.
3.3 PC preferential adhesion to ECM is a crucial factor for PC wrapping
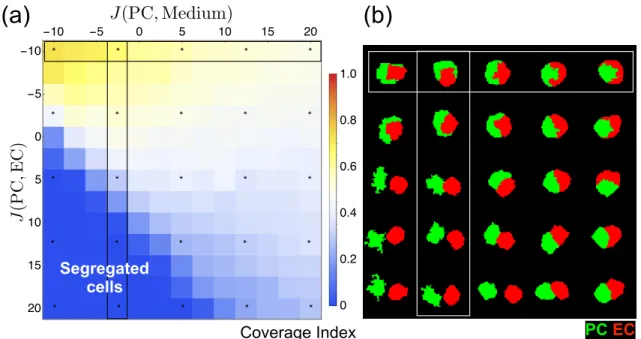
Next, we verified the relative contributions of cell–cell and cell–ECM adhesion under the measured cell elasticity ratio in CPM. When preferential ECM adhesion of PCs was combined with strong PC–EC adhesion, PCs covered ECs (figure 9). Here, strong PC–EC adhesion mainly served to keep two cells adhered (figure 9, vertical box). However, weak cell–cell adhesion was overcome by excessively strong PC–ECM adhesion, resulting in the segregated cell state (figure 9, dark blue region). In contrast, strong PC–ECM adhesion
largely determined the degree and direction of coverage (figure 9, horizontal box). In addition, the elasticity scale was predicted to play an important role in the cell wrapping in CPM (figure S2 in ESM). When increasing the surface elasticity of both cells while keeping the elasticity ratio as in figure 9, the degree of PC coverage was markedly diminished.
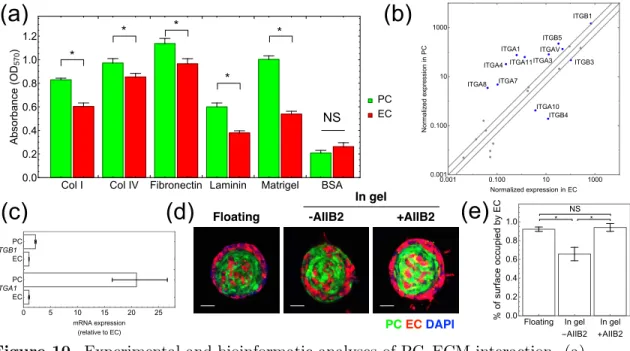
Because preferential ECM adhesion of PCs is predicted to be an important factor that can contribute to cell wrapping, we experimentally assessed this. First, we utilized a standard adhesion assay. In this assay, we performed spectrometry with the lysates of the stained cells attached to the ECM-coated plates. This measurement implied that the PCs have stronger affinity to various ECM components than ECs (figure 10a). However, owing to the technical limitations of the conventional method, we also surveyed this tendency using other approaches.
Next, we surveyed the Gene Expression Omnibus (GEO) repository to find gene expression datasets using HUVEC and hPC-PL. We employed two recently reported datasets: RNA-seq [31] and microarray [32]. Because members of the integrin family are well known to contribute significantly to cell–ECM adhesion, we surveyed the expression profiles of genes of this family. Among them, integrinα1 (ITGA1) was one of the integrin genes with the most consistently enriched expression in PCs compared with that in ECs (∼100-fold, figure 10b and figure S3e in ESM).
Note that other integrin genes with highly enriched expression in the RNA-seq data includingITGA4 and ITGA8 were not significantly upregulated in the microarray (figure S3e in ESM). In mice, the PC-specific loss of integrinβ1 was reported to cause an aberrant rounded PC morphology, with these PCs being located near blood vessels [11]. In our analysis, integrinβ1 (ITGB1) was very mildly enriched in RNA-seq (∼2-fold, figure 10b).
We also experimentally confirmed these tendencies by RT-qPCR (figure 10c).
Interestingly, among the PC-enriched Gene Ontology terms, extracellular matrix organi- zation (GO:0030198) had the highest rank in both datasets (figure S3c, f in ESM). The genes encoding ECM components, namely, collagen, laminin, and fibronectin, constituted the majority of the GO-associated genes and were mostly enriched in PCs than in ECs (figure S3b in ESM). Among downregulated genes, angiogenesis (GO:0001525) was ranked
in the top 3 in both datasets because of high enrichment in ECs (figure S3d, g in ESM).
These results implied that enhanced ECM production in PCs, besides integrin-mediated adhesion, may also contribute to the cell wrapping.
Finally, to verify the importance of ECM adhesion in PC–EC morphogenesis, we employed PC–EC coculture spheroids. Without substrate, ECs occupied the outermost layer as previously reported (figure 10d, e, [40]). However, under the existence of specific ECM substrate, spheroids were partially wrapped by PCs (figure S4a in ESM). Integrin β1 inhibition negated the ECM-induced effects on morphology (figure 10d, e). Note that these changes were not reproduced by RGD peptides (figure S4b in ESM), implying the involvement of RGD-independent integrins. We also found the parameter set in CPM simultaneously reproducing these changes and PC wrapping in cell doublets by changing J(PC,Medium) (figure S4c in ESM). Taken together, these results suggested that RGD-independent integrin-based preferential ECM adhesion of PCs regulated PC–EC morphogenesis.
3.4 Surface size asymmetry can facilitate cell wrapping
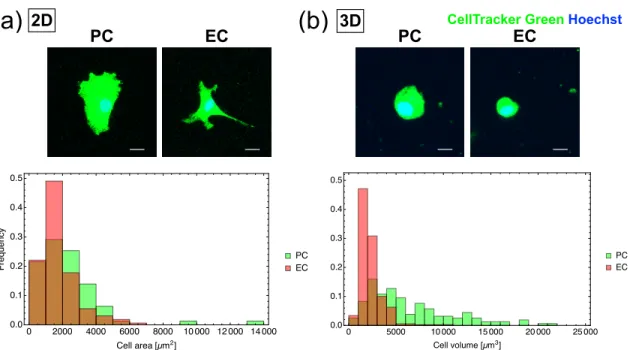
Thus far, we have not assumed any size asymmetry between the cell types. We thus next investigated the cell size difference in 2D and 3D environments in vitro. In 2D monolayer culture, the PC area was 1.3-fold greater than that of ECs (figure 11a). In the 3D environment, PCs also had 2.5-fold larger volume than ECs (figure 11b). Although the mechanism of cell size control, especially the difference among the cell types, remains poorly understood, these experimental observations suggested the existence of inherent size asymmetry between PCs and ECs.
Based on the experimental observations, we next investigated the effect of the difference in size on the cell wrapping. Based on the measured median cell volume in 3D (∼2.5-fold), we set the volume and surface size asymmetry as ∼1.8-fold and ∼1.4-fold because our CPM framework was 2D. When PCs were set larger than ECs in both volume and surface area, the degree of wrapping was enhanced (figure 12). The asymmetry in surface area in particular made a large contribution to this, while the volume difference contributed much
less (figure 12). These simulations predicted that the size asymmetry between cell types can contribute to the cell wrapping.
3.5 The corresponding mechanical model exhibits behaviour similar to CPM.
Finally, to gain theoretical insights, based on our stochastic and dynamic model, we formulated a simplified static mechanical model as the following minimization ofHtotal:
Htotal :=Hadhesion+Hvolume+Hsurface
=J0S0+J1S1+J2S2+λ1,V(V1−V1∗)2+λ2,V(V2−V2∗)2 +λ1(S0+S1−S1∗)2+λ2(S0+S2−S2∗)2.
Here, we considered two regions,D1 andD2, which represent the cytoplasm of EC and PC.
We set S0, S1, and S2 as the lengths of the boundary curves, shared by the two regions, only ofD1, and only ofD2, respectively. The areas of the domains were denoted asV1 and V2 (figure 13a).
We surveyed the effect of PC–EC and PC–ECM adhesivity in the mechanical model (figure 13b), corresponding to figure 9. As detailed in the appendix in ESM, the computation was performed based on (1) numerically obtaining the lower bound of the set of perimeters S0,S1, andS2given the areasV1andV2, and (2) introducing the perimeter scaling parameter ξ in the lattice-based CPM based on the neighbour order [39]. The surface elasticity was set as the ratio of PC:EC = 3:2 based on the AFM measurement. The CPM and the mechanical model were in good agreement in the Coverage Index (figure 13c, Pearson’s r= 0.95). We also note that the CPM simulation results are affected by the temperatureT, which corresponds to the degree of surface fluctuation (figure S5 in ESM). We setT = 10 for more realistic cellular morphology with membrane fluctuations, butT = 3 was optimal for the best agreement with the mechanical model (figure S6 in ESM). The detailed argument for this section is described in ESM.
4 Discussion
In this study, we explored the mechanism of PC coverage of ECs using a simple 2D CPM and in vitro experiments. We identified four putative mechanistic components. While cell–cell adhesion served to prevent the segregation of the cells, the oriented cell wrapping can be realized by the three other factors. Of these three factors, preferential ECM adhesion of PCs and cell size asymmetry were supported by experimental and bioinformatic analyses, while the measured surface elasticity difference was inconsistent with the theoretical predictions.
We also formulated the corresponding energy minimization problem for cell doublets, and numerically solved this problem for certain cases using the constructed algorithm. To the best of our knowledge, this is the first modelling study dealing with PC cellular morphology.
We also presented theoretical arguments for cell doublets with the consideration of surface size constraints.
We developed a highly simplified model based on the observed simplified wrapping. This approach would omit some histological features seen in vivo, including EC cord formation, lumenization, and basement membrane deposition. However, this simplification would hold the advantages in focusing on the putative mechanisms of interest, avoiding many implicit assumptions and unknown parameters, performing the theoretical analysis more feasibly, and extending the scope of the modelling to other cell wrapping phenomena.
On the other hand, it would be interesting to combine these coverage processes with the model of self-organization of ECs and/or PC migration along the blood vessels to mimic the actual situation more realistically and to understand the effect of PCs on EC dynamics.
Like many CPM studies, we assumed that the intracellular component was homogeneous.
However, this assumption might oversimplify the cells. For example, nuclei were reported to be 10 times stiffer than cytoplasm in some conditions [41]. PC–EC interface is also heterogeneous because of adhesion plaques, gap junctions, and peg–socket structure. It would also be interesting to research the contribution of such heterogeneity within the cells.
To our knowledge, this is the first study to explore the two cell dynamics with CPM and to understand the dynamics of the computational model with the analytical model. Although
several CPM studies focused on individual cell shapes with a small number of cells [42, 43], these studies mainly focused on the effect of 2D substrates on cellular morphology and motility. Other modelling approaches, including vertex models or phase-field models, have been employed to describe the dynamic cell shapes [44, 45]. In this study, to describe cell wrapping, we used CPM because of the flexible representation of cell shapes. Concerning the analytical aspects, the mechanical model of cell doublets was previously reported as a minimal model of inner cell mass formation in mouse early embryonic development [46]. In addition to the difference in the model dimensions, our modelling framework differs from their work in several aspects because we considered cell–ECM adhesion and the surface area conservation as an intrinsic feature of cells. We note that, because of the surface area constraints, the shape of the cell doublets giving the minimized energy is not limited to the bubble shape consisting of only arcs (spheres) or lines (planes). This reflects the variety of cellular shapes that we observedin vivo, especially that of cells embedded in ECM.
While multicellular cell sorting has been studied using CPM, the cell wrapping differs from it in several aspects. In cell doublets, cell elasticity appeared more critical (figure S7a–d in ESM). This would reflect the fact that cells need to deform greatly at the single-cell level for cell wrapping. Furthermore, in multicellular aggregation, one of the major contributors to cell sorting and tissue engulfment is homotypic cell adhesion (figure S7e, f in ESM, [21]).
However, this is not present in two-cell wrapping. PCs only sparsely distribute along the vessels and PC–PC adhesion can be physically negligible in vivo.
The actual molecular mechanism of the cell wrapping process and its link to the model remain to be elucidated. In our experiments, we focused on cell–ECM adhesion (J(PC/EC,Medium)) and cell surface elasticity (λS). Our investigation suggested that the molecular mechanism behind this includes the difference in integrin expression or ECM production for ECM adhesion, and the cytoskeletal architecture for elasticity. Cell–cell adhesion is indeed an important feature for cell wrapping, but this alone cannot explain the PC wrapping. N-cadherin-based cell–cell adhesion (J(PC,EC)) might support the cells adhering in the presence of strong PC–ECM adhesion [7, 8]. Cell size asymmetry (difference inS∗andV∗) was also explored in the experiments and the modelling. However, the control
of cell size remains poorly understood. The suggested mechanisms include protein titration against DNA for cell volume detection and the IGF/PI3K/AKT/mTORC1 pathway for cell growth [47, 48]. The origins of such variety between cell types are of interest for elucidating the contribution of the individual cell size control to morphogenesis.
Time-scale and time-course of wrapping phenomena also remain to be fully elucidated.
In this study, we focused on the stable morphology of PC wrapping because Monte Carlo method used in CPM has no direct link to physical time. However, by comparing the representative time-courses of the Coverage Index in the 2D experiment and the CPM, one MCS can be estimated in the order of minutes (∼0.71 min, figure S8 in ESM). This is consistent with the evaluation based on the 3D experiment because 200 MCS should be shorter than 4 hours if the coverage process was completed.
We compared the corresponding energy minimization problem with the CPM simulations.
We considered the perimeter scaling in the discretized CPM lattice based on the idea of Magno et al. [39] and the possible perimeter range for the cell doublets when given two areas.
Despite many complex CPMs having been proposed for various morphological processes, there has been limited theoretical study [39, 49]. Comparison of the CPM with the different classes of models in simple situations, especially analytically accessible ones, would be the first step towards understanding the mathematical nature of CPM.
Our approaches would benefit not only the understanding of vascular morphogenesis, but also that of the various types of cellular morphology. In this study, we regarded the PC coverage of ECs as cell wrapping, where one type of cell wraps around another type at the single-cell level. Other types of cell wrapping also occur in the body, including neurons (axons and Schwann cells/oligodendrocytes), olfactory epithelium (neurons and supporting cells), testis (spermatogenic and Sertoli cells), and cancer (cell-in-cell pattern, or entosis) [50].
Author Contributions
KS and TM designed the study. TM coordinated the study. KS performed the experiments, computational modelling, and data analysis. SS and SK performed the atomic force microscopy experiment and contributed to its interpretation. AU contributed to the immunohistochemistry experiments and the data interpretation. KS drafted the manuscript with help from TM; all authors critically revised the manuscript. All authors gave final approval for publication and agree to be held accountable for the work performed therein.
Acknowledgments
We appreciate the technical assistance from the Research Support Center, Research Center for Human Disease Modeling, Kyushu University Graduate School of Medical Sciences.
Data Accessibility
All relevant data supporting this article are within the manuscript or the electronic supple- mentary material.
Ethics
All animal experiments in this study were performed with the approval of the Institutional Animal Care and Use Committee at Kyushu University. ICR mice at postnatal day 5 (Japan SLC) were euthanized by decapitation.
Funding
This work was supported by CREST program of Japan Science and Technology Agency [JPMJCR14W4, to TM].
(c)
S EC
PC ECM
(a)
#*
EC PC
N-Cadherin N-Cadherin
PDGFRβ
PDGF-BB
Tie-2
Ang-1 Integrins Integrins
PDGFRβ IB4 Col-IV
PDGFRβ CD31
PDGFRβ CD31
* #
#
#
*
*
(b) (d)
BM
Figure 1. Structure and molecular interactions of PCs and ECs. (a) Schematic representation of the circumferential cross section of a PC-covered blood vessel. BM, basement membrane. (b, c) Confocal images of mouse retina at postnatal day 5.
Immunohistochemistry against PDGFRβ (PC, green), CD31 (EC, magenta) and type IV collagen (BM, white). Isolectin B4 (EC, magenta) and Hoechst 33342 (nuclei, blue). The white line ((c) left) corresponds to the orthogonal cross sections ((c) right). Arrows and *, PC; #, EC. Scale bars, 10µm (b), 5µm (c). (d) Schematic representation of major molecular interactions between PC and EC.
0 00 1
ΔH
Acceptanceprobabilityp
σ=1 σ=0
σ(a) σ(b) σ=2 σ=0
σ=1 σ=0
σ(a) σ(b) σ=2 σ=0
ΔH
Internal pressure Volume constraint
(a)
(c)
(b)
p =
( 1 ( H < 0)
e
TH( H 0)
<latexit sha1_base64="qjLFwNUS5mdUr8F7R85X/zSShm8=">AAACvHichVHLahRBFD1pX7GjZowbwU3jkJAsHG5HQQkqQV1kmddkAuk4dPfcGYvpl901A7HpH/AHXLhSEBG/wZUbf8BF1q7EuIrgxoV3elqCBvUWVXXq1D23TlV5SaAyTbQ/YZw4eer0mcmz5tS58xemaxdntrJ4kPrc9OMgTrc9N+NARdzUSge8naTshl7ALa9/f7TfGnKaqTja1HsJ74ZuL1Jd5btaqHatlVh3TMfjnopyX+pkhWnPzTsPONCutXKbFhzH5If5Naebun7+iy/yzaI4SnN6/NiiBdPhqFNVadfq1KAyrOPArkAdVazGtddw0EEMHwOEYETQggO4yKTtwAYhEW4XuXCpIFXuMwqYoh1IFkuGK2xfxp6sdio2kvWoZlaqfTklkJ6K0sIsfaQ3dEgf6C19ph9/rZWXNUZe9mT2xlpO2tNPL298/68qlFnj0ZHqn541urhVelXiPSmZ0S38sX745NnhxtL6bD5HL+mL+H9B+/RebhANv/mv1nj9OUz5APvP5z4OthYb9vXG4tqN+vK96ismcQVXMS/vfRPLWMEqmnLuO3zCAb4ad42O0TfCcaoxUWku4bcwhj8BkFypYw==</latexit>
J
<latexit sha1_base64="b2q7nP/OaXz+t6/B0k8eKMx10P8=">AAACdnichVHLSgMxFD0d3/XRqhtBkGKpupJbERRXohtx5atVUCkzY9ShmQczaX0Uf8AfcCEuFFTEz3DjD7jwE8RlBV248HY6ICrqDUlOTu65OUkMT1qBInqMaQ2NTc0trW3x9o7OrkSyuycfuCXfFDnTla6/ZuiBkJYjcspSUqx5vtBtQ4pVozhb218tCz+wXGdFHXhi09Z3HGvbMnXFVCHZPT+V2lBiX/l2JbB1KY8KyTSNUhipnyAbgTSiWHCT19jAFlyYKMGGgAPFWEJHwG0dWRA85jZRYc5nZIX7AkeIs7bEWYIzdGaLPO7waj1iHV7Xagah2uRTJHeflSlk6IFuqEr3dEtP9P5rrUpYo+blgGejrhVeIXHct/z6r8rmWWH3U/WnZ4VtTIZeLfbuhUztFmZdXz48qS5PLWUqQ3RBz+z/nB7pjm/glF/My0WxdIo4f0D2+3P/BPmx0SzjxfH09Ez0Fa3oxyBG+L0nMI05LCDH5+7hDFe4jr1pA1pGG66narFI04svodEHf+mRBg==</latexit><latexit sha1_base64="b2q7nP/OaXz+t6/B0k8eKMx10P8=">AAACdnichVHLSgMxFD0d3/XRqhtBkGKpupJbERRXohtx5atVUCkzY9ShmQczaX0Uf8AfcCEuFFTEz3DjD7jwE8RlBV248HY6ICrqDUlOTu65OUkMT1qBInqMaQ2NTc0trW3x9o7OrkSyuycfuCXfFDnTla6/ZuiBkJYjcspSUqx5vtBtQ4pVozhb218tCz+wXGdFHXhi09Z3HGvbMnXFVCHZPT+V2lBiX/l2JbB1KY8KyTSNUhipnyAbgTSiWHCT19jAFlyYKMGGgAPFWEJHwG0dWRA85jZRYc5nZIX7AkeIs7bEWYIzdGaLPO7waj1iHV7Xagah2uRTJHeflSlk6IFuqEr3dEtP9P5rrUpYo+blgGejrhVeIXHct/z6r8rmWWH3U/WnZ4VtTIZeLfbuhUztFmZdXz48qS5PLWUqQ3RBz+z/nB7pjm/glF/My0WxdIo4f0D2+3P/BPmx0SzjxfH09Ez0Fa3oxyBG+L0nMI05LCDH5+7hDFe4jr1pA1pGG66narFI04svodEHf+mRBg==</latexit><latexit sha1_base64="b2q7nP/OaXz+t6/B0k8eKMx10P8=">AAACdnichVHLSgMxFD0d3/XRqhtBkGKpupJbERRXohtx5atVUCkzY9ShmQczaX0Uf8AfcCEuFFTEz3DjD7jwE8RlBV248HY6ICrqDUlOTu65OUkMT1qBInqMaQ2NTc0trW3x9o7OrkSyuycfuCXfFDnTla6/ZuiBkJYjcspSUqx5vtBtQ4pVozhb218tCz+wXGdFHXhi09Z3HGvbMnXFVCHZPT+V2lBiX/l2JbB1KY8KyTSNUhipnyAbgTSiWHCT19jAFlyYKMGGgAPFWEJHwG0dWRA85jZRYc5nZIX7AkeIs7bEWYIzdGaLPO7waj1iHV7Xagah2uRTJHeflSlk6IFuqEr3dEtP9P5rrUpYo+blgGejrhVeIXHct/z6r8rmWWH3U/WnZ4VtTIZeLfbuhUztFmZdXz48qS5PLWUqQ3RBz+z/nB7pjm/glF/My0WxdIo4f0D2+3P/BPmx0SzjxfH09Ez0Fa3oxyBG+L0nMI05LCDH5+7hDFe4jr1pA1pGG66narFI04svodEHf+mRBg==</latexit><latexit sha1_base64="b2q7nP/OaXz+t6/B0k8eKMx10P8=">AAACdnichVHLSgMxFD0d3/XRqhtBkGKpupJbERRXohtx5atVUCkzY9ShmQczaX0Uf8AfcCEuFFTEz3DjD7jwE8RlBV248HY6ICrqDUlOTu65OUkMT1qBInqMaQ2NTc0trW3x9o7OrkSyuycfuCXfFDnTla6/ZuiBkJYjcspSUqx5vtBtQ4pVozhb218tCz+wXGdFHXhi09Z3HGvbMnXFVCHZPT+V2lBiX/l2JbB1KY8KyTSNUhipnyAbgTSiWHCT19jAFlyYKMGGgAPFWEJHwG0dWRA85jZRYc5nZIX7AkeIs7bEWYIzdGaLPO7waj1iHV7Xagah2uRTJHeflSlk6IFuqEr3dEtP9P5rrUpYo+blgGejrhVeIXHct/z6r8rmWWH3U/WnZ4VtTIZeLfbuhUztFmZdXz48qS5PLWUqQ3RBz+z/nB7pjm/glF/My0WxdIo4f0D2+3P/BPmx0SzjxfH09Ez0Fa3oxyBG+L0nMI05LCDH5+7hDFe4jr1pA1pGG66narFI04svodEHf+mRBg==</latexit>: small J
<latexit sha1_base64="9VSOVoU0M0eZWBJX9BYsECZ1x4c=">AAACdnichVG7SgNBFD1Z3/GRRBtBkGCIWsmNCEqqoI1YaWJUUAm76xiX7IvdSXwEf8AfsBALBRXxM2z8AQs/QSwVtLDwZrMgKuodZubMmXvunJnRXNPwJdFDRGlpbWvv6OyKdvf09sXiif4V36l6uijqjul4a5rqC9OwRVEa0hRrridUSzPFqlaZa+yv1oTnG469LPddsWmpZdvYNnRVMlWKJxayyQ0p9qRn1U3VK4vDUjxFExRE8ifIhCCFMBad+BU2sAUHOqqwIGBDMjahwue2jgwILnObqDPnMTKCfYFDRFlb5SzBGSqzFR7LvFoPWZvXjZp+oNb5FJO7x8ok0nRP1/RMd3RDj/T+a616UKPhZZ9nrakVbil2NFh4/Vdl8Syx86n607PENmYCrwZ7dwOmcQu9qa8dHD8Xsvl0fZTO6Yn9n9ED3fIN7NqLfrEk8ieI8gdkvj/3T7AyOZFhvDSVys2GX9GJIYxgnN97GjnMYxFFPncXp7jEVeRNGVbSylgzVYmEmgF8CYU+AGO4kPg=</latexit><latexit sha1_base64="9VSOVoU0M0eZWBJX9BYsECZ1x4c=">AAACdnichVG7SgNBFD1Z3/GRRBtBkGCIWsmNCEqqoI1YaWJUUAm76xiX7IvdSXwEf8AfsBALBRXxM2z8AQs/QSwVtLDwZrMgKuodZubMmXvunJnRXNPwJdFDRGlpbWvv6OyKdvf09sXiif4V36l6uijqjul4a5rqC9OwRVEa0hRrridUSzPFqlaZa+yv1oTnG469LPddsWmpZdvYNnRVMlWKJxayyQ0p9qRn1U3VK4vDUjxFExRE8ifIhCCFMBad+BU2sAUHOqqwIGBDMjahwue2jgwILnObqDPnMTKCfYFDRFlb5SzBGSqzFR7LvFoPWZvXjZp+oNb5FJO7x8ok0nRP1/RMd3RDj/T+a616UKPhZZ9nrakVbil2NFh4/Vdl8Syx86n607PENmYCrwZ7dwOmcQu9qa8dHD8Xsvl0fZTO6Yn9n9ED3fIN7NqLfrEk8ieI8gdkvj/3T7AyOZFhvDSVys2GX9GJIYxgnN97GjnMYxFFPncXp7jEVeRNGVbSylgzVYmEmgF8CYU+AGO4kPg=</latexit><latexit sha1_base64="9VSOVoU0M0eZWBJX9BYsECZ1x4c=">AAACdnichVG7SgNBFD1Z3/GRRBtBkGCIWsmNCEqqoI1YaWJUUAm76xiX7IvdSXwEf8AfsBALBRXxM2z8AQs/QSwVtLDwZrMgKuodZubMmXvunJnRXNPwJdFDRGlpbWvv6OyKdvf09sXiif4V36l6uijqjul4a5rqC9OwRVEa0hRrridUSzPFqlaZa+yv1oTnG469LPddsWmpZdvYNnRVMlWKJxayyQ0p9qRn1U3VK4vDUjxFExRE8ifIhCCFMBad+BU2sAUHOqqwIGBDMjahwue2jgwILnObqDPnMTKCfYFDRFlb5SzBGSqzFR7LvFoPWZvXjZp+oNb5FJO7x8ok0nRP1/RMd3RDj/T+a616UKPhZZ9nrakVbil2NFh4/Vdl8Syx86n607PENmYCrwZ7dwOmcQu9qa8dHD8Xsvl0fZTO6Yn9n9ED3fIN7NqLfrEk8ieI8gdkvj/3T7AyOZFhvDSVys2GX9GJIYxgnN97GjnMYxFFPncXp7jEVeRNGVbSylgzVYmEmgF8CYU+AGO4kPg=</latexit><latexit sha1_base64="9VSOVoU0M0eZWBJX9BYsECZ1x4c=">AAACdnichVG7SgNBFD1Z3/GRRBtBkGCIWsmNCEqqoI1YaWJUUAm76xiX7IvdSXwEf8AfsBALBRXxM2z8AQs/QSwVtLDwZrMgKuodZubMmXvunJnRXNPwJdFDRGlpbWvv6OyKdvf09sXiif4V36l6uijqjul4a5rqC9OwRVEa0hRrridUSzPFqlaZa+yv1oTnG469LPddsWmpZdvYNnRVMlWKJxayyQ0p9qRn1U3VK4vDUjxFExRE8ifIhCCFMBad+BU2sAUHOqqwIGBDMjahwue2jgwILnObqDPnMTKCfYFDRFlb5SzBGSqzFR7LvFoPWZvXjZp+oNb5FJO7x8ok0nRP1/RMd3RDj/T+a616UKPhZZ9nrakVbil2NFh4/Vdl8Syx86n607PENmYCrwZ7dwOmcQu9qa8dHD8Xsvl0fZTO6Yn9n9ED3fIN7NqLfrEk8ieI8gdkvj/3T7AyOZFhvDSVys2GX9GJIYxgnN97GjnMYxFFPncXp7jEVeRNGVbSylgzVYmEmgF8CYU+AGO4kPg=</latexit>: large
Adhesion
Contact energy (cell-cell or cell-ECM)
Strong Weak Surface stiffness / elasticity
Surface constraint
V
<latexit sha1_base64="vZb9QXtaCfPz8OQSTkDNCP+YI1k=">AAACZnichVHLSsNAFD2Nr1ofrYoouCmWirgoExEUV0U3LvuwD6i1JHFaQ9MkJGmhFn9AcGsXrhRExM9w4w+46B8oLiu4ceFtGhAt6h1m5syZe+6cmZFNTbUdxjo+YWh4ZHTMPx6YmJyaDoZmZrO2UbcUnlEMzbDysmRzTdV5xlEdjedNi0s1WeM5ubrb2881uGWrhr7vNE1erEkVXS2riuQQlc4erpVCERZjboQHgeiBCLxIGKFbHOAIBhTUUQOHDoewBgk2tQJEMJjEFdEiziKkuvscpwiQtk5ZnDIkYqs0VmhV8Fid1r2atqtW6BSNukXKMKLsid2xLntk9+yFffxaq+XW6Hlp0iz3tdwsBc8W0+//qmo0Ozj+Uv3p2UEZW65XlbybLtO7hdLXN07a3fR2KtpaYdfslfxfsQ57oBvojTflJslTlwjQB4g/n3sQZNdjIuHkRiS+432FH0tYxiq99ybi2EMCGTq3gnNcoO17FqaFeWGhnyr4PM0cvoUQ/gQOOIpy</latexit><latexit sha1_base64="vZb9QXtaCfPz8OQSTkDNCP+YI1k=">AAACZnichVHLSsNAFD2Nr1ofrYoouCmWirgoExEUV0U3LvuwD6i1JHFaQ9MkJGmhFn9AcGsXrhRExM9w4w+46B8oLiu4ceFtGhAt6h1m5syZe+6cmZFNTbUdxjo+YWh4ZHTMPx6YmJyaDoZmZrO2UbcUnlEMzbDysmRzTdV5xlEdjedNi0s1WeM5ubrb2881uGWrhr7vNE1erEkVXS2riuQQlc4erpVCERZjboQHgeiBCLxIGKFbHOAIBhTUUQOHDoewBgk2tQJEMJjEFdEiziKkuvscpwiQtk5ZnDIkYqs0VmhV8Fid1r2atqtW6BSNukXKMKLsid2xLntk9+yFffxaq+XW6Hlp0iz3tdwsBc8W0+//qmo0Ozj+Uv3p2UEZW65XlbybLtO7hdLXN07a3fR2KtpaYdfslfxfsQ57oBvojTflJslTlwjQB4g/n3sQZNdjIuHkRiS+432FH0tYxiq99ybi2EMCGTq3gnNcoO17FqaFeWGhnyr4PM0cvoUQ/gQOOIpy</latexit><latexit sha1_base64="vZb9QXtaCfPz8OQSTkDNCP+YI1k=">AAACZnichVHLSsNAFD2Nr1ofrYoouCmWirgoExEUV0U3LvuwD6i1JHFaQ9MkJGmhFn9AcGsXrhRExM9w4w+46B8oLiu4ceFtGhAt6h1m5syZe+6cmZFNTbUdxjo+YWh4ZHTMPx6YmJyaDoZmZrO2UbcUnlEMzbDysmRzTdV5xlEdjedNi0s1WeM5ubrb2881uGWrhr7vNE1erEkVXS2riuQQlc4erpVCERZjboQHgeiBCLxIGKFbHOAIBhTUUQOHDoewBgk2tQJEMJjEFdEiziKkuvscpwiQtk5ZnDIkYqs0VmhV8Fid1r2atqtW6BSNukXKMKLsid2xLntk9+yFffxaq+XW6Hlp0iz3tdwsBc8W0+//qmo0Ozj+Uv3p2UEZW65XlbybLtO7hdLXN07a3fR2KtpaYdfslfxfsQ57oBvojTflJslTlwjQB4g/n3sQZNdjIuHkRiS+432FH0tYxiq99ybi2EMCGTq3gnNcoO17FqaFeWGhnyr4PM0cvoUQ/gQOOIpy</latexit><latexit sha1_base64="vZb9QXtaCfPz8OQSTkDNCP+YI1k=">AAACZnichVHLSsNAFD2Nr1ofrYoouCmWirgoExEUV0U3LvuwD6i1JHFaQ9MkJGmhFn9AcGsXrhRExM9w4w+46B8oLiu4ceFtGhAt6h1m5syZe+6cmZFNTbUdxjo+YWh4ZHTMPx6YmJyaDoZmZrO2UbcUnlEMzbDysmRzTdV5xlEdjedNi0s1WeM5ubrb2881uGWrhr7vNE1erEkVXS2riuQQlc4erpVCERZjboQHgeiBCLxIGKFbHOAIBhTUUQOHDoewBgk2tQJEMJjEFdEiziKkuvscpwiQtk5ZnDIkYqs0VmhV8Fid1r2atqtW6BSNukXKMKLsid2xLntk9+yFffxaq+XW6Hlp0iz3tdwsBc8W0+//qmo0Ozj+Uv3p2UEZW65XlbybLtO7hdLXN07a3fR2KtpaYdfslfxfsQ57oBvojTflJslTlwjQB4g/n3sQZNdjIuHkRiS+432FH0tYxiq99ybi2EMCGTq3gnNcoO17FqaFeWGhnyr4PM0cvoUQ/gQOOIpy</latexit> ⇤V
<latexit sha1_base64="KX+40e7zkqsd/T4MQzTyji+kuxI=">AAACbXichVHLSgMxFD0d3/XRqgiCIsVSdVVSFRRXohuXvvrAWsrMmNbQdGaYmRa0+AOuBReioCAifoYbf8CFnyAuXCi4ceGd6YCoqDckOTm55+Yk0SwpHJexh5DS0trW3tHZFe7u6e2LRPsHMo5Zs3We1k1p2jlNdbgUBk+7wpU8Z9lcrWqSZ7XKsrefrXPbEaax6e5ZvFBVy4YoCV11idralpS6oxYz4WI0zpLMj9hPkApAHEGsmtErbGMHJnTUUAWHAZewhAqHWh4pMFjEFdAgziYk/H2OA4RJW6MsThkqsRUay7TKB6xBa6+m46t1OkVSt0kZQ4Lds2v2wu7YDXtk77/Wavg1PC97NGtNLbeKkcPhjbd/VVWaXex+qv707KKEed+rIO+Wz3i30Jv6+v7xy8bCeqIxwS7YE/k/Zw/slm5g1F/1yzW+fgLvA1Lfn/snyEwnUzPJ6bXZ+OJS8BWdGME4pui957CIFawiTecaOMIpzkLPypAyqow1U5VQoBnEl1AmPwBiPI1a</latexit>
S⇤
<latexit sha1_base64="GcNwiME4lkOuYKVbsni7If6ZYaE=">AAACZnichVHLSsNAFD2Nr1ofrYoouCmWirgoExEUV0U3LvuwD6i1JHFaQ9MkJGmhFn9AcGsXrhRExM9w4w+46B8oLiu4ceFtGhAt6h1m5syZe+6cmZFNTbUdxjo+YWh4ZHTMPx6YmJyaDoZmZrO2UbcUnlEMzbDysmRzTdV5xlEdjedNi0s1WeM5ubrb2881uGWrhr7vNE1erEkVXS2riuQQlU4frpVCERZjboQHgeiBCLxIGKFbHOAIBhTUUQOHDoewBgk2tQJEMJjEFdEiziKkuvscpwiQtk5ZnDIkYqs0VmhV8Fid1r2atqtW6BSNukXKMKLsid2xLntk9+yFffxaq+XW6Hlp0iz3tdwsBc8W0+//qmo0Ozj+Uv3p2UEZW65XlbybLtO7hdLXN07a3fR2KtpaYdfslfxfsQ57oBvojTflJslTlwjQB4g/n3sQZNdjIuHkRiS+432FH0tYxiq99ybi2EMCGTq3gnNcoO17FqaFeWGhnyr4PM0cvoUQ/gQIMopv</latexit><latexit sha1_base64="GcNwiME4lkOuYKVbsni7If6ZYaE=">AAACZnichVHLSsNAFD2Nr1ofrYoouCmWirgoExEUV0U3LvuwD6i1JHFaQ9MkJGmhFn9AcGsXrhRExM9w4w+46B8oLiu4ceFtGhAt6h1m5syZe+6cmZFNTbUdxjo+YWh4ZHTMPx6YmJyaDoZmZrO2UbcUnlEMzbDysmRzTdV5xlEdjedNi0s1WeM5ubrb2881uGWrhr7vNE1erEkVXS2riuQQlU4frpVCERZjboQHgeiBCLxIGKFbHOAIBhTUUQOHDoewBgk2tQJEMJjEFdEiziKkuvscpwiQtk5ZnDIkYqs0VmhV8Fid1r2atqtW6BSNukXKMKLsid2xLntk9+yFffxaq+XW6Hlp0iz3tdwsBc8W0+//qmo0Ozj+Uv3p2UEZW65XlbybLtO7hdLXN07a3fR2KtpaYdfslfxfsQ57oBvojTflJslTlwjQB4g/n3sQZNdjIuHkRiS+432FH0tYxiq99ybi2EMCGTq3gnNcoO17FqaFeWGhnyr4PM0cvoUQ/gQIMopv</latexit><latexit sha1_base64="GcNwiME4lkOuYKVbsni7If6ZYaE=">AAACZnichVHLSsNAFD2Nr1ofrYoouCmWirgoExEUV0U3LvuwD6i1JHFaQ9MkJGmhFn9AcGsXrhRExM9w4w+46B8oLiu4ceFtGhAt6h1m5syZe+6cmZFNTbUdxjo+YWh4ZHTMPx6YmJyaDoZmZrO2UbcUnlEMzbDysmRzTdV5xlEdjedNi0s1WeM5ubrb2881uGWrhr7vNE1erEkVXS2riuQQlU4frpVCERZjboQHgeiBCLxIGKFbHOAIBhTUUQOHDoewBgk2tQJEMJjEFdEiziKkuvscpwiQtk5ZnDIkYqs0VmhV8Fid1r2atqtW6BSNukXKMKLsid2xLntk9+yFffxaq+XW6Hlp0iz3tdwsBc8W0+//qmo0Ozj+Uv3p2UEZW65XlbybLtO7hdLXN07a3fR2KtpaYdfslfxfsQ57oBvojTflJslTlwjQB4g/n3sQZNdjIuHkRiS+432FH0tYxiq99ybi2EMCGTq3gnNcoO17FqaFeWGhnyr4PM0cvoUQ/gQIMopv</latexit><latexit sha1_base64="GcNwiME4lkOuYKVbsni7If6ZYaE=">AAACZnichVHLSsNAFD2Nr1ofrYoouCmWirgoExEUV0U3LvuwD6i1JHFaQ9MkJGmhFn9AcGsXrhRExM9w4w+46B8oLiu4ceFtGhAt6h1m5syZe+6cmZFNTbUdxjo+YWh4ZHTMPx6YmJyaDoZmZrO2UbcUnlEMzbDysmRzTdV5xlEdjedNi0s1WeM5ubrb2881uGWrhr7vNE1erEkVXS2riuQQlU4frpVCERZjboQHgeiBCLxIGKFbHOAIBhTUUQOHDoewBgk2tQJEMJjEFdEiziKkuvscpwiQtk5ZnDIkYqs0VmhV8Fid1r2atqtW6BSNukXKMKLsid2xLntk9+yFffxaq+XW6Hlp0iz3tdwsBc8W0+//qmo0Ozj+Uv3p2UEZW65XlbybLtO7hdLXN07a3fR2KtpaYdfslfxfsQ57oBvojTflJslTlwjQB4g/n3sQZNdjIuHkRiS+432FH0tYxiq99ybi2EMCGTq3gnNcoO17FqaFeWGhnyr4PM0cvoUQ/gQIMopv</latexit>
Soft Stiff
S : small
<latexit sha1_base64="Eay+QqgLCNOftgh4hDwPn1s8XKs=">AAACfnichVHLSgMxFD0d3/VVdaO4KRaLG2uqguKq6MaltlYLrZTMGHUw82AmLWgR9/6AC1cKRUTQj3DjD7jwE8SlghsX3k4HRIt6Q5KTk3tuThLdlaavGHuKaG3tHZ1d3T3R3r7+gcHY0PCm71Q8Q+QNRzpeQee+kKYt8spUUhRcT3BLl2JLP1hp7G9Vheebjr2hDl2xbfE929w1Da6IKsfGSpKSd3g5txQvWVzte1bNt7iUx+VYgqVYEPFWkA5BAmGsObErlLADBwYqsCBgQxGW4PCpFZEGg0vcNmrEeYTMYF/gGFHSVihLUAYn9oDGPVoVQ9amdaOmH6gNOkVS90gZxyR7ZNfslT2wG/bMPn6tVQtqNLwc0qw3tcItD56O5t7/VVk0K+x/qf70rLCLxcCrSd7dgGncwmjqq0dnr7ml7GQtyS7ZC/m/YE/snm5gV9+M+rrIniNKH5D++dytYHM2lZ5Lza7PJzLL4Vd0YxwTmKL3XkAGq1hDns49QR23uNOgJbVpbaaZqkVCzQi+hbb4CdtCk2U=</latexit> S : large<latexit sha1_base64="+K9FGIFnmQwKjgX/Knm9vydccqA=">AAACfnichVHNLkNBGD2uv6q/YkNsGg2xUVMkGithY9mqIlFp5l6jvTH3J/dOm9CIvRewsCIREQkPYeMFLPoIYlmJjYWvtzcRBN9kZs6c+c43Z2Z0V5q+YqzeprV3dHZ1R3qivX39A4OxoeFN36l4hsgbjnS8bZ37Qpq2yCtTSbHteoJbuhRb+sFqc3+rKjzfdOwNdeiKXYuXbHPfNLgiqhgbK0hK3uPF3FK8YHFV9qya5F5JHBdjCZZkQcR/glQIEggj48SuUcAeHBiowIKADUVYgsOntoMUGFzidlEjziNkBvsCx4iStkJZgjI4sQc0lmi1E7I2rZs1/UBt0CmSukfKOCbZE7thDfbIbtkze/+1Vi2o0fRySLPe0gq3OHg6mnv7V2XRrFD+VP3pWWEf6cCrSd7dgGnewmjpq0dnjdzS+mRtil2yF/J/wersgW5gV1+Nq6xYP0eUPiD1/bl/gs25ZGo+OZddSCyvhF8RwTgmME3vvYhlrCGDPJ17givc4V6DNqXNaLOtVK0t1IzgS2jpD78Rk1c=</latexit>
Figure 2. Schematic representation of the CPM. (a) Schematic lattice image. Colours represent cell typesσ. σ= 1 in the green cell region andσ = 2 in the red cell region. The ECM region (σ= 0) is shown in black. ∆H, the energy change upon the transition from σ(a) toσ(b). (b) The relationship between ∆H and the acceptance probability p. (c) Definitions of the energy terms and the model parameters. λV and λS represents volume and surface elasticity of the cells. V∗ and S∗ represent target volume and surface area of the cells, respectively. J represents the adhesivity between cell types.
CellTracker Green UEA-1
(a)
CellTracker Green Red Hoechst
x-y x-y
x-z x-z
(b)
Figure 3. PCs can wrap around ECsin vitro in 2D and 3D. (a) Time lapse images of 2D monolayer coculture of PCs and ECs. Green, CellTracker Green (PC); red,
Rhodamine-UEA-I lectin (EC). Scale bars, 50µm. (b) Confocal images of 3D coculture in type I collagen. Green, CellTracker Green (PC); red, CellTracker Red (EC); blue, Hoechst 33342. Scale bars, 5 µm. x-y and x-z represent single z slice images and reconstructed orthogonal cross-sectional images along white lines in x-y, respectively.
0 MCS 20 MCS 100 MCS 300 MCS 1000 MCS 2000 MCS
PC EC
EC PC
0 500 1000 1500 2000
0.0 0.2 0.4 0.6 0.8 1.0
MCS
CoverageIndex
(a)
(c) (b)
Coverage Index (for EC)
=contact area between PC and EC total EC surface area
<latexit sha1_base64="oFiO6+u1Wwhxui9Sj4FIiOPNyvs=">AAADIHichVHLbtNAFL02r2IeDbBBYmNIi8ommoQFCAmpIkLALmlJWylTRePJTWp1PLbGk0Cw/AP8AAtWVEII8Qks2XSHWLAof4BYFokNC66dQAUVcC17zpy55/jMTJCoMLWM7TnukaPHjp+YO+mdOn3m7Hzl3Pm1NB4ZiR0Zq9hsBCJFFWrs2NAq3EgMiihQuB5sN4v19TGaNIz1QztJcDMSQx0OQiksUb3KWx7gMNSZFcFICZNnKvcWeCTslomyZkxSMUTuP9B9fMz9pUFsuH+3eS1f4LzLanWMNqm9H6aJEpPUThT6t/nACJl5P01krK2QlvuCcnE/QPsIUXO/1SRK9wu73MsP+m1shSpY7qcjMxASp9Kcgnkcdf9X1l6lymqsLP8wqM9AFWbViiuvgEMfYpAwgggQNFjCCgSk9HShDgwS4jYhI84QCst1hBw80o6oC6lDELtN3yHNujNW07zwTEu1pL8oeg0pfVhkH9lrts922Rv2mX3/q1dWehRZJjQGUy0mvfmnF1e//VcV0Whh60D1z8wWBnCzzBpS9qRkil3IqX785Nn+6q2Vxewq22FfKP8Ltsfe0Q70+Kt82caV5+DRBdT/PO7DYK1Rq1+vNdqN6vKd2VXMwSW4Akt03jdgGe5DCzogncvOPafltN0dd9d9736YtrrOTHMBfiv30w+Kn8+j</latexit>
Figure 4. An example simulation reproducing PC coverage. (a) Snapshots from the successful simulation reproducing PC coverage. MCS, Monte Carlo step. (b) Time course of the Coverage Index in the simulation (a). (c) The definition of the Coverage Index.
�
�
�
�
�
��
���� ���� ��� ��� �
�
���
���
���
���
���
Coverage Index i
v
ii
iii iv
vi
i ii
iii
v vi
iv
PC EC S,PC
<latexit sha1_base64="R0aKR4UzIFe4PiYbx0I7ljOFasY=">AAACfHichVHLSiNBFD1pXzGjJqMLB9zIREVQw+1BVFyJblxGM1HBSOhuK0mTftFdCcQmPzA/MAtXKiKDM1/hxh9w4SfILB2YzTB402kQFfUWVXXq1D23TlXpnmUGkug2ofT09vUPJAdTH4aGR9KZj6M7gdvwDVE0XMv193QtEJbpiKI0pSX2PF9otm6JXb2+0dnfbQo/MF3nq2x54sDWqo5ZMQ1NMlXOjJcsTj7UymFhvmRrsubbYX6j3S5nspSjKCZfAjUGWcSRdzMXKOEQLgw0YEPAgWRsQUPAbR8qCB5zBwiZ8xmZ0b5AGynWNjhLcIbGbJ3HKq/2Y9bhdadmEKkNPsXi7rNyEtN0Qz/onq7pku7o36u1wqhGx0uLZ72rFV45/e1T4e+7Kptnidqj6k3PEhWsRF5N9u5FTOcWRlffPPp+X1jdng5n6JR+s/8TuqUrvoHT/GOcb4ntY6T4A9Tnz/0S7HzJqZRTtxaza+vxVyQxgc+Y5fdexho2kUcxOvcMP/Er8V+ZUuaUhW6qkog1Y3gSytIDLrGTkA==</latexit><latexit sha1_base64="R0aKR4UzIFe4PiYbx0I7ljOFasY=">AAACfHichVHLSiNBFD1pXzGjJqMLB9zIREVQw+1BVFyJblxGM1HBSOhuK0mTftFdCcQmPzA/MAtXKiKDM1/hxh9w4SfILB2YzTB402kQFfUWVXXq1D23TlXpnmUGkug2ofT09vUPJAdTH4aGR9KZj6M7gdvwDVE0XMv193QtEJbpiKI0pSX2PF9otm6JXb2+0dnfbQo/MF3nq2x54sDWqo5ZMQ1NMlXOjJcsTj7UymFhvmRrsubbYX6j3S5nspSjKCZfAjUGWcSRdzMXKOEQLgw0YEPAgWRsQUPAbR8qCB5zBwiZ8xmZ0b5AGynWNjhLcIbGbJ3HKq/2Y9bhdadmEKkNPsXi7rNyEtN0Qz/onq7pku7o36u1wqhGx0uLZ72rFV45/e1T4e+7Kptnidqj6k3PEhWsRF5N9u5FTOcWRlffPPp+X1jdng5n6JR+s/8TuqUrvoHT/GOcb4ntY6T4A9Tnz/0S7HzJqZRTtxaza+vxVyQxgc+Y5fdexho2kUcxOvcMP/Er8V+ZUuaUhW6qkog1Y3gSytIDLrGTkA==</latexit><latexit sha1_base64="R0aKR4UzIFe4PiYbx0I7ljOFasY=">AAACfHichVHLSiNBFD1pXzGjJqMLB9zIREVQw+1BVFyJblxGM1HBSOhuK0mTftFdCcQmPzA/MAtXKiKDM1/hxh9w4SfILB2YzTB402kQFfUWVXXq1D23TlXpnmUGkug2ofT09vUPJAdTH4aGR9KZj6M7gdvwDVE0XMv193QtEJbpiKI0pSX2PF9otm6JXb2+0dnfbQo/MF3nq2x54sDWqo5ZMQ1NMlXOjJcsTj7UymFhvmRrsubbYX6j3S5nspSjKCZfAjUGWcSRdzMXKOEQLgw0YEPAgWRsQUPAbR8qCB5zBwiZ8xmZ0b5AGynWNjhLcIbGbJ3HKq/2Y9bhdadmEKkNPsXi7rNyEtN0Qz/onq7pku7o36u1wqhGx0uLZ72rFV45/e1T4e+7Kptnidqj6k3PEhWsRF5N9u5FTOcWRlffPPp+X1jdng5n6JR+s/8TuqUrvoHT/GOcb4ntY6T4A9Tnz/0S7HzJqZRTtxaza+vxVyQxgc+Y5fdexho2kUcxOvcMP/Er8V+ZUuaUhW6qkog1Y3gSytIDLrGTkA==</latexit><latexit sha1_base64="R0aKR4UzIFe4PiYbx0I7ljOFasY=">AAACfHichVHLSiNBFD1pXzGjJqMLB9zIREVQw+1BVFyJblxGM1HBSOhuK0mTftFdCcQmPzA/MAtXKiKDM1/hxh9w4SfILB2YzTB402kQFfUWVXXq1D23TlXpnmUGkug2ofT09vUPJAdTH4aGR9KZj6M7gdvwDVE0XMv193QtEJbpiKI0pSX2PF9otm6JXb2+0dnfbQo/MF3nq2x54sDWqo5ZMQ1NMlXOjJcsTj7UymFhvmRrsubbYX6j3S5nspSjKCZfAjUGWcSRdzMXKOEQLgw0YEPAgWRsQUPAbR8qCB5zBwiZ8xmZ0b5AGynWNjhLcIbGbJ3HKq/2Y9bhdadmEKkNPsXi7rNyEtN0Qz/onq7pku7o36u1wqhGx0uLZ72rFV45/e1T4e+7Kptnidqj6k3PEhWsRF5N9u5FTOcWRlffPPp+X1jdng5n6JR+s/8TuqUrvoHT/GOcb4ntY6T4A9Tnz/0S7HzJqZRTtxaza+vxVyQxgc+Y5fdexho2kUcxOvcMP/Er8V+ZUuaUhW6qkog1Y3gSytIDLrGTkA==</latexit>
J(PC,Medium)<latexit sha1_base64="l+eFfXx4mzGWL7YvR13HbfiKIqI=">AAACg3icSyrIySwuMTC4ycjEzMLKxs7BycXNw8vHLyAoFFacX1qUnBqanJ+TXxSRlFicmpOZlxpaklmSkxpRUJSamJuUkxqelO0Mkg8vSy0qzszPCympLEiNzU1Mz8tMy0xOLAEKxQvIeWnE5CaWZBTlVgc41+rA2L6pKZmlubWa8QLKBnoGYKCAyTCEMpQZoCAgX2A5QwxDCkM+QzJDKUMuQypDHkMJkJ3DkMhQDITRDIYMBgwFQLFYhmqgWBGQlQmWT2WoZeAC6i0FqkoFqkgEimYDyXQgLxoqmgfkg8wsButOBtqSA8RFQJ0KDKoGVw1WGnw2OGGw2uClwR+cZlWDzQC5pRJIJ0H0phbE83dJBH8nqCsXSJcwZCB04XVzCUMagwXYrZlAtxeARUC+SIboL6ua/jnYKki1Ws1gkcFroPsXGtw0OAz0QV7Zl+SlgalBsxm4gBFgiB7cmIwwIz1DAz3DQBNlBydoVHAwSDMoMWgAw9ucwYHBgyGAIRRobwvDKobNDFuYWJm0mYyYTCBKmRiheoQZUACTLQA1CpVJ</latexit><latexit sha1_base64="l+eFfXx4mzGWL7YvR13HbfiKIqI=">AAACg3icSyrIySwuMTC4ycjEzMLKxs7BycXNw8vHLyAoFFacX1qUnBqanJ+TXxSRlFicmpOZlxpaklmSkxpRUJSamJuUkxqelO0Mkg8vSy0qzszPCympLEiNzU1Mz8tMy0xOLAEKxQvIeWnE5CaWZBTlVgc41+rA2L6pKZmlubWa8QLKBnoGYKCAyTCEMpQZoCAgX2A5QwxDCkM+QzJDKUMuQypDHkMJkJ3DkMhQDITRDIYMBgwFQLFYhmqgWBGQlQmWT2WoZeAC6i0FqkoFqkgEimYDyXQgLxoqmgfkg8wsButOBtqSA8RFQJ0KDKoGVw1WGnw2OGGw2uClwR+cZlWDzQC5pRJIJ0H0phbE83dJBH8nqCsXSJcwZCB04XVzCUMagwXYrZlAtxeARUC+SIboL6ua/jnYKki1Ws1gkcFroPsXGtw0OAz0QV7Zl+SlgalBsxm4gBFgiB7cmIwwIz1DAz3DQBNlBydoVHAwSDMoMWgAw9ucwYHBgyGAIRRobwvDKobNDFuYWJm0mYyYTCBKmRiheoQZUACTLQA1CpVJ</latexit><latexit sha1_base64="l+eFfXx4mzGWL7YvR13HbfiKIqI=">AAACg3icSyrIySwuMTC4ycjEzMLKxs7BycXNw8vHLyAoFFacX1qUnBqanJ+TXxSRlFicmpOZlxpaklmSkxpRUJSamJuUkxqelO0Mkg8vSy0qzszPCympLEiNzU1Mz8tMy0xOLAEKxQvIeWnE5CaWZBTlVgc41+rA2L6pKZmlubWa8QLKBnoGYKCAyTCEMpQZoCAgX2A5QwxDCkM+QzJDKUMuQypDHkMJkJ3DkMhQDITRDIYMBgwFQLFYhmqgWBGQlQmWT2WoZeAC6i0FqkoFqkgEimYDyXQgLxoqmgfkg8wsButOBtqSA8RFQJ0KDKoGVw1WGnw2OGGw2uClwR+cZlWDzQC5pRJIJ0H0phbE83dJBH8nqCsXSJcwZCB04XVzCUMagwXYrZlAtxeARUC+SIboL6ua/jnYKki1Ws1gkcFroPsXGtw0OAz0QV7Zl+SlgalBsxm4gBFgiB7cmIwwIz1DAz3DQBNlBydoVHAwSDMoMWgAw9ucwYHBgyGAIRRobwvDKobNDFuYWJm0mYyYTCBKmRiheoQZUACTLQA1CpVJ</latexit>
(a) (b)
Figure 5. The combination of PC surface softness and preferential ECM adhesion of PCs reproduced PC wrapping in CPM. (a) A heatmap of the Coverage Index obtained by changing the PC surface elastic coefficient (λS,PC) and the PC–ECM contact energy parameter (J(PC,Medium)). (b) Representative simulation results corresponding to i–vi in (a).
J(PC,EC)<latexit sha1_base64="VsfzIy3wWCrbDEL3FflJmxPFvxw=">AAACf3ichVHLLgRBFD3T3uMxg42wEROvRCZ3kHisxEQiVuMxSJBJdyt09CvdNZMwmcTaD1hYkSBiwT/Y+AELnyCWJDYW7vS0CIJbqapTp+65dapKc03Dl0QPEaWquqa2rr4h2tjU3BKLt7Yt+07e00VWd0zHW9VUX5iGLbLSkKZYdT2hWpopVrTddHl/pSA833DsJbnnig1L3baNLUNXJVO5eOfcwLqlyh3PKmbSpaEPPJMuDebiCUpSEN0/QSoECYSRceIXWMcmHOjIw4KADcnYhAqf2xpSILjMbaDInMfICPYFSoiyNs9ZgjNUZnd53ObVWsjavC7X9AO1zqeY3D1WdqOX7umSnumOruiR3n6tVQxqlL3s8axVtMLNxQ47Fl//VVk8S+x8qv70LLGF8cCrwd7dgCnfQq/oC/tHz4uTC73FPjqlJ/Z/Qg90yzewCy/62bxYOEaUPyD1/bl/guXhZGokSfOjianp8Cvq0YUeDPB7j2EKs8ggy+ce4BzXuFEiSr+SVKiSqkRCTTu+hDLxDsHsk0o=</latexit>
i ii iii
iv v vi
vii viii ix
PC EC -�
-���
�
���
�
���
���� ���� ��� ��� �
�
���
���
���
���
���
Coverage Index i
vii
iii
ix
S,PC
<latexit sha1_base64="R0aKR4UzIFe4PiYbx0I7ljOFasY=">AAACfHichVHLSiNBFD1pXzGjJqMLB9zIREVQw+1BVFyJblxGM1HBSOhuK0mTftFdCcQmPzA/MAtXKiKDM1/hxh9w4SfILB2YzTB402kQFfUWVXXq1D23TlXpnmUGkug2ofT09vUPJAdTH4aGR9KZj6M7gdvwDVE0XMv193QtEJbpiKI0pSX2PF9otm6JXb2+0dnfbQo/MF3nq2x54sDWqo5ZMQ1NMlXOjJcsTj7UymFhvmRrsubbYX6j3S5nspSjKCZfAjUGWcSRdzMXKOEQLgw0YEPAgWRsQUPAbR8qCB5zBwiZ8xmZ0b5AGynWNjhLcIbGbJ3HKq/2Y9bhdadmEKkNPsXi7rNyEtN0Qz/onq7pku7o36u1wqhGx0uLZ72rFV45/e1T4e+7Kptnidqj6k3PEhWsRF5N9u5FTOcWRlffPPp+X1jdng5n6JR+s/8TuqUrvoHT/GOcb4ntY6T4A9Tnz/0S7HzJqZRTtxaza+vxVyQxgc+Y5fdexho2kUcxOvcMP/Er8V+ZUuaUhW6qkog1Y3gSytIDLrGTkA==</latexit><latexit sha1_base64="R0aKR4UzIFe4PiYbx0I7ljOFasY=">AAACfHichVHLSiNBFD1pXzGjJqMLB9zIREVQw+1BVFyJblxGM1HBSOhuK0mTftFdCcQmPzA/MAtXKiKDM1/hxh9w4SfILB2YzTB402kQFfUWVXXq1D23TlXpnmUGkug2ofT09vUPJAdTH4aGR9KZj6M7gdvwDVE0XMv193QtEJbpiKI0pSX2PF9otm6JXb2+0dnfbQo/MF3nq2x54sDWqo5ZMQ1NMlXOjJcsTj7UymFhvmRrsubbYX6j3S5nspSjKCZfAjUGWcSRdzMXKOEQLgw0YEPAgWRsQUPAbR8qCB5zBwiZ8xmZ0b5AGynWNjhLcIbGbJ3HKq/2Y9bhdadmEKkNPsXi7rNyEtN0Qz/onq7pku7o36u1wqhGx0uLZ72rFV45/e1T4e+7Kptnidqj6k3PEhWsRF5N9u5FTOcWRlffPPp+X1jdng5n6JR+s/8TuqUrvoHT/GOcb4ntY6T4A9Tnz/0S7HzJqZRTtxaza+vxVyQxgc+Y5fdexho2kUcxOvcMP/Er8V+ZUuaUhW6qkog1Y3gSytIDLrGTkA==</latexit><latexit sha1_base64="R0aKR4UzIFe4PiYbx0I7ljOFasY=">AAACfHichVHLSiNBFD1pXzGjJqMLB9zIREVQw+1BVFyJblxGM1HBSOhuK0mTftFdCcQmPzA/MAtXKiKDM1/hxh9w4SfILB2YzTB402kQFfUWVXXq1D23TlXpnmUGkug2ofT09vUPJAdTH4aGR9KZj6M7gdvwDVE0XMv193QtEJbpiKI0pSX2PF9otm6JXb2+0dnfbQo/MF3nq2x54sDWqo5ZMQ1NMlXOjJcsTj7UymFhvmRrsubbYX6j3S5nspSjKCZfAjUGWcSRdzMXKOEQLgw0YEPAgWRsQUPAbR8qCB5zBwiZ8xmZ0b5AGynWNjhLcIbGbJ3HKq/2Y9bhdadmEKkNPsXi7rNyEtN0Qz/onq7pku7o36u1wqhGx0uLZ72rFV45/e1T4e+7Kptnidqj6k3PEhWsRF5N9u5FTOcWRlffPPp+X1jdng5n6JR+s/8TuqUrvoHT/GOcb4ntY6T4A9Tnz/0S7HzJqZRTtxaza+vxVyQxgc+Y5fdexho2kUcxOvcMP/Er8V+ZUuaUhW6qkog1Y3gSytIDLrGTkA==</latexit><latexit sha1_base64="R0aKR4UzIFe4PiYbx0I7ljOFasY=">AAACfHichVHLSiNBFD1pXzGjJqMLB9zIREVQw+1BVFyJblxGM1HBSOhuK0mTftFdCcQmPzA/MAtXKiKDM1/hxh9w4SfILB2YzTB402kQFfUWVXXq1D23TlXpnmUGkug2ofT09vUPJAdTH4aGR9KZj6M7gdvwDVE0XMv193QtEJbpiKI0pSX2PF9otm6JXb2+0dnfbQo/MF3nq2x54sDWqo5ZMQ1NMlXOjJcsTj7UymFhvmRrsubbYX6j3S5nspSjKCZfAjUGWcSRdzMXKOEQLgw0YEPAgWRsQUPAbR8qCB5zBwiZ8xmZ0b5AGynWNjhLcIbGbJ3HKq/2Y9bhdadmEKkNPsXi7rNyEtN0Qz/onq7pku7o36u1wqhGx0uLZ72rFV45/e1T4e+7Kptnidqj6k3PEhWsRF5N9u5FTOcWRlffPPp+X1jdng5n6JR+s/8TuqUrvoHT/GOcb4ntY6T4A9Tnz/0S7HzJqZRTtxaza+vxVyQxgc+Y5fdexho2kUcxOvcMP/Er8V+ZUuaUhW6qkog1Y3gSytIDLrGTkA==</latexit>
ii
iv v vi
viii
(a) (b)
Figure 6. The combination of PC surface softness and strong PC–EC adhesion reproduced PC wrapping in CPM. (a) A heatmap of the Coverage Index obtained by changing the PC surface elasticity (λS,PC) and the PC–EC contact energy parameter (J(PC,EC)). (b) Representative simulation results corresponding to i–ix in (a).