九州大学学術情報リポジトリ
Kyushu University Institutional Repository
MRTOF とα-TOF 検出器を用いた超重核の直接質量測 定
庭瀬, 暁隆
http://hdl.handle.net/2324/4474932
出版情報:Kyushu University, 2020, 博士(理学), 課程博士 バージョン:
権利関係:
First direct mass measurement of superheavy nuclide via MRTOF mass spectrograph equipped with an α-TOF detector
Toshitaka Niwase
Department of Physics, Kyushu University February 23, 2021
Contents
1 Introduction 6
1.1 Superheavy nuclides . . . 6
1.2 Decay theory of superheavy nuclides . . . 9
1.2.1 α-decay . . . . 10
1.2.2 Spontaneous fisson . . . 12
1.3 Direct determination of atomic number of superheavy elements 16 1.3.1 Characteristic X-ray . . . 16
1.3.2 Mass measurements . . . 18
1.4 Ion manipulation for low-energy RI . . . 22
1.4.1 Gas catchers . . . 22
1.4.2 RF carpet . . . 23
1.4.3 RF multipole ion guide . . . 27
1.4.4 RF quadrupole ion trap and mass separator . . . 28
1.5 Mass measurement techniques . . . 30
1.5.1 Indirect mass measurements . . . 30
1.5.2 Direct mass measurements . . . 30
1.6 SHE-Mass facility . . . 41
1.6.1 GARIS-II . . . 42
1.6.2 Cryogenic gas-cell . . . 44
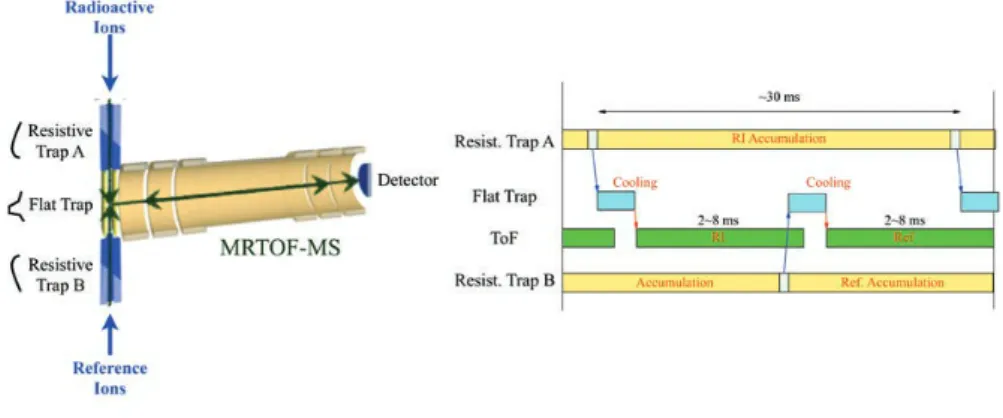
1.6.3 Flat trap/Drift tube . . . 46
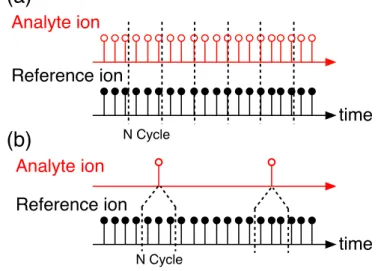
1.6.4 Reference ion . . . 48
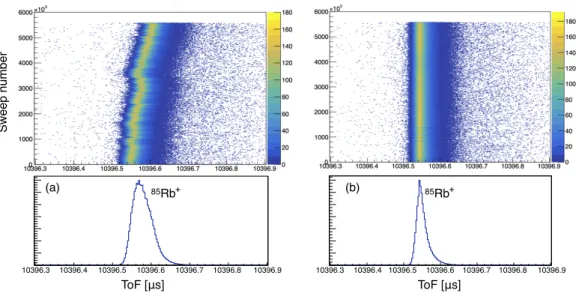
1.6.5 Drift correction . . . 50
1.7 Direct mass measurement for heavy nuclei . . . 52
1.7.1 SHE-Mass facility II . . . 52
1.7.2 Bottleneck for measurement of superheavy nuclei . . . 53
1.8 Research strategy . . . 54
2 Development of the α-TOF detector 56 2.1 Concept of theα-TOF detector . . . . 56
2.2 Fabrication of modified impact plate . . . 57
2.2.1 Coating of material on SSD . . . 58
2.2.2 Embedded to impact plate . . . 62
2.3 Design of front-end circuit board . . . 64
2.4 Characterization test ofα-TOF withα-source . . . . 67
2.4.1 TOF detection efficiency . . . 68
2.4.2 Time resolution . . . 70
2.4.3 TOF-E correlation measurement by using mixed triplet α-source . . . . 71
2.5 Offline test . . . 72
2.5.1 Decay correlated TOF measurement with radioactive 224Ra progenitor . . . 73
2.5.2 Results . . . 75
2.6 Online testing . . . 80
2.6.1 Experimental setup . . . 80
2.6.2 Result . . . 81
2.6.3 Anticipated application for nuclear decay spectroscopy 86 3 Mass measurement of 206,207Ra 93 3.1 Decay properties of207g/mRa . . . 94
3.2 Experiment . . . 94
3.2.1 Energy calibration of α-TOF detector . . . . 95
3.2.2 Secondary energy degrader optimization . . . 95
3.3 Results . . . 97
3.3.1 Analysis of 206Ra . . . 99
3.3.2 Analysis of 207Ra . . . 102
3.4 Discussion . . . 109
4 Mass measurement of 257Db 112 4.1 History of the elementZ = 105 . . . 112
4.1.1 Previous study of 257Db . . . 112
4.2 Experiments . . . 115
4.2.1 Setup . . . 115
4.2.2 Degrader optimization for 257Db . . . 115
4.2.3 Yield estimation . . . 116
4.2.4 The charge state of 257Db ion . . . 118
4.3 Results . . . 118
4.3.1 Coincidental probability . . . 124
4.3.2 Accuracy of each event . . . 125
4.3.3 Event assignments . . . 127
4.3.4 Consideration of the number of correlated events . . . 129
4.3.5 Number of background counts . . . 130
4.3.6 Mass analysis . . . 131
4.4 Discussion . . . 134
4.4.1 Comparison with various mass models . . . 134
4.4.2 Z determination from mass measurements . . . 135
5 Future prospective 137 5.1 Further mass measurements of superheavy nuclides . . . 137 5.1.1 Plans for future measurements of Db and Sg isotopes 137 5.1.2 Mass measurement of Mc/Nh produced by hot fusion
reaction . . . 138 5.2 Future development of α/β-TOF detector . . . 139
6 Conclusion 142
A Statistical error and figure of merit 146 B Fitting code for 206,207Ra measurements 148 B.1 Macro for206Fr,206Ra . . . 148 B.2 Macro for207Fr,207g/mRa . . . 149
C Table of confidence level 151
Abstract
The ground state atomic mass is one of the most fundamental physical quantities and has a unique value for each nucleus. Mass is an important tool not only for discussing nucleon-nucleon interaction but also for uniquely determining the mass number and atomic number of unknown superheavy elements, by providing a fingerprint for the identification of elements. Pre- cision mass measurements of nuclides have been performed at many labo- ratories in the world. Prior to this work, the heaviest element for which atomic masses were directly measured was Lawrencium (Z=103); no such measurements had been made for a superheavy element. We have carried out precision mass measurements of several heavy nuclei in the SHE-Mass facility using a multi-reflection time-of-flight mass spectrograph (MRTOF- MS), and the gas-filled recoil ion separator GARIS-II. Due to the extremely low fusion cross section, the amount of ions to work with is small in su- perheavy element experiments. Therefore, accurate mass measurements are required that can discriminate against background events such as cosmic rays, environmental noise, dark counts, etc.
In this study, we have developed a new detector, which we call “α-TOF”, for the first direct mass measurement of a superheavy nuclide. The α-TOF detector comprises a Si semiconductor detector embedded in a commercial time-of-flight detector, to allow correlations between the acquisition of time- of-flight signals and subsequent alpha decay events. The α-TOF detector enables accurate and precise mass measurement by using correlated alpha decay events as footprints, even for extremely low-yield cases with less than a few events per day.
The characterization of theα-TOF detector was evaluated using a mixed tripletα-source and with a 224Ra radioactive source. The α-TOF detector was evaluated to have an energy resolution of σ=141.1(9) keV and a time resolution of 250.6(68) ps. It is sufficient to distinguish the decay of su- perheavy nuclides with different atomic numbers. It was also demonstrated that the half-life can be derived from the time difference between the arrival time and the decay time of the ions. In a subsequent online performance test,207Ra produced by the159Tb(51V,3n) reaction was measured in a high- background environment to demonstrate the ability of the decay correlation to suppress background events.
The correlated measurement of time-of-flight and decay event can be ap- plied to nuclear spectroscopy studies with MRTOF-MS equipped with the α-TOF. The decay correlated mass measurements of 206,207Ra produced in the159Tb+51V reaction system have been performed to directly determine the mass excessesME(206Ra)=3540(54) keV andME(207gRa)=3538(15) keV and also the excitation energy of 207mRa to beEex=552(42) keV. Further- more, the branching ratio of 207mRa was determined from the measured time-of-flight signal and its decay properties, and spin-parity was estimated
to be13/2+, based on its systematics with the reduced alpha width (δ2) of the neighboring nuclei.
The first direct mass measurement of a superheavy nuclide,257Db, pro- duced in the208Pb(51V, 2n) reaction, was successfully performed using our MRTOF equipped withα-TOF detector. In a total of 105 hours of beam ir- radiation, we acquired 11 events wherein257Db3+ time-of-flight signals were correlated with subsequentα-decay events. The measured correlated decay events are consistent with the decay properties of257Db or its decay descen- dants. The mass excess of 257Db was determined to be ME(257Db)=100 063(231)(2) keV from a weighted average of these 11 events. The de- viation from the indirectly determined value in our previous result was
∆ME=171(231) keV. The mass excess derived from each of the individual events were clearly distinguished from those of isobars with different atomic numbers. It was experimentally shown that a single event is sufficient for the identification of Z and A, demonstrating that accurate and precision mass measurement is an extremely powerful tool for the identification of superheavy nuclides.
Chapter 1
Introduction
The purpose of this study is to develop an α-TOF detector to be used in the first direct mass measurement of superheavy elements.
1.1 Superheavy nuclides
There are 92 elements naturally existing on Earth, the heaviest of which is plutonium (Pu) with atomic numberZ = 94. All of the elements above Z = 94 have been artificially synthesized through nuclear reactions. In November 2016, the International Union of Pure and Applied Chemistry (IUPAC) and the International Union of Pure and Applied Physics (IUPAP) approved the names Nihonium (Nh), Moscovium (Mc), Tennessine (Ts), and Oganesson (Og) for atomic number of 113, 115, 117, and 118, respectively.
The Periodic Table of the Elements has been filled up to the 7th period. The research is now underway in laboratories around the world to synthesize the first 8th period elements, i.e, elements 119 and 120 [1].
In the 1960s, the prediction of long-lived nuclei, called “islands of stabil- ity” [2], was proposed in the nuclei with atomic numbers well beyond those of lead and uranium, as shown in Fig. 1.1. The existence of islands of stability is intrinsically important when discussing the existence limits and stability of nuclei. Until the early 1980s, the islands around Z = 114 and neutron number N = 184 were referred to as superheavy elements and superheavy nuclides. Nowadays, as pioneered by the field of radiochemistry, the term
“superheavy element” denotes a trans-actinide element,i.e. an element with Z ≥104 [3].
Neutron number N
Proton number Z
H. Koura log10 (Ttotal / (s))
Figure 1.1: Nuclear chart showing superheavy nuclei calculated by KUTY mass formula. Open squares are known nuclides. The KUTY calculation suggests that there are islands of stability with a half-life of about 300 years around Z = 114 and N = 184, and N = 230. Figure courtesy of H. Koura of Japan Atomic Energy Agency (JAEA).
In 1940, the first transuranium nuclide synthesized was Z = 93, Neptu- nium, by McMillan at the University of California, through irradiation of a
238U target with a neutron beam. Subsequently, elements of Z = 94−98 were synthesized by Seaborg et al., by deuteron irradiation to 238U and further neutron and helium irradiation of the reaction products. These el- ements have been chemically identified. Elements with atomic numbers 99 and 100 (einsteinium and fermium, respectively), were first discovered in the analysis of hydrogen-bomb experiment products from the Eniwetok Atoll in the Central Pacific Ocean.
All the elements after the atomic number of 101 were produced by fu- sion reactions using accelerators. Mendelevium was synthesized by Seaborg et al. using a fusion reaction of 253Es(α,n)256Md. In the 1960s, several elements were synthesized using so-called hot fusion reactions by a group of soviet scientists lead by Oganessian. In this method, actinide elements such as uranium and americium were used as target nucleus to produce compound nuclei with high excitation energy, resulting in multiple neutrons being emitted for cooling of the evaporation residue (ER). This method was successfully applied to synthesize elements with atomic numbers from 102, nobelium, to 106, seaborgium.
In 1974, Oganessian proposed a cold fusion reaction, which uses a dou- ble closed shell target such as 208Pb, and the stable nuclides were used as incident particle. In this method, theQ-value of the reaction is reduced and the excitation energy of the compound nucleus is lower than those produced in hot fusion reactions. The SHIP group at GSI in Germany successfully synthesized elements of atomic numbers from 107, bohrium, to 112, coper- nicium, using cold fusion reactions. And in 2004, the first event for element
113, nihonium, was reported by Morita et al. at RIKEN using a cold fusion reaction of70Zn+209Bi.
The synthesis process of superheavy elements can be considered as a two-stage process of formation and de-excitation according to the compound nuclear model explained by N. Bohr [4], the evaporation residue cross section can be described by multiplication of the fusion probability (Pfus) and the survival probability (Psurv). Psurv is expressed as the competition between the neutron emission width and the fission width Γn/Γf of the compound nucleus, and the probability decreases with increasing excitation energy, therefore the fusion of nuclei in a reaction system with low excitation energy is required. This is the concept of cold fusion reactions. The fusion proba- bility,Pfus, decreases drastically due to “fusion hindrance” as the product of the number of protons in the projectile nucleusZ1and the target nucleusZ2 increases. For asymmetric reaction systems such as hot fusion reactions, the Pfuswould be larger than symmetric cold fusion reactions. The cross section to produce element 113 by the cold fusion reaction is already 22 fb (fb=10−15 barn; 1 barn=10−24cm2), and thus it is unreasonable to synthesize higher-Z nuclides in this way.
Oganessian found that the excitation energy of the compound nucleus can be relatively suppressed even in the hot fusion reaction by using 48Ca, which is a doubly closed shell nuclide, as a projectile [5]. By this method, Fl (Z = 114) to Og (Z = 118) have been synthesized, and the periodic table of elements has been completed up to the 7th period. The discovery of transuranium elements are summarized in Table 1.1.
Table 1.1: Summary of the synthesized trans-uranium elements.
Z Symbol Reaction Investigators Year
93 Np 238U(n,γ)239U→239Np MacMillan et al., 1939 94 Pu 238U(d,2n)238Np →238Pu Seaborg et al., 1940 95 Am 239Pu(2n,γ)241Pu→241Am Seaborg et al., 1944 96 Cm 239Pu(α,n)242Cm Seaborg et al., 1944 97 Bk 241Am(α,2n)243Bk Seaborg et al., 1949 98 Cf 242Cm(α,n)245Cf Seaborg et al., 1950 99 Es 238U+15n →253Es Seaborg et al., 1953 100 Fm 238U+17n →255Fm Seaborg et al., 1953 101 Md 253Es(α,n)256Md Seaborg et al., 1955 102 No 246Cm(12C,4n)254No Seaborg et al., 1958 103 Lr 252Cf(11B,6n)257Lr Ghiorso et al., 1961 104 Rf 249Cf(12C,4n)257Rf Ghiorso et al., 1969 105 Db 249Cf(15N,4n)260Db Ghiorso et al., 1970 106 Sg 249Cf(18O,4n)263Sg Ghiorso et al., 1974 107 Bh 209Bi(54Cr,n)262Bh Armbruster et al., 1981 108 Hs 208Pb(58Fe,n)265Hs Armbruster et al., 1984 109 Mt 209Bi(58Fe,n)266Mt Armbruster et al., 1982 110 Ds 208Pb(62Ni,n)269Ds Armbruster et al., 1995 111 Rg 209Bi(64Ni,n)272Rg Hofmann et al., 1995 112 Cn 208Pb(70Zn,n)277Cn Hofmann et al., 1996 113 Nh 209Bi(70Zn,n)278Nh Morita et al., 2004 114 Fl 242Pu(48Ca,3n)287Fl Oganessian et al., 2004 115 Mc 243Am(48Ca,3n)288Mc Oganessian et al., 2004 116 Lv 245Cm(48Ca,2n)291Lv Oganessian et al., 2004 117 Ts 249Bk(48Ca,3n)294Ts Oganessian et al., 2010 118 Og 249Cf(48Ca,3n)294Og Oganessian et al., 2006
1.2 Decay theory of superheavy nuclides
The primary decay modes of extremely heavy nuclides, such as the super- heavy elements, include not only β-decay and electron conversion but also α-decay and spontaneous fission. In the case of the superheavy elements, these decay modes play a role in determining their lifetimes and existence limits.
1.2.1 α-decay
One decay mode isα-decay, by which the parent nuclideP is transformed to the daughter nuclide D by emitting an alpha particle (4He nucleus). It is described as
A
ZP⇒AZ−−24 D +α+Qα, (1.1) whereAis a mass number, andQαis theQ-value of the alpha decay, i.e., the energy released by the alpha decay, which corresponds to the mass difference betweenP and D+α. In order for alpha decay to be allowed,Qα >0,
Qα= (MP −MD−Mα)c2. (1.2) Qαis described by Eq. (1.2), whereMxdenotes the masses of parent (P), daughter (D) and alpha particles. Since in anα-decay,Qα is distributed in the kinetic energies of an alpha particle and a daughter nucleus, the energy and momentum conservation law requires:
Qα =Eα+ED = 1
2Mαvα2 +1
2MDvD2, (1.3)
0 =Mαvα−MDvD, (1.4)
where Eα and ED are the kinetic energy of alpha particle and daughter nuclei,vα and vD are the velocity of these.
From this, the relationship between the Qα and energy can be written as follows:
Eα = MD
Mα+MDQα ≈ A−4
A Qα, (1.5)
ED = Mα
Mα+MDQα ≈ 4
AQα. (1.6)
The α-decay was explained quantum mechanically as a tunneling effect through the Coulomb barrier by Gamow [6], Condon and Gurney [7]. Their explanation led to the Geiger-Nuttal law, a relationship between the half-life T1/2 and theQα given by
log10T1/2 =a Z
√Qα +b, (1.7)
whereaandbare constants defined for each element. In the region of super- heavy elements, an improved description of the Geiger-Nuttal law has been proposed, and the experimental results have been successfully reproduced.
The improved Geiger-Nuttal law is shown in Eq. (1.8) and the proposed parameters are tabulated in Table 1.2,
log10T1/2 = a1Z√P +a2
Qα
+ (b1ZP +b2). (1.8)
Table 1.2: Proposed parameter of Eq. (1.8). In the term b2, hlog is a cor- rection term for parity: hlog=0 (Z, N= even), hlog=1.066 (Z= even, N= odd),hlog=0.772 (Z= odd,N=even), hlog=1.114 (Z,N=odd).
Range a1 a2 b1 b2 Reference
Z >82,N >126 2.11329 -48.9879 -0.390040 -16.9543+hlog [8]
Z >104 1.66175 -8.5166 -0.20228 -33.9069 [9]
Z >82,N >126 1.81040 -21.7199 -0.26488 -28.1319 [10]
100≤Z≤120 1.66175 -8.5166 -0.20228 -33.9069+hlog [11]
The conceptual diagram ofα-decay is shown in Fig. 1.2. Since the nuclear force is a short-range force, the Coulomb repulsion is dominant in outsideR0 (whereR0 is the surface of a nuclide). Since Eα is lower than the Coulomb barrier, in classical mechanics the alpha particle cannot escape from the parent nucleus. However, in quantum mechanics it is possible to exit the potential wall through the tunneling effect; this process corresponds to the α-decay.
Using the WKB approximation, the barrier penetration probability ofα particles is described as
P = exp [
−2 ℏ
∫ RE
R0
√
2Mα[2(Z−2)e2
r −Eα]dr ]
≈ exp [
−R0
√2MαBα
ℏ (π√
Bα/Eα−4) ]
, (1.9)
whereBα = 2(Z−2)e2/R0. The decay constant for α-decay is the product of the transmission coefficient P and the number of times the α particle collides with the barrierf,
λ=f P. (1.10)
If the velocity of theα particle in the nucleus isv, thenf =v/(2R), and the decay constant and half-life are written
λ= v
2RP, T1/2 = 2Rln2
vP . (1.11)
In the alpha decay of a given nucleus, there is a microstructure in which several groups of alpha particles with similar energies appear but their in- tensities differ greatly from one group to another. In order to explain these
features, the internal structure of the nucleus must be taken into account. It uses either R. G. Thomas theory based on the time-independent Schrödinger equation [12] or H. J. Mang theory based on a time-dependent theory [13].
Both of these theories are shown to be equivalent under the assumption that the nuclear wave function satisfies the same boundary conditions. The alpha decay constant is the sum of the terms, each corresponding to a given final state, and is the product of two factors representing potential barrier pene- tration and reduced width, which can be argued from the systematics of the reduced alpha width (δ2) of the nucleus as calculated with the Rasmussen prescription [14],
λ=δ2P/h, (1.12)
where h is the Planck constant. Using the partial half-life of α-decay and the barrier penetration factor, which can be obtained from experiments, it is possible to discuss the structure of α-decay.
Figure 1.2: Conceptional diagram of alpha decay.
1.2.2 Spontaneous fisson
The binding energyBof the nucleus in the classical liquid drop model can be written from the semi-empirical Weizsäecker-Bethe (WB) mass formula as
B(A, Z) =avA−asA2/3−ai(N −Z)2
A −ac Z2
A1/3 −δ(A), (1.13) where constant terms in Eq. (1.13) are understood to be the volume term av, surface termas, asymmetry term ai, coulomb termac, and paring term δ(A)(Eq. (1.14)). These parameters are determined so as to best reproduce the experimental values. A typical set of the parameters [15] is given below, in units of MeV,
δ(A) =
12/√
A (Z, N =odd)
0 (A=odd)
−12/√
A (Z, N =even)
, (1.14)
av = 15.753, as= 17.804, ai= 23.69, ac= 0.710.
(1.15) Nuclear fission was described by Bohr and Wheeler in 1939 on the basis of such a classical liquid drop model [16]. A conceptual diagram of fission is shown in Fig. 1.3.
If a spherical nucleus of radiusRis deformed into a cigar-shaped rotating ellipse with a constant volume and a major axis of 2a and a minor axis of 2b,aand bare described as
a=R(1 +ε), b=R/√
1 +ε, (1.16)
whereεis a deformed parameter.
The surface area of the spheroid S is S = 4πR2
( 1 +2
5ϵ2+· · · )
, (1.17)
then, the increase in surface energy due to deformation, ∆Es, is described as
∆Es=asA2/3·2 5ϵ2 = 2
5ϵ2E0s, (1.18) whereEs0is the surface energy of the spherical nucleus, and using the surface tension coefficientsγ and as, the
Es0 = 4πR2γ =asA2/3. (1.19)
From the Coulomb energy of the spherical nucleus, the elliptical Coulomb energyEc is given
Ec0= 3 5
Z2e2
R =ac Z2
A1/3, (1.20)
Ec= 3 5
Z2e2 R
( 1− 1
5ϵ2+. . . )
. (1.21)
The increase in Coulomb energy due to the deformation is written
∆Ec=−ac Z2 A1/3 ·1
5ϵ2= 1
5ϵ2Ec0. (1.22) From the above, the variation of the total potential energy is
∆E= ∆Es+ ∆Ec= 2 5ϵ2Es0
(
1− Ec0 2Es0
)
. (1.23)
This formula means that the sphere is more stable if ∆E > 0 and un- stable if ∆E < 0. Since ∆Es is proportional to A2/3 and ∆Ec is nearly proportional to A5/3, therefore, in regions where A is large, such as the heavy nucleus, the second term increases and approaches ∆E < 0. Conse- quently, the nucleus is more prone to spontaneous fission.
The value of Z2/A, where∆E= 0 is found to be (Z2
A )
∆E=0
≃50.15, (1.24)
that is, nuclei with(Z2/A)>50.15 are unstable to deformation and imme- diately undergo spontaneous fission. In the superheavy nuclei, 278Nh has (Z2/A) = 45.93 and296119 has (Z2/A) = 47.84, indicating that the nucleus is very unstable to nuclear deformation. In these nuclei, the probability of spontaneous fission determines the existence limit of the nucleus.
Fission Barrier :
Deformation
R
b a
Figure 1.3: Conceptional diagram of spontaneous fission. The horizontal axis is the distance between the fragments and the vertical axis is the po- tential for the nuclear deformation.
1.3 Direct determination of atomic number of su- perheavy elements
Figure 1.4: Map of the region of superheavy nuclides with the reactions used to synthesize each nuclide. The colors indicate different decay modes. This figure taken from [17].
The nuclides in the superheavy element region and the reactions used to synthesize the various nuclides are shown in Fig. 1.4. The relatively neutron-deficient isotopes of the Nh were synthesized in cold fusion reac- tions using stable Pb or Bi target. Their decay chain, reaching to known nuclei, meets the criteria for identification of new elements [18]. The more neutron-rich elements 112-118 were produced in hot fusion reactions using an actinide target with a48Ca beam. The decay chains of the three elements Mc, Ts, and Og have been identified by cross-bombardment reactions, al- though their decay chains do not reach the known nuclides [19]. Since future superheavy elements synthesis will be mainly based on hot fusion, these un- known nuclides may terminate in spontaneous fission without their decay chains reaching the known nuclides. The Joint Working Group (JWP) of IUPAP and IUPAC has called for pioneering methods to directly identify the atomic number and mass number of synthesized nuclei in future superheavy element search experiments [20].
1.3.1 Characteristic X-ray
Decay from an excited nucleus proceeds by internal conversion as well as α-decay and γ-ray emission. Following the emission of the conversion electron from the atom, X-ray emission is by far the most likely process
in the atomic deexcitation. In 1914, Moseley derived a law that relates the frequency of an element’s X-ray spectrum to the atomic number of the element that emitted it [21]. For example, the KαX- and LX-rays can be described by following relationship formula,
νKα=R(Z−1)2(1 12 − 1
22), (1.25)
νL=R(Z−σ)2( 1 22 − 1
32), (1.26)
whereRis the Rydberg constant,σis an arbitrary constant. The character- istic X-ray energies are one of the direct measures used inZ identification.
These energies are predicted with high accuracy and are consistent with experimental data up to Db. The X-ray spectroscopy of the superheavy element region has been conducted for a long time, and the first identifica- tion of Rutherfordium by X-ray measurement was carried out in the early 1970s [22].
Similar toγ-rays, X-ray detection is inherently inefficient. Therefore, an extensive experimental setup with a Ge detector array is required. Recently, Rudolph et al., at GSI found the first candidate to be aZ fingerprint of the Meitnerium (Z = 109) isotopes from spectroscopic studies of Mc and its progenitor produced by the48Ca+243Am reaction [23].
X-ray measurements provide a tool for atomic number identification, but it may give ambiguous results ifpxn evaporation channels are possible or if electron capture decay is the decay mode of the nuclide in the decay chain, as demonstrated in Fig. 1.5. In Figs. 1.5 (a) and (b) we see 3n and p2n evaporation channels with two alpha decays prior to X-ray detection. In both cases, characteristic X-rays of element Z −5 are observed due to an electron capture decay in the3nchannel’s decay chain. X-ray measurements identify only the atomic number of an X-ray emitting nuclide, not the atomic number of the initial progenitor. Moreover, the mass number of the nuclide cannot be identified, therefore, the estimation of the evaporation residue includes lots of ambiguities.
(Z, A)CN - 3n
(Z, A-3)ER
(Z-2, A-5)
(Z-5, A-7)
(a) (b) (Z, A)CN - p2n
(Z-3, A-5)
(Z-5, A-7)
(Z-3, A-5) (Z-1, A-3)ER α1
α1
α2 α2
EC
X-ray X-ray
Figure 1.5: Schematic decay diagram exemplifying X-ray measurements for (a)3nevaporation channel and (b) p2nevaporation channel. In both cases the observed X-rays are from element Z −5, implying that there is some ambiguity in the assignment of parent nuclide.
1.3.2 Mass measurements
Mass is one of the most important static properties of nuclei. Nowadays, by Einstein’s equationE =mc2, we know the binding energy corresponds to the requirement to stabilize the nucleus as a quantum many-body system.
As the binding energy is the minimum energy to take apart a nucleus into a set of discrete nucleons, or the energy released when the nucleons interact and combine as nuclei. The binding energies reflect the nuclear structure and interactions of nucleons, mass measurements provide us with important information.
Table 1.3: Required mass precision for various research fields. These values are taken from [24].
Research Category δm/m
Chemistry : Identification of molecules 10−5−10−6
Nuclear mass model 10−6
Nuclear structure : shell, paring 10−6 Nuclear fine structure : deformation, halo 10−7−10−8 Astrophysics : r-process, rp-process 10−7 Atomic physics : Quantum electrodynamics 10−9−10−11
High-precision mass measurements, particularly those of short-lived radio- nuclides, are required for the study of nuclear structure and astrophysical nucleosynthesis. Table 1.3 shows examples of research categories and req-
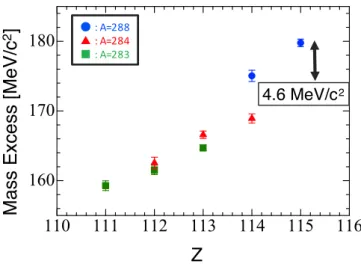
uisite relative mass uncertainty (δm/m). The mass excess (ME) is the fractional part of the mass in atomic mass units. Figure 1.6 shows the mass excess for the isobars of A= 288,284and 283 in the Nihonium region; the values are extrapolated from known nuclides. The mass excess difference be- tween neighboring isobars increases quadratically with distance from the β stability line. Therefore,Z andA can often be directly and unambiguously distinguished by mass measurements withδm/m∼10−6-level precision.
Z Mass Excess [MeV/c2]
4.6 MeV/c2
Figure 1.6: Estimated mass excess for select superheavy nuclei with A = 288,284and 283. The values, taken from AME2016 [25], are extrapolated from known nuclides.
There are a variety of global mass models that attempt to accurately predict unknown masses. The accuracy of these mass models will be crucial to discuss the validity of the unknown nuclear masses once they have been experimentally determined. The first attempt to describe the binding energy of the nucleus is the liquid drop model as described by the semi-empirical WB equation, describe as Eq. (1.13). Although the liquid drop model ignores the nuclear shell effect, it is the basis for many mass models.
Shell model
Attempts to understand the nucleus from the standpoint of the inde- pendent particle model began in 1949 with the proposal of the nuclear shell model by Meier and Jensen. The idea of the shell model originated from the accumulation of experimental facts suggesting the phenomenon of shell closure in nuclear structure. It is a fact that whenZ orN = 2, 8, 20, 28, 50, 82, 126 that nucleus is in a particularly stable state. A nucleus is considered to form a closed shell when Z or N is equal to these numbers, which are called “magic numbers”.
0 4 8 12 16
50 100 150
S
2n/2 [M eV ]
N
Figure 1.7: Two-neutron separation energies for isotopic chain with known masses. The steep change inS2n seen at N=50, 82, and 126 are a signal of the neutron shell closures. Other non-monotonic features can indicate e.g.
shape deformations, etc. This figure taken from [26].
To explain the manifestation of the shell effect, we consider the energy required to remove one or two neutrons from a nucleus, called the neutron separation energy, Sn, and the two-neutron separation energy, S2n, and defined as
Sn = B(Z, N)−B(Z, N −1), (1.27) S2n = B(Z, N)−B(Z, N −2), (1.28) where B is the binding energy of an atom as determined by the masses of the atoms
B(Z, N) =Zmp+Zme+N mn−M(N, Z), (1.29) wheremp,me, and mn are the masses of the proton, electron, and neutron, respectively, whileM is the atomic mass. The neutron separation energy is a quantity that describes the stability of the nucleus against neutron emission, and in the nuclides near the neutron drip line, shows the neutron binding state. Figure 1.7 shows a plot ofS2n as a function of the neutron number.
It can be seen thatS2n has a sharp minimum when the number of neutrons increases by one from the magic numbers. That is, the neutrons make a closed shell at this magic number value. The same trend can be seen when we perform similar plots for proton separation energies,Sp and S2p.
Macroscopic-Microscopic approach
The liquid drop model reproduces most of the known isotopes, but does not include the shell structure. In contrast, the shell model explains the occurrence of magic numbers very well, but it does not allow us to calculate the absolute value of the binding energy. Therefore, in 1966, W. D. Myers and W. J. Swiatecki attempted to extend the liquid drop model by combining both theories. These types of approaches are called macroscopic-microscopic approaches because they involve both microscopic assumptions of single- particle energy levels and macroscopic assumptions of the liquid drop model.
Subsequently, V. M. Strutinsky proposed the hypothesis that the shell correction δS and the pairing correction δP for protons and neutrons con- tribute to the binding energy of the nucleus. The binding energy BMM described by this macroscopic-microscopic approach is expressed by
BMM(N, Z) =BLD+ Σ(δS+δP), (1.30) where BLD is the binding energy from the liquid drop model. The shell correction is determined by evaluating the energy difference between the level interval S of the non-uniform distribution and the level interval S¯ of the uniform distribution,
S= Σiniϵi, S¯=
∫ ∞
−∞ϵg(ϵ)dϵ, (1.31)
whereϵi are the energy eigenvalues of the protons and neutrons, andni are the population numbers of a given energy level. The distribution function g(ϵ) is defined by a smearing parameter γ,
g(ϵ) = 1 γ√
πΣinie
−(ϵ−ϵi)2
γ2 . (1.32)
Similarly, the pairing correctionδP is derived by Bardeen-Cooper-Schrieffer theory [27]. Today, several additions to this approach have been made and various theoretical calculations have been performed. For example, the FRDM model allows for droplet compression. The WS4RBF has been con- structed to reproduce experimental values by adding the radial basis function correction (RBF) to the Weizsäcker-Skyrme (WS) model, which takes into account the isospin dependence of the model parameters and the specular correction from isospin symmetry. KTUY calculation is a phenomenological method that considers the nucleus as the basis of a sphere and the deformed nucleus as its spherical coordination mixture.
Microscopic methods
In addition to the macroscopic microscopic approach, purely microscopic methods have also been developed. The HamiltonianHby the Hartree-Fock approximation describes the interactions between nuclei as the mean field VHF produced by the nucleus and the interactions of any nucleus,
HHF=−ℏ2
2mΣi∇2i + ΣiVHFi . (1.33) In this method, the binding energy is evaluated as the sum of the energy functions solved by the Ritz variation method [28],
BSHF=Ekine+Ecoulomb+Epair+Eskyrme+Ecorr, (1.34) where the first four terms are kinetic, coulomb, and pairing energies and a correction term. Eskyrmeis a term for considering phenomenological nucleon- nucleon interactions and is called the skyrme force. There are various ver- sions that extend the skyrme force term, and a typical one used for mass model calculations is HFB.
1.4 Ion manipulation for low-energy RI
The ion manipulation techniques are used to handle low energy ions such as, stopping, transporting, thermalization and trapping. Especially for radioactive ions, it is important to efficiently handle ions, since the yields are generally not so high. The most common way to manipulate low-energy ions is by using a magnetic field and/or radiofrequency (RF) electric field. In our experimental setup, we use a gas catcher and multiple RF trap systems to manipulate ions.
1.4.1 Gas catchers
The gas catcher, also called a gas cell or gas-filled ion guide, was first used in the IGISOL method in JYFL [29]. A primary beam irradiated a target in the gas cell, and the reaction products were thermalized by the helium buffer gas and extracted by the gas flow. There were problems with space charge effects caused by high intensity primary beam. However, if the primary beam is preseparated by a separator one can minimize space charge effects. The separated and transported ions are decelerated and thermalized in a gas catcher filled with a noble gas, typically a Helium. The Helium gas is often chosen as a buffer gas because it has the highest first ionization potential among chemical elements. The thermalized ions are extracted by a combination of a direct current (DC) electric field and a gas flow or of DC
and RF electric fields in the gas cell. The extracted low-energy beam is sent to the high vacuum region where the experiment is performed.
1.4.2 RF carpet
RF: 0°
RF: 180°
RF: 0°
RF: 180°
+ wave: 0°
+ wave: 90°
+ wave: 180°
+ wave: 270°
ion
RF-carpet ring electrodes
+Vp
Fp
FRF
Exit nozzleExit orifice
AF AF AF AF
Figure 1.8: Conceptual view of RF carpet and ion surfing method. FRF and Fp are the repelling force from the RF carpet and a pushing force, respectively. This figure taken from [30].
In experiments with unstable nuclei using an ion trap, the RI beam is thermalized and stopped in the gas cell, and then extracted as a low-energy radioactive ion beam. In order to quickly and efficiently extract ions from the gas cell, the transport of ions by electric field is effective. The radio- frequency ion guide method using an RF carpet has been widely used for this purpose.
An RF carpet is a type of RF trap that uses a non-uniformity electric field to trap ions. an RF voltage with a phase difference of 180 degrees is applied between adjacent electrodes as shown in Fig. 1.8. Four phase audio frequency (AF) signals are superimposed on the RF signal to produce a traveling wave that can transport ions radially along the carpet. The average force due to the RF electric field gradient formed by this is always directed away from the electrodes. This force acts as a barrier to the electrodes for the ions and they remain above the surface of the carpet. The strength of the ion barrier is determined by the balance between the force of the electrostatic field that pushes the ions toward the carpet and the repulsive force of the RF field that repels the ions.
The motion of an ion of mass m in a gas is determined by following equation
mr¨+ e
µr˙=−e∇Φ(r, t), (1.35)
where µ=µ0P0/P is the mobility of ions, P0 is the atmospheric pressure, µ0 is the mobility of the ions underP0 andΦ is the potential. If we let the relaxation time of velocityτv =v=µm/e, then the equation becomes
m¨r+ 1 τv
˙ r+ e
mΦ = 0. (1.36)
U+Vcos(ωt) -(U+Vcos(ωt)) -(U+Vcos(ωt))
U+Vcos(ωt) 0 r0 x
y
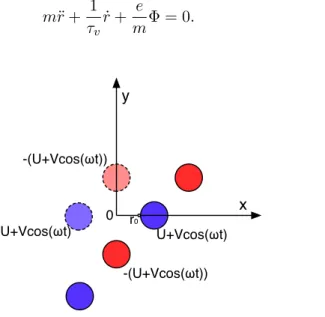
Figure 1.9: Conceptual view of virtual electrodes placed inside an RF ring electrodes.
The RF electric field of an RF carpet can be approximated as an RF quadrupole electric field by placing a virtual electrode inside the ring elec- trode, as shown in Fig. 1.9.
Then, the quadrupole potentialΦ is approximated by
∇ϕ(x, y, z, t) = Φ0(t)
r20 ϕ(x, y, z, t) = Φ0(t)x2−y2
r20 , (1.37) whereΦ0(t) = 2(U +V cosωt),
∇ϕ(x, y, z, t) = Φ0(t) r02
( x
−y )
. (1.38)
The effective electric field is estimated by using the pseudo-potential in the quadrupole field as shown in Fig. 1.9. Divide the motion of an ion into a mean-motion part and a micro-vibration term,
r = r¯+ρ(t) (1.39)
= r¯+cERF(r) cos(ωt+β), (1.40)
where constantc is determined by substituting Eq. (1.40) for (1.36). Thus, micro-vibration term is expressed by
ρ(t) = − e mω
ERF
√ω2+ 1/τv2cos(ωt+β), (1.41) tanβ = 1
τv
. (1.42)
The average force due to the RF electric fieldFis
F¯(¯r) = e⟨ERF(r) cosωt+ [∇|r−r¯ERF(r)]ρ(t) cosωt⟩time average(1.43)
= −∇ERF2 (¯r) e2 4m
1 ω2+ 1/τv2.
For the average force, considering the case of vacuum and the case in gas is
F¯(¯r)=
{ −∇ERF2 (r)¯ 4mωe22 =−e∇Ψpseued ωτv ≫1(Vaccum)
−∇ERF2 (r)¯ 4me2 r2v =−e∇ω2r2vΨpseued ωτv ≪1(Gas). (1.44) The motion of ions due to the RF electric field is determined by the pseudo-potentialΨpseued,
Ψpseued = e
4mω2ERF2 , (1.45)
RF quadrupole field,
ϕ=VRF
x2−y2 r0
, (1.46)
is used to described the electric field, ERF2 = 4VRF2 r2
r02. (1.47)
Thus, the average force due to the RF electric field in the gas can be expressed by
F¯(¯r)=−8VF2 r03
r r0
e2
4mr2v =−2mµ2VRF2 r03
r
r0. (1.48)
From the equation, the closer the ion is to the electrode, the greater the repulsion force is, the more it is pulled away from the electrode. The force acting on the ions for a given RF electric field becomes stronger for heavier ions, and weaker at higher gas pressures. Also, the use of narrowly spaced electrodes is expected to have a significant effect.
Traditionally, the transport of ions at the surface of an RF carpet has been performed by an electrostatic gradient formed by a DC voltage super- imposed on the RF voltage. This limits the ion transport rate and increases the extraction time, which makes it difficult to apply to short-live radioac- tive nuclei. The ion surfing method was developed to solve this problem [30, 31].
Ion surfing methods
The ion surfing method uses a traveling wave electric potential instead of a static potential gradient to transport ions. By superimposing an AF voltage with a phase difference of 90 degrees between neighboring electrodes, a potential traveling wave is formed on the ion barrier as shown in Fig. 1.8.
The ions on the RF carpet are transported in waves by the traveling wave.
The speed of ion transport is determined by the amplitude and speed of the traveling wave, and the speed of the traveling wave is also determined by the frequency of the AF, the number of phases, and the pitch of the electrodes in the RF carpet. If the amplitude of the traveling wave is small, the ions will slip out of the traveling wave and not be transported properly. On the other hand, if the amplitude is large, the traveling wave becomes too deep and some ions are lost due to collision with the carpet electrodes. If the amplitude of the traveling wave is appropriate, the rate of ion transport will coincide with the rate of the traveling wave. The AF signals applied to form the traveling wave at theN electrodes is written as
VAF,i=VAF·cos(ωAF·t+ 2π i
N +ϕAF). (1.49)
The AF amplitude VAF changes in phase by 2π/N between electrodes.
The wavelength of the traveling wave is written as
λ=N ·a, (1.50)
where the angular frequency of the AF voltage be ωAF, the speed of the traveling wave can be expressed by
vwave= 1
2πωAF·λ= N a
2πωAF. (1.51)
Assuming that the potential surface is sinusoidally fluctuating, the am- plitude of the potential traveling wave decreases exponentially with respect to the distance y from the surface of the electrode. The two-dimensional oscillations of theVAF are expressed as Eq. (1.52),
VAF(x, y) =VAF·cos (2π
λ (vwave·t−x) )
e−2π(y/a). (1.52)
1.4.3 RF multipole ion guide
The multipole ion guide technique is used for ion transport and ion trap- ping. By applying radio-frequency signals with a 180-degree phase difference to adjacent electrode rods, the ions are radially confined in an ion guide and their motion is described as oscillations in a pseudo-potential.
In the cylindrical coordinate system (r, θ, z), the potential of a two- dimensional 2N-pole field which is formed by rods (Fig. 1.10, left) which are uniformly distributed along a circle of radius r0 around z-axis with an RF voltage±V cosωtapplied between the adjacent rods is written as
Φ = ϕ0cosωt
= (r
r0
)2
cos(N θ)V cosωt, (1.53) where,
r = r¯+ ¯ρ(t)
= r¯+ρ0cosωt. (1.54)
Then, the equation of motion can be described as
m¨r=−e∇Φ, (1.55) then,
ρ0 = e
mω2∇ϕ0. (1.56)
The average force that ions receive is
F¯(¯r) = −e⟨∇ϕ(¯r) + [∇|r−r¯(∇ϕ0)] ¯ρ(t) cosωt⟩time average (1.57)
= − e2
4mω2∇|∇ϕ20|2.
The ion motion then follows from the pseudopotential Ψpseued = e
4mω2|∇ϕ0(r0)|2, (1.58) then,
Ψpseued = eN2 4mω2
(V r0
)2( r r0
)2(N−1)
. (1.59)
The right side of Fig. 1.10 shows the pseudo-potential forN = 2, 3 and 4 corresponding to quadrupole, sextupole and octupole, respectively.
r -5
-4 -3 -2 -1 0
-1.0 -0.5 0.0 0.5 1.0
N = 2
N = 3
N = 4
z
Figure 1.10: (left) Cross section of a sextupole ion guide within the cylin- drical coordinate system. (right) Pseudo-potential of multipole field with quadrupole (N=2), sextupole (N=3) and octupole (N=4).
1.4.4 RF quadrupole ion trap and mass separator
The potential of the linear quadrupole ion trap can be expressed by
Φ(x, y, z, t) = Φ0(t) = (U −V cosωt)x2−y2
2r20 , (1.60) the equation of motion for the ions of mass m and charge ze in a trap can be expressed by Mathieu’s equation,
d2u
dr2 + (au−qucos 2τ)u= 0, (1.61) whereuindicates each axis. Assuming that the ion is singly charged (q =e), the equation of motion are
d2x dr2 + e
mir2o(U−V cosωt)x= 0, (1.62) d2y
dr2 + e
mir2o(U −V cosωt)y= 0, d2z dr2 = 0,
wheremi is mass of ion,r0 is the distance from center of the ion trap to the rod electrode. The solution to this equation are described,
r= Ωt
2 , ax =−ay = 4zeU
mr02Ω2, qx=−qy = 2zeV
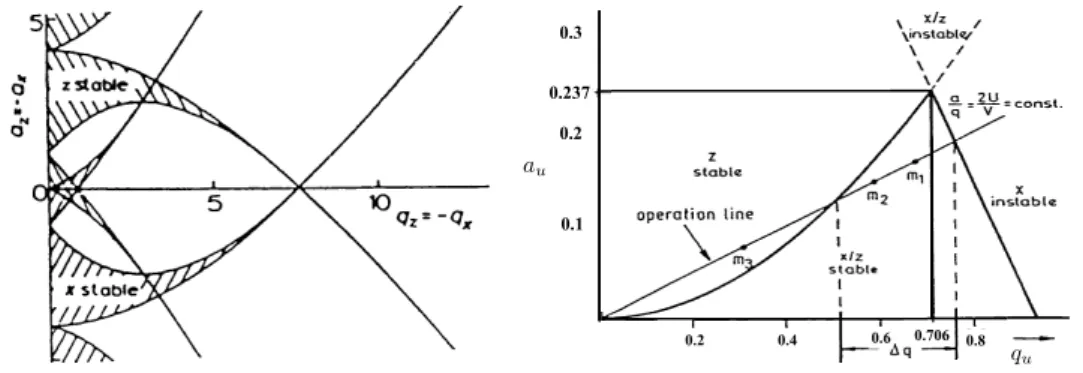
mr02Ω2. (1.63) For a givenU,V, andΩcombination, we obtain a stable region of ions in anym/z range passing through the quadrupole. Figure 1.11 (left) shows a diagram with overlapping stability regions for the motions in the yz- and yz- planes, and a detailed view of the upper half of the first stable region is shown in Fig. 1.11 (right). Ifa/qis set to 0.237/0.706=0.336, their is stable motion in thexy-plane at only one point in the diagram – the vertex. By holdingq constant and decreasinga, i.e. decreasing the ratio ofU toV, the range ofm/z with which ions can pass through the quadrupole at the same time can be increased. In other words, the quadrupole ion trap can be used as a mass filter.
1.3.3 RF quadrupole ion trap and mass separator Because the potential can be expressed by
(x, y, z, t) = 0(t) = (U Vcos!t)x2 y2
2r20 (1.19)
the equation of motion of an ion with mass m and charge ze in the trap can be expressed by the Mathieu’s equation
d2u
d⌧2+ (au qucos 2⌧)u= 0 (1.20)
whereu indicatesxory and
⌧ = ⌦t
2, ax= ay= 4zeU
mr20⌦2, qx= qy= 2zeV
mr20⌦2 . (1.21)
W.Paul 605
By comparison with equation (4) one gets
63) The Mathieu equation has two types of solution.
1. stable motion: the particles oscillate in the x-z-plane with limited amplitudes.
They pass the quadrupole field in y-direction without hitting the electrodes.
Figure 2. The overall stability diagram for the two-dimensional quadrupole field.
0.3
0.23 0.2 at 0.1
Figure 3. The lowest region for simultaneous stability in x-and z-direction. All ion masses lie on the operation line, m1 > m1.
qu
au 0.1 0.2 0.237
0.3
0.2 0.4 0.6 0.706 0.8
Figure 1.3: (left) The overall stability diagram for the two-dimensional quadrupole field. (right) The lowest region for simultaneous stability inx- and z-direction.
From the solution of Eq. (1.20) [27], the stable condition of the ion motion characterized by au
andqu are described onau-qu plane as shown in Fig. 1.3(left). The stable region that contains the points (au, qu) = (0,0) is often called the lowest stability region. The traps relevant for the experiments discussed here work inside this lowest stable region withau⇡0, while when used as a quadrupole mass separator (QMS), the parameterauis set near the tip of the stability diagram (au, qu) = (0.237,0.706).
A mass range which satisfies the stable condition corresponding tom1 and m2 in Fig. 1.3 can pass through the QMS, otherwise the motion becomes unstable and hitting to the rods corresponding to m1andm2 in Fig. 1.3.
1.4 Mass measurement techniques for exotic nuclei
Masses are one of the most important static properties of nuclei. Since the earliest measurements of Aston, it has been known that ratios of atomic masses among the various nuclei deviate slightly from integer ratios. Today, by application of Einstein’s famous equationE=mc2, we know this is due to the binding energy required to hold the nucleus together. Thus, by measuring atomic masses we can infer nuclear binding energies. In general, we divide the various methods used to determine atomic masses in two categories: direct measurements and indirect measurements as shown in Fig. 1.4.
1.4.1 Indirect mass measurement
Indirect mass measurements involve the determination ofQ-values of nuclear reactions or radioactive decays as shown in Fig. 1.4. Various types of reactions have been used to determine masses both near
Figure 1.11: (left) The stability diagram for the two-dimensional quadrupole field. (right) The first stable region of diagram for the quadrupole field.
29
![Figure 1.12: Schematic view of the MRTOF-MS at FAIR/GSI. This figure is taken from [65].](https://thumb-ap.123doks.com/thumbv2/123deta/9785609.1868898/42.892.232.665.204.624/figure-schematic-view-mrtof-fair-gsi-figure-taken.webp)
![Figure 1.19: Schematic view of SHE-Mass facility. This figure taken from [71].](https://thumb-ap.123doks.com/thumbv2/123deta/9785609.1868898/44.892.277.618.241.699/figure-schematic-view-mass-facility-figure-taken.webp)