Market Reactions to Optimistic Recommendations
of Chaebol-Affiliated Analysts
journal or
publication title
International review of business
number
11
page range
41-63
year
2011-03
Market Reactions to Optimistic Recommendations of
Chaebol-Affiliated Analysts
Junghee LEE*
Abstract
This study examines the market’s reactions to unexpected recommendation revisions made by chaebol-affiliated analysts.
It also provides evidence on investors’ perception of analyst optimism when the issuing analysts and the subject company belong to the same chaebol. Conflict of interests generated by chaebol-affiliated analysts’ duty to serve the interests of their affiliated chaebols and their duty to serve the interests of investors forms the basis of the testable hypotheses that examine (1) affiliated analysts’ optimism in their research reports and (2) market reactions to optimistic recommendations made by affiliated analysts.
To test preliminary consideration whether there is the difference between chaebol-affiliated and unaffiliated analysts’ optimism, I perform t-test on pairs of affiliated and unaffiliated analysts’ earnings forecast bias and recommendations, respectively. The results of preliminary test show that affiliated analysts issue more optimistic earnings forecasts and recommendations for their chaebol firms than their unaffiliated counterparts.
To estimate the incremental returns associated with affiliated analysts, I use the three-day market-adjusted cumulative abnormal return (CAR) centered on the revision date. I provide evidence on information content of affiliated analysts’ unexpected revisions, indicating that affiliated analysts convey incremental information to investors.
Overall, the findings suggests that, although affiliated analysts are generally optimistic about their chaebol firms, investors still rely on the information provided by the affiliated analysts in the course of making investment decisions for chaebol affiliates.
Keywords: financial analyst, business group, herding behavior in earnings forecasts
1. Introduction
The independence of financial analysts is essential for analyst research reports and provides the basis for public trust. Accordingly, the tasks of information-gathering and dissemination should be led by the analysts’ independent eye, not by other interests that might undermine the professional integrity of their work. Several researchers argue that underwriter analysts are more likely to compromise the objectivity of their research reports in the interest
of their investment banking operations (Dugar and Nathan 1995; Lin and McNichols 1998; Dechow et al. 2000; O’Brien et al. 2005; Li et al. 2005).
Regulators, academics, and market participants have became skeptical about the integrity and quality of analyst research due to the possible conflict of interest between analysts’ fiduciary duty to investors and their relationships with investment banking clients. A recent settlement involving ten of the largest Wall Street investment banks and the issuance of favorable stock research to attract new investment banking clients have clearly exposed the conflict that analysts face.1 The spotlight on the conflicts of interest that affect analysts’ research has led to calls for empirical studies to investigate whether investment banking deals influence analyst earnings forecasts and recommendations.
Some of Korean business groups, known as chaebols, have their affiliated securities firms (chaebol securities firm, hereafter).2 I categorize an analyst as ‘affiliated’ analyst when the analyst’ securities firm and a subject firm belong to the same chaebols, and otherwise as ‘unaffiliated’ analyst.
Affiliated analysts employed by chaebol securities firms in Korea would have conflicts of interests generated by their duty to serve the interests of their affiliated chaebols and their duty to serve the interests of investors. While investment banking relationship between a securities firm and its client firm is built on a short-term basis for financial services, chaebols and their affiliated securities firms have maintained their affiliations for an extended period of time.
The conflict of interests addresses several issues on the quality of affiliated analyst research reports and the market reaction to affiliated analysts compared to their unaffiliated counterparts; do affiliated analysts issue overly optimistic earnings forecasts and recommendations when their securities firm and subject companies belong to the same chaebol?; and do investors place a premium on affiliated analysts’ recommendations because they presume that affiliated analysts possess more relevant information than unaffiliated analysts?, or do they discount the validity of those affiliated analysts’ recommendations because they are skeptical about the objectivity of affiliated analysts’ reports?
This paper examines the market’s reaction to unexpected recommendation revisions made by affiliated analysts to provide evidence on investors’ perception about chaebol-affiliated analysts. The analysis begins by preliminary consideration of the difference between affiliated
1 See http://www.sec.gov/news/press/2003-54.htm: “The firms are also required to comply with
significant requirements that reform their future practices, including separating the research and investment banking departments at the firms, how research is reviewed and supervised, and making independent research available to investors.”
2 See Section 2 for more information on chaebols and chaebol securities firm. Chaebols are allowed to
own securities firms if the total debt to asset ratio at a chaebol level is less than 200%. See the Table 1 for the list of chaebols that have affiliated securities firms.
and unaffiliated analysts’ optimism, which provides justification for the main test of the market’s reactions to systematic optimism of affiliated analysts’ recommendations.
For the preliminary test, I hypothesize that analysts issue overly optimistic earnings forecasts and recommendations when the subject company and issuing analysts belong to the same chaebol (H1). The rational behind this is that financial and managerial tie within a chaebol induce affiliated analysts to issue optimistic earnings forecasts and recommendations relative to their unaffiliated counterparts.
The definite hypothesis is that unexpected recommendation revisions (unexpected revisions, hereafter) issued by affiliated analysts convey incremental information to investors (H2). If investors presume affiliated analysts to possess chaebol inside information to which unaffiliated analysts do not have equal access, then they may place a premium on the affiliated analyst recommendations and quickly incorporate them into the firm’s current asset price. Therefore, the stock market should react positively to affiliated analysts’ recommendations.
Using 1,934 pairs of earrings forecasts and 1,773 pairs of recommendations issued for 57 chaebol affiliated companies from 2001-2005, I find that earnings forecasts and recommendations issued by affiliated analysts are more optimistic than those issued by unaffiliated analysts. In additional test, I investigate the factors that could affect the different levels of analyst optimism observed between affiliated and unaffiliated analysts. Evidence shows that the difference of analyst optimism between affiliated and unaffiliated analysts decreases with the standard deviations of stock price and firm leverage, but increases with firms’ ROA.
The result of testing of the market reactions shows that on average the stock markets react positively to affiliated analysts’ unexpected revisions. The finding implies that investors generally incorporate unexpected revision by affiliated analysts into their valuation of the subject firms.
Overall, the findings suggest that although affiliated analysts are generally optimistic about the companies that belong to the same chaebols, investors find the information released by affiliated analysts to be credible and relevant incremental to any unexpected new information.
This study yields new insights into conflict of interest when the subject company and the issuing analysts are affiliated with the same chaebol. Therefore, it develops awareness of analyst optimism in the context of chaebols and their affiliated securities firms, and identifies investors’ perception of systematic optimism of affiliated analysts.
The paper proceeds as follows: Section 2 describes the background on chaebols and chaebol securities firms in Korea. Section 3 reviews the prior research on analysts’ conflict of interests. In Section 4, I develop testable hypotheses. Section 5 describes the data and sample
selection. Section 6 describes the research designs and empirical test results. I then provide the conclusion in the final section.
2. Background on Korean Business Groups (Chaebols) 2.1 Chaebols
Although business groups are observed all over the world, distinctive differences exist across nations in their ownership and management structure.3 For example, chaebol is generally controlled by the founding families, while the Japanese version of business groups (keiretsu) is controlled by groups of professional managers and connected by a common bank.4
The founding family owners of chaebols, typically serving as the CEO and Chairman of the Board in the core business, exercise managerial influence over their affiliated firms. Cuervo-Cazurra (2006) studies various types of business group based on their ownership, and addresses that owners in family-owned business groups have great control over managers and thus maintain effective corporate governance. Prior research on chaebol document that chaebols take the form of a multidivisional organizational structure in that a legally independent firm works as a sub-division under centralized control (Chang and Choi 1988; Chang and Hong 2000; Hwang and Kang 2007). Chang and Hong (2000) also find that resource sharing and business transactions within a chaebol create operating synergy and thus contribute to economic performance of chaebols.
Several prior studies conducted with data on chaebols before the Asian Financial Crisis in 1997 (the AFC, hereafter) provide evidence on diversification of the chaebols. Shin and Park (1999) document that an internal capital market within a chaebol facilitates debt financing through cross-payment guarantees. Ferris et al. (2003) find that the costs that are incurred by over-investing in underperforming member firms exceed the benefits from debt capacity and lower tax burdens. Lang and Stulz (1994) and Laeven and Levine (2007) provide consistent evidence of diversification discount of conglomerates. Berger and Ofek (1995) find that any value loss from diversification is attributable to overinvestment and cross-subsidization within a conglomerate.
The AFC had profound effects on the chaebols, forcing 11 of the nation’s top 30 chaebols to collapse between 1997 and 1999. The large concentration of credit risk on the troubled chaebol and their affiliated companies led to widespread distress and economic recession in late 1990s. In response to the AFC, the Korean government and the Financial Supervisory Service (FSS) initiated corporate sector restructuring and, particularly, developed a better
3 For the review of business groups and their type, see Cuervo-Cazurra (2006).
4 Although the keiretsu still exist, their alliances have been loosened by the impact of the Japanese
economic system to secure transparency and fairness among chaebols. For example, the FSS adopted the so-called combined financial statement standards, unique to Korea due to the
special importance of chaebol in the Korean economy.5 The surviving chaebols also
undertook restructuring programs including debt reduction, asset sales and the selling-off or liquidation of business units. The business environment around chaebols also has been changed since the AFC. The process of normalizing the relationship between the government and the business community loosened government intervention. Commercial banks and the government no longer channeled funds to the chaebols, leaving most chaebols searching for additional financing from external sources.
Despite the intensive restructuring processes, chaebols have been unwilling to loosen their control over their chaebol-affiliated firms. Chang (2006a, 2006b) documents that in spite of enhanced corporate governance and tightened capital market supervision following the AFC, most business groups in Korea remain intact showing the robustness of the business group structure. Hwang and Kang (2007) examine the information content of combined financial statement, and provide evidence that price variability as well as trading volume at announcement in not significant. They conclude that combined financial statement is not a useful information source to investors.
2.2 Chaebol Securities Firms
What is the driving force behind this chaebol ownership of securities firm? A chaebol securities firm takes an active role in ‘circuitous investment’ by which chaebol owner can govern the entire chaebul network without a majority of the chaebol equity. The term circuitous investment refers to a pattern of investment where at least three affiliated firms within a chaebol are involved in equity investment. Suppose a core firm at which the chaebol owner serves as CEO participates in equity investment of its securities firm with a handful share holding. Then, the securities firm invests in multiple affiliated companies within the chaebol, being a major shareholder. As results, chaebols not only expand their businesses, but also maintain control over their business fleets with small shares of equity holdings. Chang ad Hong (2000) document that business group’s financial arms, such as insurance and securities companies, enhance the internal capital market and, likewise, are induced to function as a financial division, coordinating cross-subsidization within a chaebol.
Overall, it is reasonable to predict that chaebol securities firm is under pressure from chaebol chairman’s office to sacrifice its objectivity for the benefit of the chaebol as a whole.
5 Under the standards for the consolidated financial statements, an affiliate that is not a subsidiary of
another affiliate is excluded from consolidation, even though it is under the common control of the chaebol. Consequently, consolidated financial statements are unable to present the whole financial condition of a chaebol in Korea.
3. Literature Review on Analysts’ Conflict of Interest
A number of empirical research studies analyst bias or optimism in the context of investment banking relationships. Dugar and Nathan (1995) provide evidence that analysts of the lead underwriting firms issue more optimistic earnings forecasts and recommendations for their existing investment banking clients than non-investment bank analysts. Lin and McNichols (1998) find that long-term growth forecasts and recommendations issued by underwriter analysts are more optimistic than those by independent analysts. However, the three-day returns associated with underwriter ‘hold’ recommendations are significantly more negative than those associated with non-underwriter. Michaely and Womack (1999) find that long-run post-recommendation stock performance of firms that are recommended by their underwriters is significantly worse than the performance of firms recommended by other securities firms. Michaely and Womack (1999) examine market returns of IPOs surrounding buy recommendations made by underwriter versus non-underwriter analysts to analyze price reactions to recommendation announcements, pre-recommendation price performance, and post-recommendation price performance in a sample of IPO firms during 1990-1991. They interpret the finding to mean that analysts may provide a booster shot by increasing the strength of their recommendation to curry favor with poorly performing underwritten firms. Findings of Li et al. (2005) provide consistent evidence that analysts employed by underwriting securities firms issue more optimistic earnings forecasts following an issuance of equity. O’Brien et al. (2005) suggest that analysts have incentives to issue good news promptly, but are slow concerning bad news for their investment banking clients.
There is evidence that analysts belonging to firms with investment banking operations issue positive research in order to help their firms win the lucrative investment banking deals in future equity offerings (Bradley et al. 2003; Clarke et al. 2006; McNichols et al. 2006).
On the other hand, prior researches argue that analysts at independent securities firms in the absence of investment banking operations also have incentive to issue positive research to trigger higher trading volume, resulting in greater commissions (Agrawal and Chen 2004; Cowen et al. 2006). Cowen et al. (2006) find that analysts at full-service investment banks that fund their analyst research through both underwriting and brokerage services issue less optimistic forecasts and recommendations than those at securities firms that fund their analysts only by trading commissions. Those studies imply that analysts at high-status investment banks attract their underwriting clients through their reputations, not solely by their optimistic reports.6
6 They also provide evidence, to a lesser degree, that securities firms focusing on retail trading provide
low-quality research to retail investors either because the lower quality analyst research is more cost effective to retail investors, or because recent industry changes make it hard to charge retail investors for research.
Jeong et al. (2006) present evidence that earnings forecasts issued by chaebol affiliated analysts are more optimistic but less accurate than those by unaffiliated analysts. For recommendations, they find that recommendations made by affiliated analysts are favorable relative to those by unaffiliated analysts. With the extended sample of chaebol and non-chaebol firms, they additionally find that affiliated analysts issue more optimistic earnings forecasts and recommendations for their chaebol firms than non-chaebol firms. Consistently, Lim and Jung (2008) find that affiliated analysts’ forecasts are less accurate but more optimistic than those issued by unaffiliated analysts. However, no prior research that studies the characteristics of chaebol-affiliated analysts relative to those of unaffiliated analysts has directly tested market reactions to analyst recommendations in the context of analyst affiliation with chaebols.
4. Hypothesis Development
4.1 Analyst Optimism: Earnings Forecasts and Investment Recommendations by Affiliated versus Unaffiliated Analysts
The chaebol network can be viewed as a single large conglomerate that gives its owner emperor-like control over their business units (Chang and Choi 1988; Chang and Hong 2000). chaebol securities firm equivalent to financial division in a conglomerate coordinates the circuitous investment between its affiliated companies and directly engages in active trading of equity. Consequently, the failure of one affiliated firm within a chaebol puts the other affiliates that participate in circuitous investment system at risk. Under such circumstances, affiliated analysts have great incentives to issue optimistic research reports for their affiliated companies and, hence, induce the equity trading of those companies at a higher value.
The scenario becomes more realistic when a new venture, such as a firm joining a chaebol, or a large project by one of chaebol affiliates seeks external financing. Due to the lack of information about a new venture or uncertainty related to new project, the market struggles to obtain such information. A chaebol securities firm plays a leading role in signaling the optimistic perspective to market by disseminating optimistic earnings forecasts and recommendations. The rational assumption behind this is that that the market presumes that affiliated analysts have greater access to the proprietary information about the venture or the project under the control of their chaebol.
Collectively, I predict that affiliated analysts issue more optimistic earnings forecasts and recommendations about their chaebol affiliated companies than unaffiliated analysts.7 This leads to the first hypothesis which is stated in the alternative as follows:
H1: Analyst earnings forecasts and recommendations for chaebol affiliated
companies are more optimistic when they are issued by same chaebol affiliated analysts than unaffiliated analysts.
4.2 Market Reactions to Affiliated and Unaffiliated Analysts’ Recommendations
To develop the hypothesis on market reactions to optimistic recommendations by affiliated analysts, I discuss two competing scenarios based on investors’ perception of affiliated analysts.
If investors believe that a chaebol chairman’s office has induced its affiliated analysts to adjust research reports, then they show skepticism about the objectivity of affiliated analyst research reports. Those investors who distrust the overstated favorableness of affiliated analysts are likely to place less weight on the value of recommendations issued by affiliated analysts. Consistent evidence is provided by prior studies that investors discount the information value of underwriter analysts’ recommendations due to their relationship with investment banking operations (i.e., Dechow et al. 2000; Michaely and Womack 1999).
On the other hand, the circumstance under which chaebol firms are tightly interconnected through resource sharing and internal transactions enables affiliated analysts to have access to chaebol inside information to which unaffiliated analysts do not have equal access. Given the information asymmetry between affiliated and unaffiliated analysts, investors presume affiliated analysts’ announcement to be credible and relevant than unaffiliated analysts, and then quickly incorporate it into the subject firm’s current asset price. The scenario indicates that investors place a premium on affiliated analysts’ recommendations.
In sum, it is an empirical question how inventors perceive affiliated analysts’ optimistic recommendations. Nevertheless, given that affiliated analysts have a greater access to their affiliated companies than unaffiliated analysts, the more positive the unexpected recommendation, the larger the stock market’s reaction to the new recommendation. This leads to the second hypothesis, stated in the alternative:
H2: The unexpected recommendation revisions are significant in the stock
market’s reaction when they are issued by same chaebol affiliated analysts.
I employ ‘unexpected recommendation revision’ to capture the incremental returns associated with affiliated analysts relative to those associated with unaffiliated analysts.
5. Data and Sample Selection
Data on analysts’ earnings forecasts, analysts’ recommendations, and stock price for the companies in the sample are obtained from the Fn-guide database. The Fn-guide database
provides analyst forecast data from 33 securities firms operated in Korea since 2001. The additional test of the determinants of the difference in earnings forecast optimism requires data on chaebol owner(s)’s shares of all affiliated companies of his/her chaebol and a subject firm’s shares of its affiliated securities firm, and firm data that are used for control variables. These ownership-related data are hand-collected from the TS2000 database and other individual firm data are obtained from the Fn-guide database.
To identify chaebols and their affiliated companies, I retrieve the Listed Firm Directory provided by the Korea Stock Exchange (KSE) and used the annual report of business groups provided by the Korea Fair Trade Commission (KFTC). Table 1 reports the chaebols and chaebol affiliated companies included in the sample, where chaebol should have its own securities firm. There are seven chaebols that are identified to have their own securities firms between 2001 and 2005. The fifty seven chaebol-affiliated firms for which annual earnings forecasts are available on the guide database, are included in my sample of firms. The Fn-guide database provides analyst earnings forecasts and recommendations from 33 securities firms operated in Korea since 2001. Among the total 33 securities firms that made earnings forecasts for the sample of firms, the seven securities firms are affiliated with chaebols.
To be included in the sample, the firm must satisfy the following criteria: (i) the firm should belong to one of the chaebols that are identified by the KFTC; (ii) the chaebol to which the firm belongs must own an affiliated securities firm; (iii) the firm was listed on the KSE at least once between 2001 and 2005; (iv) the firm should have analyst earnings forecast and recommendation issued by both affiliated and unaffiliated analysts.8
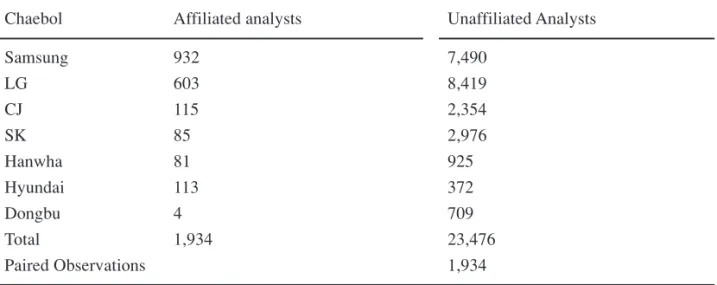
Table 2 presents the frequency distribution of earnings forecasts and recommendations over all affiliated companies in the sample of firms. These numbers include both the multiple analyst reports released by the identical analyst throughout a year, i.e., forecast revisions, and those by the different analysts from the same securities firm. In particular, the differences of total earnings forecasts and recommendations between affiliated and unaffiliated analysts amount to more than 10 times. This is accounted for by the fact that for a particular subject company, analysts from one securities firm are classified as ‘affiliated’ while the rest of other securities firms are classified as ‘unaffiliated’ analysts.
Table 2, Panel B presents the distribution of recommendations made by affiliated and unaffiliated analysts, respectively, for each chaebol. The data indicate that affiliated analysts issue proportionately more ‘buy’ recommendations at about 67.8% of the recommendations
8 Any change in chaebol securities firms caused by merge and acquisitions or any change in listing status
caused by chaebol affiliated companies that were newly listed or de-listed during the test period is presented in parentheses in Table 1. Particularly, LG Securities firm under the LG group was merged to Woori Investment & Securities in April, 2005. LG Securities firm is consistently regarded as chaebol securities firm during the test period of 2001 to 2005 because it practically operated under the control of LG group until the end of 2005.
Table 1: Chaebols that own securities firms and their affiliated companies
Chaebol Chaebol Securities Firm Chaebol Affiliated Companies
Samsung Samsung securities Samsung Heavy Industries, Cheil Communications, Cheil Industries, Samsung Fine Chemicals, Samsung Techwin, Samsung Corporation, Samsung SDI, Samsung Electro-mechanics, Samsung Electronics, S1 Corporation, Samsung Engineering, Samsung Fire & Marine Insurance, The Shilla Hotels & Resorts
LG LG securities† LG, GS E&C, LG International, LG Petrochem, Dacom Corporation, LG Life Sciences, LG Micron, LS Industrial Systems, LS Cable, LG Household & Healthcare, Yesco, GS Home Shopping, LG Chem, LG Electronics, LG Telecom, LG. Philips LCD , GS, E1
CJ CJ Securities CJ, CJ Home Shopping, CJ Internet, CJ Food System, CJ CGV
SK SK securities SK, SK Gas, SK Networks, SKC, SK Telecom, SK E&S, SK Chemicals, Daehan City Gas, SK Chemicals
Hanwha Hanwha securities Hanhwa, Hanhwa Chemical
Hyndai Hyundai securities, Hyundai Merchant Marine, Hyundai Elevator, Hyundai Prudential securities‡ Mipo Dockyard (2001), Hyundai Corporation
(2001-2002)
Dongbu Dongbu securities Dongbu Steel, Dongbu Electronics, Dongbu Fine Chemicals, Dongbu Corporation, Dongbu Hitek, Dongbu Insurance
† Currently, it is merged into Woori Investment and Securities,
Panel A. Frequency distribution of earnings forecasts Total number of earnings forecasts
Chaebol Affiliated analysts Unaffiliated Analysts
Samsung 932 7,490 LG 603 8,419 CJ 115 2,354 SK 85 2,976 Hanwha 81 925 Hyundai 113 372 Dongbu 4 709 Total 1,934 23,476 Paired Observations 1,934
Panel B. Frequency distribution of stock recommendations Total Number of Recommendations
Chaebol Affiliated Analysts Total Unaffiliated Analysts Total
BUY HOLD SELL BUY HOLD SELL
Samsung 571 307 0 878 5,502 2,822 21 8,345 LG 369 155 0 524 5,867 3,849 171 9,887 CJ 95 18 0 113 2,122 1,114 5 3,241 SK 74 11 0 85 2,530 1,237 7 3,774 Hanwha 49 0 0 49 836 375 0 1,211 Hyundai 43 76 1 120 189 343 59 591 Dongbu 1 3 0 4 433 514 40 987 Total 1,202 570 1 1,773 17,479 10,254 303 28,036 67.8% 32.1% 0.0% 100% 62.3% 36.6% 1.1% 100% Paired Observations 1,773
they issued, compared to 62.3% made by unaffiliated analysts. About 32.1% of the recommendations issued by affiliated analysts are ‘hold’ compared to 36.6% by unaffiliated analysts. Interestingly, about 0.0% (1.1%) of the recommendations issued by affiliated (unaffiliated) analysts are sells, which indicates that the affiliated analysts’ recommendations hardly fall below a ‘Hold’ compared with those of unaffiliated analysts. This affiliated analysts’ avoidance of unfavorable recommendations implies their unwillingness to issue investment opinions unfavorable to their chaebol-affiliates.9
The paired observations shown in panel A and panel B of Table 2 are the final samples of earnings forecasts and recommendations, respectively, to be used for testing H1.10 As I explain earlier in this section, earnings forecasts or recommendations issued by unaffiliated analysts are greater than those by affiliated analysts. Therefore, the unaffiliated analyst’s forecast or recommendation issued most closely to the date of affiliated analyst’s forecast was included in the paired observations. After matching data from two groups of analysts, the final pairs are 1,934 pairs of earrings forecasts and 1,773 pairs of recommendations.
6. Research Design and Empirical Results
6.1 Differences between affiliated and unaffiliated analysts’ earnings forecast and recommendations
To examine whether affiliated analysts are more likely to issue optimistic forecasts than their unaffiliated counterparts, the statistical significance of the difference of analyst optimism between affiliated and unaffiliated analysts’ earnings forecasts is tested. Analyst i’s forecast optimism for firm j in year t is calculated using the following formula:
, where Forecasti j t denotes an individual analyst i’s forecasted EPS, and AtualEPS j, t is the
EPS realization for firm j in year t. Price j, t is the year-end stock price. For recommendations,
I use a three-point scale with values ranging from an ‘Sell’ of 1 to a ‘Buy’ of 3 in which the higher score indicates the more favorable opinion.11
9 Lack of ‘Sell’ recommendations may be explained by analyst self-selection bias ; analysts are more
likely to drop coverage than issue negative recommendations when the previously covered companies performs badly. Such matter as could not be the source of difference between affiliated and unaffiliated analysts is not a research problem for this study because it is common to both affiliated and unaffiliated analysts.
10 Information about sample selection procedure for market reaction testing (H2) is provided in section 6.2
and table 5.
11 Only 15 of the 31,948 recommendations (raw data) from Fn-guide database carry an ‘Strong sell’
recommendation. ‘Strong Buy’ recommendations for the sample firms are rarer still from the database. Therefore, those two recommendations are excluded from the analysis.
(Forecasti, j, t – AtualEPS j, t)
price j, t
Following the matching methods that are used by Lin and McNichols (1998) and Li et al. (2005), I perform t-test on pairs of affiliated and unaffiliated analysts’ earnings forecast bias and recommendations, respectively.12 I match Optimism of affiliated analyst’s earnings forecast with Optimism of unaffiliated analyst’s earnings forecast on the date closest to the affiliated analyst’s forecast date; likewise with recommendations.13 The matching approach, therefore, controls for firm-specific characteristics that could affect analyst optimism. The t-statistic tests the null hypothesis that the differences in analyst optimism between two types of analysts are greater than zero; likewise with recommendations. The probability value is taken from paired t-test:
For a individual subject company at a given year, X1 is the mean earnings forecasts of
affiliated analysts, X2 is the mean earnings forecasts of unaffiliated analysts, and S is the variance. The denominator is the pooled standard error of the difference between two categories of analysts, where n1 is the size of affiliated analysts, n2 is the size of unaffiliated analysts, s1 is the variance of affiliated analysts, and s2 is the variance of unaffiliated analysts. If the mean earnings forecasts issued by affiliated analysts are more optimistic than unaffiliated analysts’ forecasts, the average difference will be significantly greater than zero; likewise with recommendations.
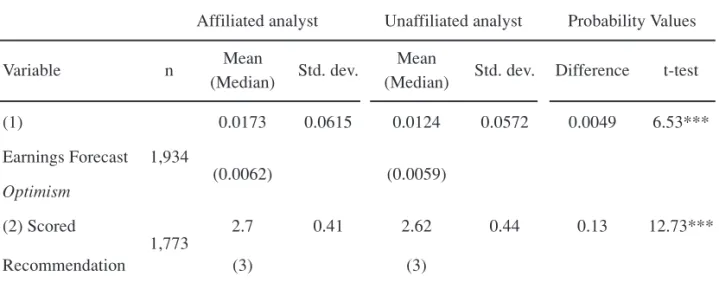
Table 3 presents the t-test results of testing H1 using 1,934 pairs of earnings forecasts and 1,773 pairs of recommendations issued for 57 chaebol affiliated companies. The mean value of affiliated analyst’s forecast optimism is 1.73% of the price, while the mean of unaffiliated counterparts is 1.24% of the price. The mean difference between the two groups of analysts is significantly different from zero at a probability value less than 0.0001 with a t-value of 6.53. The finding indicates that affiliated analysts issue more optimistic earnings forecasts for the companies that belong to their chaebol than unaffiliated analysts. Using a sample of 1,773 pairs of recommendations, the mean scored recommendation released by affiliated analysts is significantly greater than the mean from unaffiliated analysts by 0.13 in terms of the three-point scale at a probability value less than 0.0001. Since the higher score indicates the more favorable opinion, this result presents evidence that affiliated analysts make more favorable recommendations for their chaebol companies than unaffiliated analysts.
12 The study analyzes matched data with a t-teat for two reasons. First, what matters in a paired t-test is the
consistency of the differences between group means. Second, it does not matter how much scatter each group has.
13 When more than one unaffiliated forecast or recommendation was made on the day closest to the
affiliated observation date, the mean of those made by unaffiliated analysts was used for an unaffiliated observation.
In sum, Table 3 indicates that affiliated analysts issue more optimistic earnings forecasts and investment recommendations for their chaebol companies than unaffiliated analysts. These results are consistent with the findings by prior research in the chaebol context (Jeong et al. 2006; Lim and Jeong 2008) that affiliated analysts issue more optimistic earnings forecasts and recommendation for their chaebol firms. The finding is also consistent with prior research that suggests investment banking relationships may result in the underwriter analysts’ optimism. (Dugar and Nathan 1995; Lin and McNichols 1998; Dechow et al. 2000; O’Brien et al. 2005; Li et al. 2005).
To assess the robustness of the findings to another component of analyst research reports, relative optimism in price forecasts is also examined. The find shows that affiliated analysts project a year-end stock price 18% higher than the actual stock price, compared to 17% by unaffiliated analysts (not presented in table). Overall, I can conclude that affiliated analysts tend to issue more optimistic research reports than unaffiliated analysts.
6.2 Market Reaction to ‘Unexpected Recommendation Revisions’
6.2.1 Empirical Approach
The primary purpose of this study is to examine whether unexpected revisions released by affiliated analysts convey incremental information to investors. More specifically, this study focuses on the initial market reaction associated with ‘unexpected revision’ (UnExpREV).
Affiliated analyst Unaffiliated analyst Probability Values
Variable n Mean Std. dev. Mean Std. dev. Difference t-test (Median) (Median) (1) 0.0173 0.0615 0.0124 0.0572 0.0049 6.53*** Earnings Forecast 1,934 (0.0062) (0.0059) Optimism (2) Scored 2.7 0.41 2.62 0.44 0.13 12.73*** 1,773 Recommendation (3) (3)
Table 3: Difference in analyst optimism between affiliated and unaffiliated analysts with respect to (1) earnings forecast and (2) recommendations for chaebol-affiliated companies
UnExpREV is defined as an unexpected recommendation revision that is different from what investors expect to be issued by analysts from a particular securities firm. UnExpREV, therefore, requires a benchmark that indicates the expected recommendation. Expected recommendation revision (ExpREV), is defined as a recommendation that investors expect to be issued by analysts from a particular securities firm, based on their observation of the analyst’s previous actions. The variable, UnExpREV, is measured using the following equation:
UnExpREV i, j = Revision i, j – ExpREV i, j (1)
where Revision i,j is the scored recommendation revised by analyst i for firm j, and ExpREV i,j
is the 3-month average of scored recommendations issued by the analysts from the same securities firm which analyst i belongs to prior to the announcement of analyst i.14 In another words, UnExpREV is the difference between the scored recommendation released by analyst i and the previous three-month average score of the analysts from the same securities firm as analyst i. UnExpREV is transformed from the stock ratings of distinct recommendations (i.e. buy, hold, sell), and has continuous value which reflects the extent to which the revised recommendation is different from market expectation for a specific analyst. The measure of UnExpREV is, therefore, useful to overcome the problem in evaluating market reactions with a limited number of recommendation level.
Analysts are reluctant to trigger negative signal to investors’ perspective on their chaebol affiliated companies. Consequently, analysts generally use ‘buy’ or ‘hold’ ratings, which further reduce stock rating available in the sample.15 Overall, this approach to the analysis is pertinent to the setting of the study.
I measure the market reactions to UnExpREV released by affiliated and unaffiliated analysts with the three-day market-adjusted cumulative abnormal return (CAR) centered on the revision date.16
(2)
14 The rationale behind this is that consensus forecast, a simple mean of analysts’ earnings forecasts, is
used as a proxy for market expectation of earnings (Scharfstein and Stein, 1990; Stickel, 1990, 1992; Trueman, 1990, 1994; Graham, 1999). The artificial cutoff day should not be problematic. Mean of scored recommendations for 3, 6, 9, and 12 months are used to estimate expected recommendations. The results for each estimates remain the same.
15 As presented in Panel B of table 2, almost two-third of the analyst recommendations is ‘buy’ and the rest
of them is ‘hold’.
16 In order to analyze the initial market reactions, the study measures returns for a three-day period
surrounding analysts’ recommendation revisions because many times news leaks out before the public announcement and the market is slow to fully reflect the effects of the event into the stock price.
CAR (–1, +1)ijt =
Σ
ARjtt=1 t=–1
CAR (–1, +1)i, j,t is defined as sum of abnormal returns for three days (–1, +1), where t=0 is
the recommendation revision date issued by analyst i for security j. ARjt denotes the abnormal
return on security j, measured as the return on security j issued by analyst i less the average return for the KSE index on day t.
To examine the information content of unexpected revisions by affiliated analysts (H2), I develop the following regression model based on the model of Lin and McNichols (1998):
CAR (–1,+1)i, j, t = · + ‚1 UnExpREV i, j + ‚2 UnExpREV i, j x CHi, j (3)
, where CAR (–1, +1)ijt is the cumulative abnormal returns for three days (–1, +1), as described in equation (2). UnExpREV i,j is unexpected revision by any analysts as described in equation (1). CHi,j takes on a value of 1 if the analyst i is affiliated with subject company j and 0
otherwise. Note that the sample is composed of chaebol affiliated companies. Therefore, I do not include CHi,j,t as a single term.
I predict that UnExpREV and UnExpREV x CH have positive coefficients. The rationale behind this is that a revision that exceeds or falls short of investors’ expectation provides more pertinent information to be utilized in investors’ decision making process than other expected revisions.
6.2.2 Results
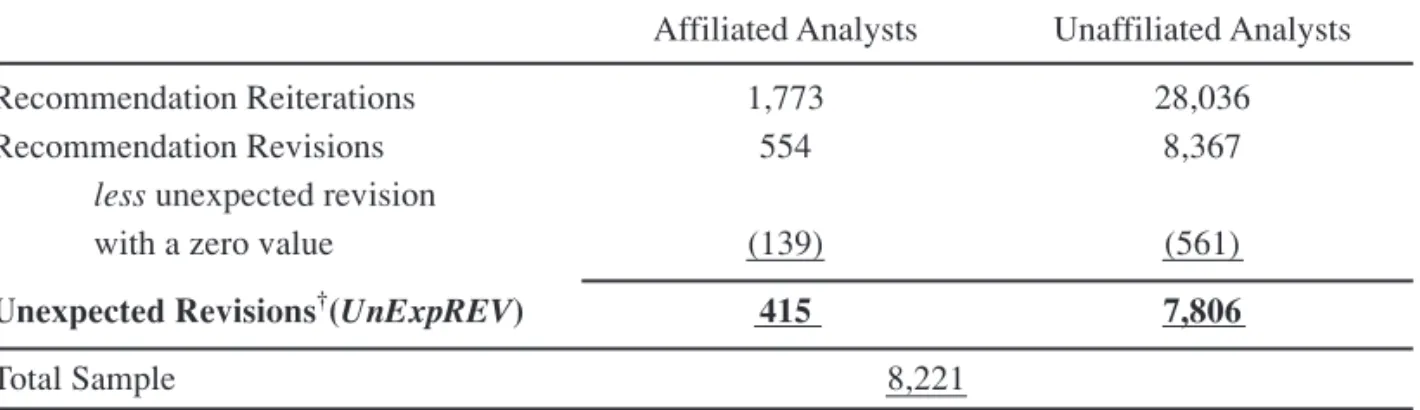
Table 4 reports information of the sample for testing H2. Of the initial sample of 1,773 (28,036) recommendations issued by affiliated (unaffiliated) analysts, which is shown in panel B of Table 2, 554(8,367) recommendations represent revisions issued by affiliated (unaffiliated) analysts. I excluded from the sample any revision that has a zero value in unexpected revision.
Table 4: Distributions of recommendation, revisions, and unexpected revisions : Sample information (for testing H2)
Affiliated Analysts Unaffiliated Analysts Recommendation Reiterations 1,773 28,036
Recommendation Revisions 554 8,367
less unexpected revision
with a zero value (139) (561)
Unexpected Revisions†(UnExpREV) 415 7,806
Total Sample 8,221
† The final sample for this analysis consists of unexpected recommendation revisions (UnExpREV) released by affiliated and
To avoid confounding effects on stock returns, I excluded any revision that is released within 3days before and after earnings forecast announcement. When a recommendation revision by either an affiliated or unaffiliated analyst occurs on overlapping days, both are excluded. As a result, the final sample for testing H2 consists of 415 unexpected revisions by affiliated and 7,806 unexpected revisions by unaffiliated analysts (total 8,221 revisions) that meet the operational definition of unexpected revisions.
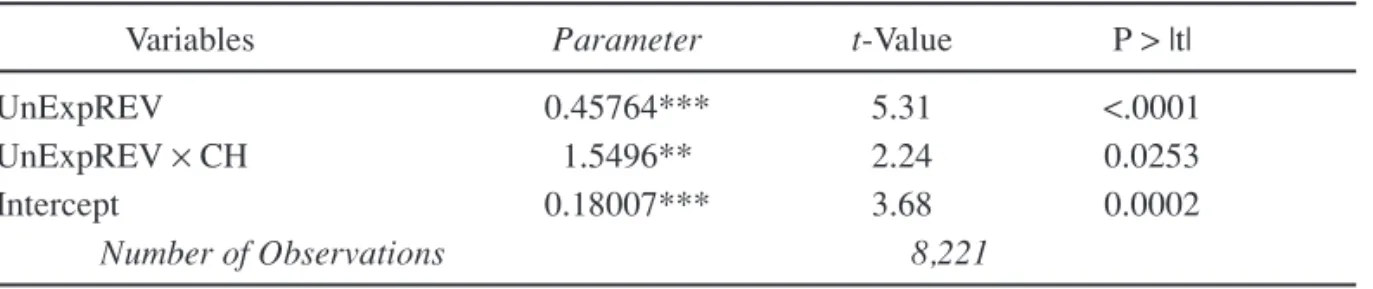
Table 5 summarizes the analysis of the market’s reaction to unexpected revisions using equation 3; stock returns measured over a three-day window centered on unexpected revision date are regressed on unexpected revision by any analysts and those by affiliated analysts. The significantly positive coefficient, ‚1 indicates that investors perceive unexpected recommendation revisions in general as informative and credible. The estimated coefficient ‚2 on the interaction term (UnExpREV i,j × CH i,j) is significantly positive with a t-value of
2.24, indicating that the larger (more positive) the unexpected revision by affiliated analysts the larger the market’s reaction to the revision. In particular, the coefficient, ‚2, that is greater than ‚1, reflects the incremental explanatory power of unexpected revision released by affiliated analysts relative to those released by all analysts. This finding suggests that investors believe information released by affiliated analysts that is deviated from market expectation for those affiliated analysts to be relevant to their investment decision. Overall, the result supports H2 that unexpected revisions by affiliated analysts are significant in the stock market’s reaction when they are issued by same chaebol affiliated analysts.
6.3 Determinants of the difference of analyst optimism between affiliated and unaffiliated analysts’ earnings forecasts (Additional Analysis)
Based on the result of testing H1 that earnings forecasts by affiliated analysts are more
CAR (–1,+1)i,j,t = · + ‚1 UnExpREV i,j + ‚2 UnExpREV i,j× CHi,j (3)
Variables Parameter t-Value P > |t|
UnExpREV 0.45764*** 5.31 <.0001
UnExpREV × CH 1.5496** 2.24 0.0253
Intercept 0.18007*** 3.68 0.0002
Number of Observations 8,221
Table 5: Market reaction to unexpected recommendation revisions by affiliated and unaffiliated analysts
optimistic than those by unaffiliated analysts, additional test is designed to investigate the factors that affect the different levels of analyst optimism observed between affiliated and unaffiliated analysts. I employ the following regression model:
DIF_OPTIMISM : Difference between pairs of affiliated and unaffiliated analysts’ earnings forecast, respectively, deflated by the subject company’s year-end share price.
CH_OWN : Sum of the subject firm’s shares held by the affiliated companies of the same chaebol, divided by the total shares of outstanding.
SECbyCH : Sum of the issuing securities firm’ shares held by the affiliated companies of the same chaebol as the subject company, divided by the total shares of outstanding.
FORGN : Foreign investors’ shares of the subject company’s shares divided by the total shares of outstanding.
RVOL : Volatility of the subject company’s daily stock return that is calculated as the standard deviation of the company’s stock return.
SIZE : Natural logarithm of market value of the subject company’s equity.
LEV : Total liability divided by total asset.
ROA : Annual earnings divided by its total assets (Return on assets)
NAF : Number of analysts covering the subject company’s in a particular firm-year.
The research variables of interest are two variables used as proxies for chaebol ownership structure in terms of market share. First, CH_OWN is used as a proxy for a subject company’s tie to its chaebol. If the coefficient ‚1 is significantly positive, it indicates that the ownership percentage of a subject firm held by the same chaebol is positively related to affiliated analysts optimism relative to unaffiliated analysts. Second, SECbyCH is used as a proxy for the forecasting securities firm’s tie to its chaebol. If the coefficient ‚2 is significantly positive, it indicates that chaebols’ equity holdings of their chaebol securities firms is positively related to the discrepancy of optimism between the two groups of analysts increases with.
I include firm-specific variables that are found to be associated with forecast characteristics (Lim 2001, Ahn et al. 2005). Since the effect of control variables are empirical issue, I do not predict signs of the coefficients in this regression model. FORGN is used as a proxy for a level of the outside shareholders’ monitoring. RVOL controls for the subject DIF_OPTIMISM=‚0+ ‚1 CH_OWN + ‚2 SECbyCH + ‚3 FORGN + ‚4 RVOL
company’s predictability and persistence for future earnings. SIZE controls for the subject company’s information environment (Atiase, 1987; Das et al., 1998; Lim, 2001). LEV controls for financial risk in the estimation of firm’s systematic risk. ROA controls for firm’s
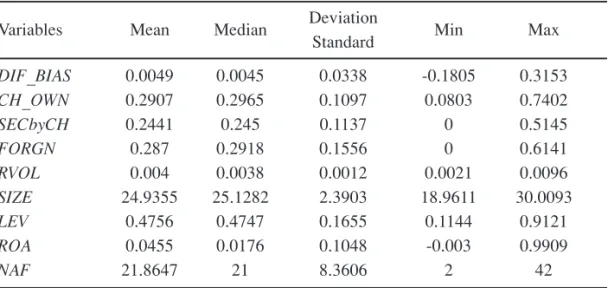
Panel A: Descriptive Statistics
Deviation Variables Mean Median
Standard Min Max
DIF_BIAS 0.0049 0.0045 0.0338 -0.1805 0.3153 CH_OWN 0.2907 0.2965 0.1097 0.0803 0.7402 SECbyCH 0.2441 0.245 0.1137 0 0.5145 FORGN 0.287 0.2918 0.1556 0 0.6141 RVOL 0.004 0.0038 0.0012 0.0021 0.0096 SIZE 24.9355 25.1282 2.3903 18.9611 30.0093 LEV 0.4756 0.4747 0.1655 0.1144 0.9121 ROA 0.0455 0.0176 0.1048 -0.003 0.9909 NAF 21.8647 21 8.3606 2 42
Panel B: OLS Regression Results
DIF_BIAS=‚0+‚1 CH_OWN +‚2 SECbyCH + ‚3 FORGN +‚4 RVOL + ‚5 SIZE+ ‚6 LEV + ‚7 ROA+ ‚8 NAF + Year_Dummies (Firm fixed effects are controlled)
Estimate t-Value P> |t| CH_OWN .0003 0.02 .9876 SECbyCH .0135 1.35 .1786 FORGN -.0001 -1.03 .3029 RVOL -3.2158 -2.2** 0.0283 SIZE -0.0029 -1.29 0.1957 LEV -0.02416 -1.84* 0.0655 ROA 0.1327 3.15*** 0.0017 NAF 0.0002 0.99 0.3209 Intercept 0.1104 1.85* 0.0651
Year Dummies include
Adjusted R-Square 17% Number of Observations 1,225
Table 6: Determinants of the difference of earnings forecast optimism between affiliated and unaffiliated analysts
profitability. NAF controls for analyst effort to gather information about a subject firm (Barth et al., 2001). Table 6, Panel A presents the summary statistics of variables for a sample of 1,225 observations to be used in the regression. The mean value of DIF_OPTIMISM is 0.45% of the stock price. CH_OWN has a mean value of 0.29, indicating that 29% of the subject firm’s equity shares are on average held by the same chaebol-affiliated companies. The mean value of SECbyCH, 0.24, indicates that 24% of the issuing chaebol securities firm’s equity shares are held by the same chaebol-affiliated companies. The correlations between DIF_OPTIMISM and the explanatory variables are relatively low, ranging from 0.04 to -0.10, eliminating a significant issue on multicollinearity in the multiple regressions (not shown in table).
Table 6, Panel B reports the result of the OLS regression of DIF_OPTIMISM on chaebol-related ownerships and firm characteristics for a sample of 1,225 observations. The coefficients on CH_OWN and SECbyCH variables are insignificantly different from zero. In other words, there is no systematic association between the difference in forecast optimism and chaebol’s portion of ownership of a subject company or ownership of affiliated securities firm. This finding suggests that controlling shareholders of a chaebol would pressure their affiliated analysts to be optimistic about their affiliated companies without holding substantial stakes in their affiliated companies. The significantly negative coefficients on RVOL and LEV indicate that the difference between affiliated and unaffiliated analysts’ forecast optimism decreases with predictability and persistence for future earnings and financial risk, respectively. To a lesser degree, the negative coefficient on FORGN (at a t-value of -1.03) suggests that the difference in forecast optimism decreases with outside shareholders’ monitoring. The positively significant coefficient on ROA suggests that affiliated analysts are more optimistic for firms with a greater profitability than their unaffiliated counterparts. However, I find no significant relationship between DIF_OPTIMISM and SIZE.
7. Conclusion
This paper preliminarily examines affiliated and unaffiliated analysts’ earnings forecasts and recommendations for a sample of 57 chaebol affiliated companies. Consistent with the findings of prior research in the Korean market context, I find that affiliated analysts issue more optimistic earnings forecasts and recommendations than their unaffiliated counterparts (i.e., Jeong et al. 2006; Li et al. 2005; Lim and Jung. 2008). Based on the result from preliminary test, I examine whether the unexpected revisions released by affiliated analysts have information content. I provide evidence on incremental market reactions to affiliated analysts’ unexpected revisions. The implication of this finding is that investors are not likely to discount affiliated analysts’ recommendations due to analysts’ affiliation with subject companies. Rather, they believe unexpected recommendation made by affiliated analysts to be
pertinent information to be utilized in investors’ decision making process.
Overall, the findings suggest that despite optimistic research reports issued by affiliated analysts for their chaebol affiliates, investors still rely on the information released by affiliated analysts.
The result of additional test do not show systematic relation between earnings forecast optimism and equity holdings across affiliated companies of the same chaebol. This finding implies that chaebol can influence its affiliated analysts without holding a substantial stakes in either its affiliated securities firm or its affiliated companies. A possible explanation for this can be an unobservable custom of long standing in chaebols. For example, individual affiliated companies work cooperatively with each other in order to create and maintain brand value of their own chaebol.17
The questions addressed in this paper are relevant to regulators and researchers who are concerned about conflict of interest due to analyst affiliations. It is beyond the scope of the research whether the observed optimism of affiliated analysts may be resulted from conflict of interests or driven by a true change in analysts’ belief about the stock’s intrinsic value relative to its current market value, leaving it for future research. The evidence on market reactions to affiliated analysts, therefore, may be interpreted to mean that investors are unaware of the conflict of interest that may have an undesirable effect on their investment decisions. Although the KFTC and the FSS have achieved a remarkable success in implementing chaebol regulation, they need to reinforce the Chinese wall between chaebol securities firms and chaebol affiliated companies to prevent leaks of corporate inside information between the corporate and securities firm that belong to the same chaebol.18
References
Affleck-Graves, J., L. Davis, and R. Mendenhall. 1990. Forecasts of earnings per share: Possible sources of analyst superiority and bias. Contemporary Accounting Research Vol. 6: pp. 501-517.
Agrawal, A. and M. Chen 2004. Do analyst conflicts matter? Evidence from stock recommendations. Working Paper. University of Alabama and University of Maryland.
Ahn, Y., H. Shin, and J. Chang. 2005. The Impact of R&D Expenditures On Financial Analysts’ Forecast Accuracy and Forecast Demands. Korean Accounting Review Vol. 30 No. 2: 1-23. [Printed in Korean] Atiase R.K. 1987. Market implications of predisclosure information: size and exchange effects. Journal of
17 I ignore such questions regarding unobservable factors, leaving them for future research.
18 Chinese Wall, the concept of separation of investment banking from brokerage operations, was
embraced by the securities industry regulators (i.e. the United States Congress, the Securities And Exchange Commission, and the National Association of Securities Dealers). The wall is not physical boundary, but rather an ethical one that exists to prevent leaks of corporate inside information between different divisions of financial institution.
Account Research, Vol. 25: 168-176.
Barth, M., R. Kasznik, and M. McNichols. 2001. Analyst coverage and intangible assets. Journal of Accounting Research Vol. 39:1-34.
Berger, P. and E. Ofek 1995. Diversification’s effect on firm value. Journal of Financial Economics Vol. 37: 39-65.
Bradley, D.J., B.D. Jordan, and J.R. Ritter. 2003. The quiet period goes out with a Bang. Journal of Finance Vol. 58, 1-36.
Chang, S. J. 2006a. Business Groups in East Asia: Financial Crisis, Restructuring and New Growth Oxford. Oxford University Press.
Chang, S. J. 2006b. Business groups in East Asia: Post-crisis restructuring and new growth. Asia Pacific Journal of Management Vol. 23: 407-417.
Chang S. J. and U. Choi. 1988. Strategy, structure and performance of Korean business groups: A transactions cost approach. Journal of Industrial Economics Vol. 37: 141-158.
Chang, S. J. and J. Hong. 2000. Economic performance of group-affiliated firms in Korea: Intragroup resource sharing and internal business transactions. Academy of Management Journal Vol. 43: 429-448. Clarke, J., S. Ferris, N. Jayaraman, and J. Lee. 2006. Are analyst recommendations biased? Evidence from
corporate bankruptcies. Journal of Financial and Quantitative Analysis Vol. 41: 169-196.
Cowen A., B. Groysberg, and P. Healy. 2006. Which types of analyst firms are more optimistic? Journal of Accounting and Economics Vol. 41: 119-146.
Cuervo-Cazurra. 2006. Business groups and their types. Asia Pacific Journal of Management Vol. 23: 419-437.
Das, S., C. Levine, and K. Sivaramakrishnan 1998. Earnings predictability and bias in analysts’ earnings forecasts. Accounting Review Vol. 73: 277-294.
Dechow, P., A. Hutton, and R. Sloan 2000. The relation between analysts’ forecasts of long term growth and stock price performance following equity offerings. Contemporary Accounting Research Vol.17: 1-32. Dugar, A., and S. Nathan. 1995. The effects of investment banking relationships on financial analysts’
earnings forecasts and investment recommendations. Contemporary Accounting Research Vol. 12: 131-160.
Ferris, S., K. Kim, and P. Kitsabunnarat. 2003. The costs and benefits? of diversified business groups: The case of Korean chaebols. Journal of Banking and Finance Vol. 27: 251-273.
Hwang, I.T. and S.M. Kang. 2007. The Information Content Of Combined Financial Statement For Firms Within The Chaebol. Korean Accounting Review Vol. 32 No. 2: 177-207. [Printed In Korean]
Jeong, S. W., J. B. Kim, and T. K. Lim. 2006. The association between analysts’ earnings forecasts and stock recommendations, and the business group affiliation of analysts and forecasted firms. Korea Accounting and Auditing Research Vol. 44: 27-54. [Printed in Korean]
and survival. Journal of Accounting Research Vol. 44: 965-1000.
Lang, L. and R. Stulz. 1994. Tobin’s q, corporate diversification, and firm performance. Journal of Political Economy Vol. 102: 1248-1280.
Laeven L. and R. Levine. 2007. Is there a diversification discount in financial conglomerates? Journal of Financial Economics Vol. 85: 331-367.
Li, M., H. Shin, and J. Chang. 2005. A study on analysts’ conflict of interests. Korean Accounting Review Vol. 30: 173-194. [Printed in Korean]
Lim, T. 2001. Rationality and analysts’ forecast bias. Journal of Finance Vol. 56: 369-385.
Lim, K. M. and S.B. Cho. 2007. Research on inter-subsidiary business transactions among affiliates of Korean business groups Seoul: Korea Development Institute
Lim Y. and K. Jung. 2008. Does the short distance between analyst and company enhance analyst forecast accuracy? Evidence from group analysts in Korea. Working paper Korea Advanced Institute of Science and Technology.
Lin, H., and M. McNichols. 1998. Underwriting relationships, analysts’ earnings forecasts and investment recommendations. Journal of Accounting and Economics Vol. 25: 101-128.
McNichols, M., P. C. O’Brien, and O. M. Pamukcu. 2006. That ship has sailed: Unaffiliated analysts’ recommendation performance for IPO firms. Working paper. Stanford University.
Michaely, R., and K. L. Womack. 1999.Conflicts of interest and the credibility of underwriter analyst recommendations. Review of Financial Studies Vol. 12: 653-686.
O’Brien P. C., M. McNichols, and H. Lin. 2005. Analyst impartiality and investment banking relationships. Journal of Accounting Research Vol. 43: 623-254.
Sedor, L. M. 2002. An explanation for unintentional optimism in analysts’ earnings forecasts. Accounting Review Vol. 77: 731-753.
Shin, H. H. and Y. S. Park. 1999. Financing constraints and internal capital markets: Evidence from Korean chaebols. Journal of Corporate Finance Vol. 5: 169-191.