Improvement of Cell Performance in Low-Pt-Loading Cathode
Catalyst Layers Prepared by the Electrospray Method for Polymer
Electrolyte Fuel Cells (PEFCs)
A Doctoral Thesis
Presented to the
Interdisciplinary Graduate School of Medicine and Engineering
University of Yamanashi
March 2017
Contents
Chapter 1 General Introduction
1.1 Background ... - 1 -
1.2 Polymer electrolyte fuel cells (PEFCs) ... - 2 -
1.3 Parameters for PEFC performance ... - 5 -
1.4 Current status for the improvement of PEFCs ... - 8 -
1.5 The mechanism of the electrospray (ES) method ... - 9 -
1.6 Objective of Research ... - 11 -
1.7 References ... 12
-Chapter 2 Mode Variation of the ES Method with Pt/GCB or Pt/Ta-SnO2 2.1 Introduction ... - 15 -
2.2 Experimental ... - 15 -
2.2.1 Preparation of the catalyst ink with Pt/GCB ... - 15 -
2.2.2 Preparation of the catalyst ink with Pt/Ta-SnO2 ... - 16 -
2.2.3 Setting parameters of the ES method ... - 17 -
2.3 Result and discussion ... - 17 -
2.3.1 The mode changes of ES method with Pt/GCB ... - 17 -
2.3.2 Mode changes of ES method with Pt/Ta-SnO2 ... - 21 -
2.5 References ... 26
-Chapter 3 Improvement of Cell Performance in Low-Pt-Loading Cathode CLs with Pt/GCB Prepared by the ES method. 3.1 Introduction ... - 27 -
3.2 Experimental ... - 28 -
3.2.1 Preparation of the catalyst ink ... - 28 -
3.2.2 ES method ... - 28 -
3.2.3 Pulse-swirl-spray method ... - 29 -
3.2.3 Preparation and evaluation of the CLs fabricated by PSS or ES methods ... - 31 -
3.2.4 Evaluation of fuel cell performances ... - 32 -
3.3 Result and discussion ... - 33 -
3.3.1 Construction of CLs ... - 33 -
3.3.2 Microstructure of CLs prepared by PSS and ES methods ... - 35 -
3.3.3 Performance of the cathodes fabricated by the PSS and ES methods. ... - 39 -
3.4 Conclusions. ... - 46 -
3.5 References ... 47
-Chapter 4 Improvement of Cell Performance in Low-Pt-Loading Cathode Catalyst Layers with Pt/Ta-SnO2 Prepared by the ES method. 4.1 Introduction ... - 49 -
4.2 Experimental ... - 50 -
4.2.2 Preparation of CLs by the pulse-swirl-spray and ES methods ... - 50 -
4.2.3 Evaluation of the fuel cell performance ... - 52 -
4.3 Result and discussion ... - 53 -
4.3.1 Construction of CLs ... - 53 -
4.3.2 Morphology comparison of CLs with PSS I/S = 0.7, ES I/S = 0.7 and ES I/S = 0.2 ... - 55 -
4.3.3 Cell performance comparison of PSS I/S = 0.7, ES I/S = 0.7 and ES I/S = 0.2. ... - 62 -
4.4 Conclusions ... - 70 -
4.5 References ... 71
-Chapter 5 General conclution 5.1 Conclusions ... - 73 -
5.2 Future prospects ... - 75 -
List of publications ... - 76 -
Meeting abstracts ... - 76 -
- 1 -
Chapter 1
General Introduction
1.1 Background
Our life has become comfortable due to a lifestyle based on large-scale production and consumption, which has relied on fossil fuels. The consumption of fossil fuels has increased in the world year by year, and this tendency is expected to continue into the future. However, the amount of fossil fuels is limited, and the enormous amount of fossil fuel consumption has caused serious environmental pollution and global warming. In addition, the accident at the Fukushima nuclear plant in Japan in 2011 shocked the whole world. Thus, many people began to seek safer, more highly efficient, and sustainable energy resources, and researchers around the world have been developing
technology on alternative power sources to possibly replace combustion engines and on alternative fuels for solving these crises. Fuel cells have the potential to meet this demand. Fuel cells are electrochemical devices that directly convert chemical energy to electrical energy by means of the electrochemical reaction of oxygen and hydrogen fuel, and produce only water during generation of electricity. Their efficiency is able to reach as high as 60% in electrical energy conversion because of the lack of influence of the Carnot cycle. Fuel cells are able to suppress major pollutants by more than 90% compared with conventional approaches [1]. Fuel cells can mainly classified into five types by electrolyte: (1) alkaline fuel cells (AFCs), (2) phosphoric acid fuel cells (PAFCs), (3) molten carbonate fuel cells (MCFCs) (4) solid oxide fuel cells (SOFCs) and (5) polymer electrolyte membrane fuel cells (PEMFCs or PEFCs). Among these, the PEFCs have advantages, e.g., short
- 2 -
warm-up time and high specific power. Therefore, investigations have become active recently for cogeneration systems and vehicles. In Japan, commercial cogeneration devices, called ENEFARMs, are being produced by several companies. The total number of device sales reached 10,000 in 2016. Prototype fuel cell vehicles (FCVs) are being produced by several car companies. Toyota Motor Corporation sold the first commercial FCV in the world in 2014, Honda Motor Co., Ltd. also sold commercial FCVs in 2015. Products with PEFCs are anticipated to be developed even further from now on.
1.2 Polymer electrolyte fuel cells (PEFCs)
A schematic diagram of a PEFC is shown in Fig. 1-1. The PEFC consists of a membrane-electrode-assembly (MEA) and two gas diffusion layers (GDLs) sandwiching the MEA. The electrode reactions and total cell reaction are shown as follows:
Anode reaction : H2 → 2H+ + 2e- (Eq. 1-1)
Cathode reaction : 1/2O2 + 2H +
+ 2e- → H2O (Eq. 1-2)
Cell reaction : H2 + 1/2O2 → H2O (Eq. 1-3)
The hydrogen enters the anode compartment and diffuses into the gas diffusion layer in the anode catalyst layer (CL). When hydrogen is oxidized at the anode CL, protons and electrons are generated. The protons go through the electrolyte, which is an ion-conductive polymer membrane, and the electrons go through the external circuit. On the other hand, the oxygen enters the cathode compartment and diffuses into the cathode gas diffusion layer into the cathode CL. The oxygen reacts with protons and electrons at the cathode CL to form water. The water is discharged out of the cathode CL through the cathode gas diffusion layer.
- 3 -
The PEFC single cell components are shown in Fig. 1-2. The single cell consists of the MEA, gasket, conductive separators (usually made of graphite or metal), current collectors and endplates. The electron conductive separators are equipped with gas flow channels such as single-, multi-serpentine or parallel channels [2-4]. The MEA and gaskets are sandwiched by two separators and, then, constricted with two endplates. In commercial PEFCs, several tens of single cells are stacked in series in practical usage to obtain useful voltages.
- 4 -
Fig. 1-1 Schematic diagram of an MEA.
- 5 - 1.3 Parameters for PEFC performance
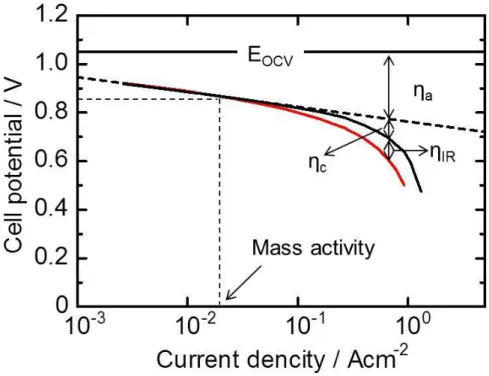
The cell potential (E) depends on the driven current density (I), and varies as shown in Fig. 1-3. When a current density is not driven (termed open-circuit voltage, OCV), the E achieves a theoretical value of 1.23 V. However, the OCV of a practical cell decreases from 1.23 V, because hydrogen goes through the electrolyte membrane to the cathode (termed a cross-leak of hydrogen), and E becomes nearly 1.0 V. When current density is driven, several types of resistances affect E. The resistances can be separated into an anodic polarization resistance and a cathodic polarization resistance, which are related by Ohm’s Law to the anodic overpotential (ηA) and cathodic overpotential (ηc), and the ohmic (IR) loss. The anodic overpotential and cathodic overpotential consist of activation overpotential and concentration overpotential components. The anodic overpotentials are negligible when hydrogen is used as fuel due to fast kinetics of the hydrogen oxidation reaction on the catalyst and the high diffusivity of hydrogen. Therefore, the cathodic activation overpotential (ηcact) and the cathodic concentration overpotential (η
c
conc) and IR loss
mainly affect the cell performance. The ηcact and ηcconc are generally dominated by catalytic activity for the ORR and mass transport (protons, electron and oxygen) in the cathode, respectively.
The ηcact for the ORR in an acidic environment at the Pt cathode is large, due to the slow kinetics of the ORR. The mass activity (MA) of a catalyst in acid electrolyte solutions for the ORR is defined as follows:
MA [A g-1] = js [A m-2] × ECA [m2 gPt -1
] (Eq. 1-4)
where, js is the specific activity (current density per active surface area) for the ORR, which has been reported to be enhanced by Pt alloyed with various metals [5-8]. ECA is the electrochemically active surface area, which is calculated from the electrical quantity of charge for hydrogen adsorption from
- 6 -
the cyclic voltammogram. In order to increase the ECA, the catalyst should exist as small particles, and a narrow size distribution and uniform binder distribution on the catalyst are necessary.
The ηcconc generally increases with an insufficient gas supply and is also affected by the dissipation of the product water in the cathode. Therefore, the suppression of the ηcconc can be affected by a hydrophobization treatment of the microporous layer (MPL) [9, 10] and the gas-diffusion layer (GDL) [11, 12], or an increase of the porosity or pore diameter in the GDL [13,14]. In addition, gas flow field designs and operation conditions (cell temperature, gas flow rate and backpressure) have been investigated [9].
The IR loss corresponds to the ohmic resistance of the electrode, electrolytes and separators. When the IR resistance is measured as a high frequency resistance (HFR), the proton transport resistance in the electrolyte membrane is dominant. In order to decrease the membrane resistance, the improvement of proton conductivity and the decrease of membrane thickness are desirable.
- 7 -
- 8 - 1.4 Current status for the improvement of PEFCs
PEFCs have many advantages for electric power generation but also have several problems that need to be solved. One of the problems is the reduction of the PEFC component cost. The catalysts are mainly based on Pt and are used for the hydrogen oxidation reaction on the anode and the oxygen reduction reaction on the cathode. While hydrogen oxidation over platinum is intrinsically very fast, oxygen reduction over platinum is very slow. In fact, the exchange current density of hydrogen oxidation on platinum is almost three orders of magnitude higher than that of oxygen reduction [15,16]. Therefore, many researchers have focused on the development of catalysts for the ORR such as new Pt alloy catalysts, or the control of particle size and Pt-Pt particle distance [17-19]. Our group evaluated the practical utilization of Pt under operating conditions, finding that the effectiveness of Pt was only on the order of 7.5% in air at 65 oC under 0.1 MPa [20]. In order to increase the effectiveness of Pt, we found the relationship of the effectiveness with catalyst layer (CL) thickness and Pt alloy catalyst [21,22]. In particular, the mass activity of the CL was increased by reducing the Pt loading amount in the CL to about 0.05 mg cm-2. However, it was also found that a new preparation method, which can construct a uniform layer, is necessary to improve the performance of the thin CLs with micrometer-order thickness. The CLs are usually fabricated from a catalyst ink, which includes the Pt catalyst on a support material, an ionomer binder and a dispersant solvent. Then, several researchers have reported the use of inkjet [23], electrospinning [24] and electrospray (ES) [25, 26] methods to fabricate CLs with low Pt loading amounts. In the case of the ES method, micrometer-sized droplets of the catalyst ink can be prepared. The ES method is driven by the electric field between the ejector needle and the substrate, which ejects the ink. The mechanism of
- 9 - 1.5 The mechanism of the electrospray (ES) method
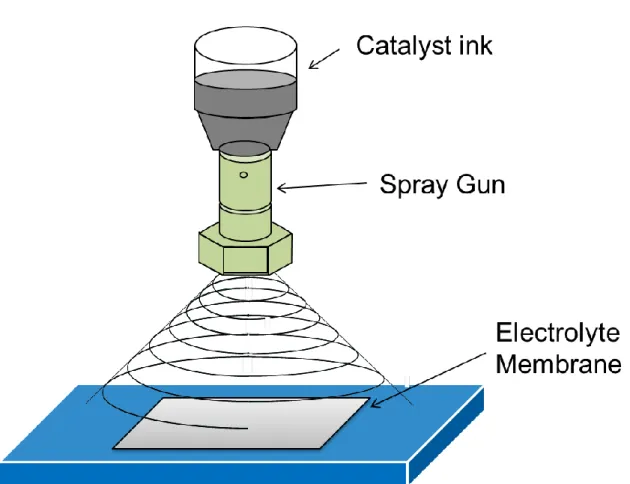
A schematic drawing of the ES method is shown in Fig. 1-4a. The device consists of a capillary nozzle(SNA-28G-B, SNA-27G-B, SNA-26G-B, Musashi Engineering, Inc.), usually made from a fine hypodermic needle, and an extractor electrode plate with a single perforation. Usually, the
capillary nozzle is connected to a high-voltage supply, while the perforated electrode plate and electrically conductive substrate are grounded. The capillary nozzle is equipped with an ink reservoir containing the catalyst ink which mixed catalyst on support material, ionomer binder and solvent. The capillary nozzle is positioned above the hot substrate, and an electrolyte membrane is placed on the substrate. A high voltage supply (610E, Trek Japan Co., Ltd.) is connected between electrodes, which are fitted into the capillary nozzle (positive), and the substrate (negative). By controlling the electrostatic fields around the nozzle, the ES method can vary the form of the ink ejected from the tip of the nozzle. One of the forms is called a Taylor cone, which is a conically shaped ink meniscus. The mode with formation of a Taylor cone is called the cone-jet mode [27, 28]. In the cone-jet mode, the droplets are electrically charged and are dispersed by electrostatic repulsion. Therefore, the droplets are ejected by electrostatic repulsion with uniform small droplets to micrometer order size. (Fig. 1-4b) [29-31].
- 10 -
Fig. 1-4 (a) Schematic drawing of electrospray (ES) process; (b) stages of
microparticle and nanoparticle production by ES.
- 11 - 1.6 Objective of Research
Several researchers have worked to develop the fabrication method of the low Pt loading CL by the ES method. Chaparro et al. succeeded in the preparation of a CL from a Pt catalyst supported on carbon black by ES and obtained superior performance for a cell with a Pt loading of 0.17 mg cm-2 [32]. Benıtez et al. showed superior performance compared to that obtained by spray coating [33]. Martin et al. reduced the Pt loading of a CL to 0.012 mg cm-2 by the ES method [34]. These results indicated that the ES method has potential to improve the cell performance while reducing the Pt loading amount. However, the fabrication of the low Pt loading CL for the ES method has just begun to be investigated, and the information of the stable ejection of the ink or the analysis of the morphology concerning cell performance are still lacking. Therefore, in order to form CLs by the ES method, the discharge stability of ink using different catalyst support materials were improved, and the relationship between cell performance and morphology of the CL was investigated.
In Chapter 2, the ink with Pt supported on carbon black (CB) or Pt supported on cation-doped metal oxidewere found toeject the ink stably. In Chapter 3, I fabricated a low Pt loading amount CL with Pt on CB by the ES method, and by the pulse-swirl-spray (PSS) method. The morphology of the CL for the ES method and PSS method were evaluated, and the cell performances of CLs for the ES method and PSS method were compared. In Chapter 4, low Pt loading CLs by the ES method with the cation-doped metal oxide were prepared. This investigation made use of two inks with different mass ratios of Nafion binder to SnO2 support (I/S). The cell performances and CL morphology were
evaluated. In Chapter 5, the general conclusions and future plan from the results of Chapters 2, 3 and 4 are summarized.
- 12 - 1.7 References
[1] Papageorgopoulos D. DOE fuel cell technology program overview and introduction to the 2010 fuel cell pre-solicitation workshop in DOE fuel cell pre-solicitation workshop. Department of Energy, Lakewood, Colorado; 2010.
[2] Kumar, R. G. Reddy, J. Power Sources, 114, 54, 2003
[3] E. Hontanon, M.J. Escudero, C. Bautista, P.L. Garcıa-Ybarra, L. Daza, J. Power Sources, 86, 363, 2000
[4] X. Li, I. Sabir, Int. J. Hydrogen Energy, 30, 359 , (2005)
[5] S. Mukerjee, S. Srinivasan, M. P. Soriaga and J. McBreen, J. Electrochem. Soc. 142, 1409, 1995
[6] T. Toda, H. Igarashi, H. Uchida and M. Watanabe, J. Electrochem. Soc. 146, 3750, 1999 [7] S. Mukerjee and S. Srinivasan, J. Electrochem. Soc., 357, 201, 1993
[8] E. Antolini, R. R. Passos and E. A. Ticianelli, Electrochem. Acta. 48, 263, 2002
[9] H. Li, Y. Tang, Z. Wang, Z. Shi, S. Wu, D. Song, J. Zhang, K. Fatih, J. Zhang, H. Wang, Z. Liu, R. Abouatallah and A. Mazza, J. Power Sources, 178, 103, (2008)
[10] S. Park, J.-W. Lee, B. N. PopovInt, J. Hydrogen Energy, 37, 5850, (2012)
[11] J. H. Chun, K. T. Park, D. H. Jo, J. Y. Lee, S. G. Kim, S. H. Park, E. S. Lee, J.-Y. Jyoung and S. H. Kim, J. Hydrogen Energy, 36, 8422, (2011)
[12] S. Hirakata, M. Hara, K. Kakinuma, M. Uchida, D. A. Tryk, H. Uchida and M. Watanabe
Electrochem. Acta. 120, 240, (2014)
[13] H.-S. Chu, C. Yeh and F. Chen, J. Power Sources, 123, 1, (2003)
- 13 - 304, (2013)
[15] N. M. Markovic, Handbook of Fuel Cells – Fundamentals, Technology and Applications, W. Vielstich, A. Lamm, and H. A. Gasteiger, Editors, Vol. 2, p. 374, John Wiley & Sons Ltd., New York (2003).
[16] Hamnett, Handbook of Fuel Cells – Fundamentals, Technology and Applications, W. Vielstich, A. Lamm, and H. A. Gasteiger, Editors, Vol. 1, p. 34, John Wiley & Sons Ltd., New York (2003).
[17] Wang, N. M. Markovic, and V. R. Stamenkovic, ACS Catal., 2(5), 891, (2012).
[18] D.A. Cantane, F.E.R. Oliveira, S.F. Santos, F.H.B. Lima, Appl. Catal. B-Environ., 136,137 351 (2013).
[19] Z. Liu, M. Shamsuzzoha, E. T. Ada, W. M. Reichert, D. E. Nikles, J. Power Sources, 164, 472 (2007).
[20] M. Lee, M. Uchida, H. Yano, D. A. Tryk, H. Uchida, and M. Watanabe, Electrochim. Acta., 55, 8504 (2010).
[21] M. Lee, M. Uchida, D. A. Tryk, H. Uchida, and M. Watanabe, Electrochim. Acta., 56, 4783 (2011).
[22] M. Uchida, Y.-C. Park, K. Kakinuma, H. Yano, D. A. Tryk, T. Kamino, H. Uchida, and M. Watanabe, Phys. Chem. Chem. Phys., 15, 11236 (2013).
[23] S. Shukla, K. Domican, K. Karan, S. Bhattacharjee, and M. Secanell, Electrochim.Acta., 156, 289 (2015).
[24] M. Brodt, T. Han, N. Dale, E. Niangar, R. Wycisk, and P. Pintauro, J. Electrochem. Soc., 162, 84 (2015).
- 14 -
[25] B. Martinez-Vazquez, D. G. Sanchez, J. L. Castillo, K. A. Friedrich, and P. L. Garcia-Ybarra,
Int. J. Hydrog. Energy, 40, 5384 (2015).
[26] S. Martin, B. Martinez-Vazquez, P. L. Garcia-Ybarra, and J. L. Castillo, J. Power Sources, 229, 179 (2013).
[27] K. Tang and A. Gomez, J. Colloid Interface Sci., 184, 500 (1996).
[28] S. Martin, P. L. Garcia-Ybarra, and J. L. Castillo, J. Power Sources, 195, 2443 (2010). [29] J. Zeleny, Phys. Rev., 10, 1 (1917).
[30] G. Taylor, Proc. R. Soc. Math. Phys. Eng. Sci., 280, 383 (1964)
[31] K. Hiraooka, in Fundamentals of Mass Spectrometry, K. Hiraooka, editor, Vol. 8, p.145, Springer, New York (2013).
[32] A. M. Chaparro, B. Gallardo, M. A. Folgado, A. J. Martin, and L. Daza, Catalysis Today, 143, 237 (2009).
[33] R. Benıtez, J. Soler, and L. Daza, J. Power Sources, 151, 108 (2005).
- 15 -
Chapter 2
Mode Variation of the ES Method with Pt/GCB or Pt/Ta-SnO
22.1 Introduction
Many researchers have investigated the basic study about the phenomenon of the ES method [1,2]. Zeleny reported that the preparation forms of droplets were affected by the electric field around the nozzle [3]. Taylor theoretically proved that the meniscus of the nozzle tip becomes a cone when a liquid with an electric conductor is subjected to an electric field, so this is called a Taylor cone today [4].
The electric fields are affected depending on several factors, such as nozzle inner diameter, applied voltage and distance between nozzle and substance (d). In principle, the ES method relies on charging the ink in order to disperse the droplets by electrostatic repulsion, so the conductivity of the ink also affects the form of the Taylor cone. In addition, a high viscosity of the ink is suitable, because the ink has difficulty in flowing from the nozzle due to gravity. These conditions can differ according to from the ink components.
Here, the conditions of the Taylor cone using the inks with Pt/GCB and cation-doped metal oxides Pt/Ta-SnO2 were investigated.
2.2 Experimental
2.2.1 Preparation of the catalyst ink with Pt/GCB
A Pt catalyst supported on graphitized carbon black (Pt/GCB, TEC10EA30E, Pt loading percentage 29 wt%, Tanaka Kikinzoku Kogyo K. K.) was mixed with Nafion binder (DE521, E. I. Du Pont de
- 16 -
Nemours & Co., Inc.) and solvent (2-propanol:high purity water = 1:1 (vol. ratio)) by use of a planetary ball mill (270 rpm, 30 min, P-6, Fritsch GmbH) and was pulverized by use of a wet pulverizing/dispersing device (150 MPa, Star Burst Mini, Sugino Machine, Ltd.). The inks were stabilized by rotating them with a mill pot rotator (Ketjenblack S, Nitto Kagaku Co., Ltd.) for more than 12 h. This preparation of the ink was developed for the conditions for the ES based on the ink composition used for the PSS.
2.2.2 Preparation of the catalyst ink with Pt/Ta-SnO2
The Ta-SnO2 support was synthesized by use of the flame combustion method, which was
described in our earlier work [1, 2]. The Ta dopant content in the support was determined to be 2.5 at% by use of inductively coupled plasma-mass spectroscopy (ICP-MS, 7500CX, Agilent Technologies Co.).The synthesized Ta-SnO2 support was sintered at 800 ◦C for 4 h in air in a rotary
kiln furnace. The surface areas of the Ta-SnO2 particles were 25.6 m 2
g-1, estimated by the Brunauer-Emmett-Teller adsorption method (BET, BELSORP MAX, MicrotracBEL Co.). Pt nanoparticles were loaded on Ta-SnO2 by use of a colloidal method [2-4]. The Pt/Ta-SnO2 was
heat-treated at 400 oC in N2 for 2 h and then quenched at room temperature. In addition, the
Pt/Ta-SnO2 was heat-treated at 150 oC in 1 vol% H2 (balance N2) for 2 h and then quenched at room
temperature. The Pt loading amounts of the Pt/Ta-SnO2 were estimated by use of ICP-MS. The Pt
particle size was estimated to be 5.0 ± 0.7 nm from the TEM images. All of the characterization results correspond to the sample obtained after the 400 oC heat treatment. The Pt/Ta-SnO2 catalyst
had a Pt loading of 17.5 wt%. The Pt/Ta-SnO2 was mixed with Nafion binder and solvent
- 17 -
inks were stabilized by first rotating them in a mill pot rotator, at least 2 h and then refrigerating them at least 24 h. Without the pot-mill rotation, the viscosities of the inks were significantly unstable. With the pot-mill rotation, the viscosities of the inks decreased over time, becoming stable after 18 h. With use of both the mill-pot rotation and refrigeration, the viscosity of the ink decreased and became remarkably stable. The stabilized inks were rotated with the mill pot rotator again for at least 1 h and were then were dispersed with a ultrasonic homogenizer (UH-50, SMT. Co., Ltd.).
2.2.3 Setting parameters of the ES method
The mode changes of ES method were investigated with nozzle inner diameter of the nozzle, applied voltage and d. The nozzle is positioned above the substrate at a vertical distance 2 and 3 cm, and the distance between the nozzle and extractor electrode plate with a single perforation was maintained at 0.5 cm. The surface substance temperature was maintained at 55 oC.
2.3 Results and discussion
2.3.1 The mode changes of ES method with Pt/GCB
The mode changes are shown in Fig. 2-1a,b,c as a function of applied voltage and nozzle inner diameter every d = 2.0 cm, 2.5 cm, 3.0 cm. In particular with d = 2.0 cm, the images of the tip of the nozzle are also shown in the images in Fig. 2-1a. The cone-jet mode is shown designated by “o.” (between 3.5 kV and 4.2 kV, with nozzle inner diameter of 250 µm). In the low applied voltage region, below 3.4 kV, with nozzle inner diameter of 250 µm, the tip of the ink emanating from the nozzle had a rounded, droplet shape, without constructing a Taylor cone (designated by “x”). This
- 18 -
without atomization. At applied voltages greater than 4.2 kV with nozzle inner diameter of 250 µm, the Taylor cone became unstable, with wobbling of the droplet surface (designated by “△”). This
condition is referred to as the multi-jet mode [7, 8], in which the droplets are dispersed by the electrostatic repulsion and are deposited heterogeneously on the membrane. The electric field (E) of
the ink surface at the metal nozzle was estimated as follows:
E = K (V / r) (Eq.2-1)
K = 2 / ln (2d / r) (needle electrode) (Eq.2-2)
where V is the potential of the metal nozzle, r is the radius of curvature of the tip, and d is the distance to the counter-electrode (substance). The estimated value of E in our system was on the order of 100 MV m-1, based on the results of Eq. 2-1 and 2-2, which is comparable to that for the generation of the stable Taylor cone (Fig. 2-2) [9]. In the case of constant d, the region of the cone-jet mode expanded with increasing nozzle inner diameter. The reason is able to be explained from Eq. 2-1 and 2-2, namely, K decreases with increasing d. Even if the d or nozzle inner diameter changed, the region of the cone-jet mode was nearly unchanged (about 3.5 kV ~ 4.1 kV).
- 19 -
(b)
(c)
Fig. 2-1 Mode changes with Pt/GCB of Taylor cone as a function of the nozzle-substrate
distance and the applied voltage (a) d = 2.0 cm, (b) d = 2.5 cm, (c) d = 3.0 cm.
- 20 -
Fig. 2-2 Relationships between the applied voltage and the electric field for various
nozzle-substrate distances.
- 21 - 2.3.2 Mode changes of ES method with Pt/Ta-SnO2
The mode changes of ES method with Pt/Ta-SnO2 were also measured as in the case of Pt/GCB.
However, the viscosity of the ink using Pt/Ta-SnO2 (5.68 mPa s) was significantly lower than that
using Pt/GCB (25.3 mPa s) and thus easily flowed from the nozzle due to gravity. Thus, The ES device was modified Figure 2-3 to control the negative pressure in the ink reservoir between 0.32 kPa (gauge) and 0.38 kPa (gauge) to prevent uncontrolled leakage. The coating modes for the ES method as a function of applied voltage and nozzle inner diameter are shown in Fig. 2-4, a, b, c. As with Pt/GCB, the region of the cone-jet mode expanded with increasing nozzle inner diameter in the case of constant d. Compared with using Pt/GCB, the region of the cone-jet mode with Pt/Ta-SnO2
was shifted to low applied voltage. The reason can be explained from Eq. 2-1 and 2-2, namely, the E with Pt/Ta-SnO2 is higher than that with Pt/GCB due to the increase of r. This would be attributed to
the difference of the conductivity in the ink.
From these results, the low viscosity ink was able to form the cone-jet mode in the case of controlling the negative pressure in the ink reservoir. The relationship between the viscosity of the ink and the negative pressure in the ink reservoir is shown in Fig. 2-5. This result indicates that the negative pressure in the ink reservoir became high when the viscosity of the ink was low. Therefore, the cone-jet is theoretically able to be formed for low viscosity of the ink.
- 22 -
- 23 -
Fig. 2-4 Mode changes with Pt/Ta-SnO
2of Taylor cone as a function of the nozzle-substrate
distance and the applied voltage (a) d = 2.0 cm, (b) d = 2.5 cm, (c) d = 3.0 cm.
(a)(b)
- 24 -
Fig. 2-5 Relationships between the ink viscosity and negative pressure in the ink
reservoir.
- 25 - 2.4 Conclusions
Pt/GCB or Pt/Ta-SnO2 was mixed with Nafion binder and solvent, and the mode changes of ES
method were investigated. Both regions of cone-jet mode with Pt/GCB or Pt/Ta-SnO2 exhibited
small differences, and the similar types of behavior were described; the regions of cone-jet mode shifted to high applied voltage with increasing nozzle inner diameter or d. Compared with using Pt/GCB, the region of the cone-jet mode with Pt/Ta-SnO2 was shifted to low applied voltage. The E
values with Pt/Ta-SnO2 were higher than those with Pt/GCB due to increase of r. This would be
attributed to the difference of the conductivity of the ink. In addition, the low viscosity ink was able to form the cone-jet mode in the case of controlling the negative pressure in the ink reservoir. This means that various types of catalyst inks are able to adapt to the ejection with the cone-jet mode of the ES method, even with changes of the catalyst or the mass ratio of binder to support.
- 26 - 2.5 References
[1] X. G. Zhang and O. A. Basaran, J. Fluid Mech., 326, 239, (1996).
[2] H. Kawamoto, S. Umezu and R. Koizumi, J. Imaging Sci. Tech., 49(1), 19, (2005). [3] J. Zeleny, Phys. Rev., 10, 1 (1917)
[4] G. Taylor, Proc. R. Soc. Math. Phys. Eng. Sci., 280, 383 (1964).
[5] E. D. Wilkes, S. D. Phillips and O. A. Basaran, Phys. Fluids, 11 (12), 3577 (1999).
[6] K. Kakinuma, M. Uchida, T. Kamino, H. Uchida, and M. Watanabe, Electrochimica Acta, 56, 2881 (2011).
[7] K. Kakinuma, Y. Chino, Y. Senoo, M. Uchida, T. Kamino, H. Uchida, S. Deki, and M. Watanabe, Electrochimica Acta, 110 316 (2013).
[8] M. Watanabe, M. Uchida and S. Motoo, J. Electroanal. Chem., 199, 311. (1986).
[9] M. Uchida, Y. Aoyama, M. Tanabe, N. Yamagihara, N. Eda and A. Ohta, J. Electrochem. Soc.
142 2572 (1995).
[10] M. Cloupeau and B. Prunet-Foch, J. Electrostatics, 25, 165 (1990).
[11] S. Martin, A. Perea, P. L. Garcia-Ybarra, and J. L. Castillo, J. Aerosol Sci., 46, 53 (2012). [12] J. M. Wilson, J. Agric. Engng. Res., 27, 355 (1982).
- 27 -
Chapter 3
Improvement of Cell Performance in Low-Pt-Loading Cathode
CLs with Pt/GCB Prepared by the ES method
3.1 Introduction
Platinum-based nanoparticles supported on carbon black (Pt/CB) are typical cathode catalysts for PEFCs [1-3]. The CBs have been adopted as supports for PEFC cathodes because of their high specific surface area, high electrical conductivity and low cost, although the corrosion of the carbon remains a significant issue [4, 5]. Nevertheless, the CBs are attractive support materials for fuel cell
vehicle (FCV) and co-generation systems [6], and the cell performance for MEAs prepared by the ES method were reported with Pt/CB [7-9]. However, carbon has an intrinsic thermodynamic instability derived from its oxidative corrosion to carbon dioxide under PEFC cathode conditions. The carbon corrodes seriously when the cathode is exposed to potentials significantly higher than the thermodynamic potential for the following reaction [5, 10].
C + 2 H2O → CO2 + 4H +
+ 4e- (Eo = 0.207 V vs SHE)
Carbon corrosion also leads to the isolation of Pt particles from the support surface, deterioration of the cell performance, and thus the cathode performance decreases. [11] As an alternative carbon support to mitigate the carbon corrosion, a graphitized carbon black (GCB) is effective, and beneficial effects have been demonstrated by electrochemical measurements and electron microscopic analysis [12-14]. The information of pore structure and ionomer distribution with Pt/ GCB for the ES method is lacking, because no investigations of cell performance with Pt/GCB for the ES method have been reported thus far.
- 28 -
In the chapter, uniform CLs (area 29.2 cm2 ) with low Pt loading (0.05 mg cm-2) were prepared by the ES method. The single cell performances were evaluated by use of the standard evaluation cell designed by the Japan Automobile Research Institute (JARI), which is recommended for use as the first step in MEA evaluation by the Fuel Cell Commercialization Conference of Japan (FCCJ). The
morphology of the CLs and the performance of the cell were also evaluated, in comparison with that for a CL prepared by the spray method. The attractive features of the ES method were considered.
3.2 Experimental
3.2.1 Preparation of the catalyst ink
Pt catalyst supported on Ketjenblack carbon black (Pt/CB, TEC10E50E, Pt loading percentage 46 wt%, Tanaka Kikinzoku Kogyo K. K.) were applied as the anode. The commercial catalysts were mixed with Nafion binder and solvent (ethanol:high purity water = 2:1 (vol. ratio) by use of a
planetary ball mill (270 rpm, 30 min). The preparation method of cathode catalyst inks is described in the previous Chapter (Section 2.2.1, Preparation of the catalyst ink with Pt/GCB).
3.2.2 ES method
The explanations of the mechanism and components for ES method were described in previous chapter (Section 2.2.3 Setting parameters of the ES method). From the results of investigations for the cone-jet mode with Pt/GCB, the capillary nozzle (inner diameter 210 μm) is equipped with an ink reservoir containing the catalyst ink, and the applied voltage was set 3.9 kV. The nozzle was positioned above the substrate at a vertical distance 2.5 cm, and the distance between the nozzle and extractor electrode plate with a single perforation was maintained at 0.5 cm. The temperature of the
- 29 -
surface of the substrate was maintained at 55 oC. In order to prepare a large-area CL, the substrate stage was able to be moved horizontally at a speed of 15 mm s-1 and to be horizontally shifted with a 0.6-mm pitch. Uniform CLs with an active area of 29.2 cm2 were obtained by coating the membrane twice.
3.2.3 Pulse-swirl-spray method
A schematic drawing of the PSS method is shown in Fig. 3-1. In the PSS method (Nordson Co.), the ink is atomized by air with a swirling flow pattern. The ink reservoir was connected to a spray gun, which was equipped with a nozzle (inner diameter 500 μ m). The spray gun was positioned 7
cm above the membrane, which was held by aspiration on a heated porous substrate (surface temperature, 55 ◦C). The ink was sprayed in a swirl pattern and was atomized on the membrane. The
spray gun was horizontally moved at a speed of 50 mm s-1, and the stage of the porous substrate with the membrane was shifted horizontally with a 5-mm pitch. The coating procedure was repeated ten times.
- 30 -
- 31 -
3.2.3 Preparation and evaluation of the CLs fabricated by PSS or ES methods
The anode catalyst ink was prepared by the PSS method on the electrolyte membrane, and the cathode catalyst ink was prepared by either the ES or the PSS method. Each of the CL-coated membranes (CCMs) obtained were dried in an electric oven (60 ◦C, 12 h), sandwiched by gas diffusion layers (GDLs, 25BCH, SGL Carbon Group), and hot-pressed (140 ◦C, 10 kgf cm-2, 3 min.). The Pt loading amounts of these membrane-electrode assemblies (MEAs) were estimated by use of ICP-MS. The Pt loading amounts of the cathode CLs were confirmed to be 0.048 mg cm-2 (PSS) and 0.056 mg cm-2 (ES), and that of the anode CLs was 0.50 ± 0.02 g cm-2. The high Pt loading at the anode was prepared so that there would be negligible anode polarization under all of the experimental conditions. The droplets on the membrane of both methods were observed by use of a digital microscope (VHX-1000, Keyence Co.). Scanning electron microscopic images (SEM) of the catalyst layers were obtained in the SEM mode with a scanning transmission electron microscope (STEM, HD-2700, Hitachi High-Technologies Co.). Cross-sectional samples were prepared by use of a focused ion beam milling system (FIB, FB-2200, Hitachi High-Technologies Co.). The average thicknesses of the CLs were estimated from the values measured at 120 positions on the CL. The occupation fractions of pores in the CLs, based on binarization of the SEM images with high and low magnification, were estimated with an image analysis system (LUZEX-AP, Nireco Co.).The distributions of the ionomer coated on the Pt and GCB support particle surfaces were observed by use of a TEM (HT7700S, Hitachi High-Technologies Co.), with which it was possible to observe the sample with low acceleration voltage (80 kV); this microscope was also equipped with a special high resolution objective lens. This equipment makes it possible to observe soft organic ionomers and inorganic carbon materials at high resolution and high contrast with minimal beam damage [15].
- 32 - 3.2.4 Evaluation of fuel cell performances
Cyclic voltammograms (CVs) of each cathode CL were measured with a potentiostat (HZ-5000, Hokuto Denko Co.) during H2 flow to the anode (100 mL min
-1
) and a static N2 atmosphere at the
cathode, both at ambient pressure. Prior to the sweep, the cathodic potential was maintained at 0.075 V for 3.0 s. Then, the potential was swept from 0.075 V to 1.000 V at 20 mV s-1 and reversed back to 0.075 V. The electrochemically active surface areas (ECAs) of each Pt catalysts in the CLs were evaluated from the hydrogen adsorption charge of the CVs, based on a standard value of charge per unit area (QH of 0.21 mC cm
-2
) at 30% relative humidity (RH), 53% RH, 80% RH, and 100% RH at 80 ◦C. The current-voltage (I-V) characteristics were evaluated under steady-state operation, after 5 min at each point. The polarization curves were measured in the current control mode. This mode is more common for the evaluation of cell performance of large size MEAs. The cell potential was controlled galvanostatically by use of an electronic load (PLZ-664WA, Kikusui Electronics Co., Ltd.) and was measured as a function of current density by use of a cell performance evaluation-system (FCE-1, Panasonic Production Technology Co., Ltd.). The cell resistance (at 1 kHz) was measured under load by use of a digital ac milliohmmeter (Model 3566, Tsuruga Electric Co., Ltd.). H2 was flowed to the anode and O2/air to the cathode, and the flow rates of all gases were
controlled by use of mass flow controllers. The utilization of reactant gases was 70% for H2 and 40%
for O2/air. These gases were humidified at 30%, 53%, 80% and 100% RH at 80 ◦C under ambient
- 33 - 3.3 Result and discussion
3.3.1 Construction of CLs
Photographs of the areas coated by the PSS and ES methods are shown in Figs. 3-2(a) and 3-2(b). The white dotted line indicates the size of the CL (29.2 cm2). The areas coated by PSS and ES method were 85.2 cm2 and 33.6 cm2, respectively. Thus, the masked outer area for the PSS method was 56.0 cm2, which was approximately twice as large as the geometric electrode area. The masked outer area for the ES method was only 4.4 cm2, which was lower by a factor of approximately 13 compared with that for the PSS method. Clearly, the ES method makes it possible to precisely control the coated area and to reduce the loss of the ink. Optical micrographs were obtained of the droplets produced with the of PSS and ES methods on the membrane by use of a digital microscope, as shown in Figs. 3-2(c) and 3-2(d). The average droplet sizes for the PSS and ES method were 82.7 ± 13.3 μ m and 2.35 ± 0.92 μ m, respectively. The average droplet size for the ES method was much
smaller than that for the PSS method from these photographs. The droplet shapes also differed significantly and indicated that the PSS droplets were wet, while the ES droplets were dry. Specifically, the droplets produced by the PSS method were of nonuniform shape and consisted of
catalyst particles in various amounts, because these particles were wet with solvent when they were deposited on the membrane and coalesced during the evaporation of the solvent. In contrast, the droplets produced by the ES method were of uniform shape, because coalescence was prevented due to the low volume of solvent. Even if a more dilute ink was used for the PSS method, the catalyst particles would also coalesce when the wet droplets dried.
- 34 -
Fig. 3-2 Photographs of CLs on the membrane prepared (a) by PSS method and
(b) by ES method. Photographic images of droplets on the membrane prepared
(c) by the PSS method and (d) by ES method.
- 35 -
3.3.2 Microstructure of CLs prepared by PSS and ES methods
Low magnification SEM images of the CLs obtained by the PSS (PSS-CL) and ES (ES-CL)
methods are shown in Figs. 3-3a and 3-3b. The average thickness of the ES-CL (16.2 ± 5.7 μm) was approximately 3 times larger than that of the PSS-CL (5.5±4.9 μm), in spite of having the same Pt loading amount. The surface roughness for both methods was nearly the same. The large pores, those over 300 nm in diameter, which were estimated from the equivalent circles by the image analysis apparatus, were dispersed throughout both CLs. The occupation fractions of the pores for each CL are summarized in Table 3-1. In the low magnification SEM images (Figs. 3-3a and Figs. 3-3b), the pore fractions for PSS-CL and ES-CL were nearly the same, 0.22 ± 0.024 and 0.23 ±0.021, respectively. The high magnification SEM images of both CLs are shown in Figs. 3-3c and 3-3d, and the corresponding pore parameters are also listed in Table 3-1. The total occupation fraction of the pores based on the high-magnification images for the ES-CL was 0.40 ± 0.044, which was about twice as large as that for the PSS-CL (0.23 ± 0.024). The pore distribution of the GCB obtained by use of mercury porosimetry is shown in Fig. 3-4. The critical change of the cumulative pore volume at about 20 nm indicates the boundary between the primary and secondary pores of the CL. The primary pores are formed between the aggregates of GCB (secondary particles of GCB) [16-18]. The secondary pores are formed between the Pt/CB agglomerates, which are groups of aggregates. The primary and secondary pore fractions of CLs for PSS and ES methods were also evaluated according to the boundary at 20 nm, in Table 3-1. The fraction of small pores (< 20 nm in diameter) in the high magnification images of the ES-CL was 0.072 ± 0.0069, which was more than twice as large as that
for the PSS-CL (0.031 ± 0.0042). The fraction of large pores (> 20 nm in diameter) in the high magnification images of the ES-CL was 0.33 ± 0.036, which was more than 1.5 times larger than that
- 36 -
for the PSS-CL (0.20 ± 0.022). These results indicate that a more highly porous CL is able to be fabricated by the ES method than by the PSS method. This increase of the pore volume results from increases in the fractions of both small and large pores due to the small ink droplets formed by the electrostatic repulsion. Therefore, the thickness of the CL obtained with the ES method was much larger than that for the CL obtained with the PSS method.
- 37 - Cell
Low magnification images High magnification images
total pore fraction total pore fraction primary pore fraction secondary pore fraction
PSS-cell ES-cell 0.22 ± 0.024 0.23 ± 0.021 0.23 ± 0.027 0.40 ± 0.044 0.031 ± 0.0042 0.072 ± 0.0069 0.20 ± 0.022 0.33 ± 0.036
Fig. 3-3 SEM cross-sectional images of cathode CLs prepared (a) by PSS method
and (b) by ES method, magnified images of the cathode CLs (c) by PSS method
and(d) by ES method.
Table 3-1. Occupation fractions of the pores in the CLs prepared by the PSS and by
ES methods in Fig. 3-3, which were estimated from the equivalent circles by use of an
image analysis system
- 38 -
Fig. 3-4 Relationship between cumulative pore volume and pore diameter of the graphitized
carbon black.
- 39 -
3.3.3 Performance of the cathodes fabricated by the PSS and ES methods
The CVs for the ES-cell cathode and PSS-cell cathode (80 ◦C, 100% RH) exhibited the usual hydrogen absorption/desorption peaks and Pt oxidation/reduction peaks (Fig. 3-5a); these peaks were rather similar for the two cathodes. The ECA values, which were determined from the hydrogen adsorption peak for the ES-cell at 80 ◦C and 30–100% RH, increased 20–10% with increasing humidity and were larger than those for the PSS-cell (Fig. 3-5b). The ECA value at 100% RH at 80 ◦C was higher than the other values [7]. The ES method makes it possible to effectively construct a
porous CL. The increase of the ECA values indicated that the ES method was also effective in improving the ionomer coverage. TEM images are shown in Figs. 3-6a and 3-6b. These images indicate that the ionomer coverage on catalyst particles in a CL prepared using the ES method was clearly larger than that for a CL prepared using the PSS method. The ionomer thickness in the ES CL was approximately 5 nm, and the ionomer was spread uniformly on most of the GCB surfaces. In contrast, the ionomer in the PSS-CL was unevenly distributed. With the ES method, the ink droplets were quite small, in the micrometer range, and thus the drying process during CL fabrication might have been faster than that for the PSS method (Figs. 3-3(c) and 3-3(d)). Such an acceleration of the drying might have an effect on the ionomer coverage.
Fig. 3-7 shows IR-free polarization curves for the ES-cell and PSS-cell at 80 ◦C at 80% RH under O2/air cathode conditions. The Tafel slopes for the ES-cell and PSS-cell were 84.3 mV decade-1 and
89.5 mV decade-1, respectively, indicating that nearly the same kinetic behavior was occurring for the ORR in both cathode CLs. The cell potential of the ES-cell was higher than that of the PSS-cell for current densities below 0.5 A cm-2. The dependence of the mass activity (MA) on humidity is shown for both cells for the 30–100% RH range in air in Fig. 3-8. The MA values for the ES-cell at
- 40 -
0.85 V at each humidity were more than twice as large as those for the PSS-cell. The improvements of the MA for the ES-cell were significantly higher than those for the ECA values (20–10%). These results suggest that the effectiveness of Pt [19] was improved by the use of the ES method, in addition to the improvement of the Pt utilization. Fig. 3-9 shows the current density and ohmic resistance of both cells at 0.70 V under the various RH conditions. The superiority of the performance of the ES-cell compared to that of the PSS-cell decreased with decreasing RH. In order to compare the cell performance to previous cell performance [7-9]. Table 3-2 summarizes the current per unit cathode Pt mass at 0.70 V and maximum power for selected evaluation conditions. These data indicate that the performance of our ES cathode is superior to those in previous reports, because the present evaluation conditions included air with zero backpressure. The difference between the ohmic resistances of both cells increased with decreasing RH. The ionomer coverage was clearly improved by the use of the ES method in spite of the ionomer contents of both cells being nearly the same (Figs. 3-6a and 3-6b). The average ionomer thickness on the Pt/GCB surface using the ES method is estimated to be smaller than that using the PSS method. Therefore, the performance superiority of the ES-cell should decrease with decreasing RH, because the ionic resistance of the ES-cell increased more rapidly with decreasing RH than that for the PSS-cell. The high ohmic resistance of the ES electrode was caused by the ionic resistance due to the large CL thickness and small ionomer thickness. At high relative humidity, the large CL thickness caused long proton paths in the CL, and the ohmic resistance increased. However, the ionomer distribution in the ES electrode was uniform and continuous, based on the ECA and MA, and the difference in the ohmic resistance was small. At low relative humidity, the small ionomer thickness in the ES electrode was affected more strongly, because the ionomer network was easy to interrupt. The O2
- 41 -
gains for both cells, which were obtained under pure O2 and air feed, are shown in Fig. 3-10 as a
function of the current density at 80 ◦C and various RH values. The O2 gain values for the ES-cell at
lower than 0.5 A cm-2 at 80–100% RH were lower than those for the PSS-cell. This indicates that the gas supply network of the cathode was improved under these conditions. The highly porous CL obtained using the ES method was considered to have contributed to the improvement of the gas mass transport at current densities below 0.5 A cm-2 for 80–100% RH. However, for higher current densities and lower RH, the superiority of the ES-cell disappeared. The thick CL obtained with the ES method led to losses of mass transport capability for gas or protons in the high current density range and led to low proton conductance under low RH conditions. For the ES-cell, there is still room for further improvements in ionomer content, Pt loading percentage, type of carbon, and other types of support materials.
- 42 -
Fig. 3-5 (a) Cathode cyclic voltamograms of ES-cell and PSS-cell at 80 ◦C, 100% RH, and (b)
humidity dependence of the ECA of ES-cell and PSS-cell at 80 ◦C.
- 43 -
Fig. 3-6 Morphologies of the ionomer covered on carbon-supported Pt catalysts (a)
in the PSS electrode and (b) ES electrode.
Fig. 3-7 IR-free polarization curves for the ES-cell and PSS-cell at 80 ◦C, 80% RH,
air/H
2, ambient pressure.
- 44 -
Fig. 3-8 Humidity dependence of mass activity at 0.85 V (IR-free), 80 ◦C, air/H
2,
ambient pressure.
Fig.3-9 Humidity dependence of the current density and the ohmic residence at 0.7 V
(IR-free), 80◦C, air/H
2, ambient pressure.
- 45 - Pt loading amount / mg cm-2 Electrode size / cm2 Gas species Back pressure / kPa Cell temperature / oC Gas relative humidity, % Current per cathode Pt loading amount at 0.7 V / A g-1 Max power per cathode Pt loading amount / W g-1 This research ES-cathode-cell 0.056 29.2 Air 0 80 100 3546 18222 A. M Chaparro et al., [20] 0.2 16.0 oxygen 100 80 100 1600 2780 0.17 16.0 oxygen 100 80 100 2235 3206 R. Benitez et al., [21] 0.5 9.0 - 0 room temperature - 289 354 S. Martin et al., [22] 0.012 - oxygen 0 40 0 2083 10400 0.012 - oxygen 340 70 0 8333 21000
Table 3-2 Comparisons of cell performances using various cathode CLs prepared
by the ES method
- 46 - 3.4 Conclusions.
The cathode CLs were prepared by use of the ES method from Pt nanoparticle catalysts supported on GCB and were then evaluated. By optimizing the various preparation conditions, i.e., d, the applied voltage, and the nozzle diameter, etc., the droplets for the ES method were able to maintain a stable ejection of sub-micrometer size, and CLs with highly uniform characteristics were obtained. The ES method enabled us to precisely control the coated area and to reduce the loss of catalyst ink. The ES method also led to improved ionomer coverage, increased ECA values, and more highly porous CLs. The highly porous CL prepared by the ES method contributed to the improvement of the MA and the cell performance due to the increased efficiency of gas mass transport at current densities below 0.5 A cm-2 at 80–100% RH. The new method using the ES method for the preparation of thin CLs with very Pt low loading might be attractive in order to improve the performance and reduce costs for PEFCs.
- 47 - 3.5 References
[1] A. Iiyama, K. Shinohara, S. Iguchi, and A. Daimaru, in Handbook of Fuel Cells, W. Vielstich, H. Yokokawa, and H. A. Gasteiger, Editors, 6 p. 905, John Wiley & Sons, Ltd., West Sussex (2009).
[2] L. M. Roen, C. H. Paik, and T. D. Jarvi, Electrochem. Solid-State Lett., 7, 19 (2004). [3] T. Yoda, H. Uchida, and M. Watanabe, Electrochim. Acta, 52, 5997 (2007).
[4] J. P. Meyers and R. M. Darling, J. Electrochem. Soc., 153, 1432 (2006).
[5] N. Linse, G. G. Scherer, A. Wokaun, and L. Gubler, J. Power Sources, 219, 240 (2012). [6] A. Ohma, K. Shinohara, A. Iiyama, T. Yoshida, and A. Daimaru, ECS Trans., 41(1), 775
(2011).
[7] A. M. Chaparro, B. Gallardo, M. A. Folgado, A. J. Martin, and L. Daza, Catalysis Today, 143, 237 (2009).
[8] R. Benıtez, J. Soler, and L. Daza, J. Power Sources, 151, 108 (2005).
[9] S. Martin, P. L. Garcia-Ybarra, and J. L. Castillo, Int. J. Hydrog. Energy, 35, 10446 (2010). [10] H. Tang, Z. Qi, M. Ramani, and J. F. Elter, J. Power Sources, 158, 1306 (2006).
[11] Y.-C. Park, K. Kakinuma, M. Uchida, H. Uchida, and M. Watanabe, Electrochim. Acta, 123, 84 (2014).
[12] P. V. Shanahan, L. Xu, C. Liang, M. Waje, S. Dai, and Y. S. Yan, J. Power Sources, 185, 423 (2008).
[13] C. Wang, M. Waje, X. Wang, J. M. Tang, R. C. Haddon, and Y. S. Yan, Nano Lett. 4, 345 (2004).
- 48 - 3806 (2010).+
[15] Y. C. Park, H. Tokiwa, K. Kakinuma, M. Watanabe, and M. Uchida, J. Power Sources, 315, 179 (2016).
[16] M. Uchida, Y.-C. Park, K. Kakinuma, H. Yano, D. A. Tryk, T. Kamino, H. Uchida, and M. Watanabe, Phys. Chem. Chem. Phys., 15, 11236 (2013).
[17] M. Uchida, Y. Fukuoka, Y. Sugawara, N. Eda, and A. Ohta, J. Electrochem. Soc., 143, 2245 (1996).
[18] T. Soboleva, X. Zhao, K. Malek, Z. Xie, T. Navessin, and S. Holdcroft, ACS Appl. Mater.
Interfaces, 2, 375 (2010).
[19] M. Lee, M. Uchida, H. Yano, D. A. Tryk, H. Uchida, and M. Watanabe, Electrochim. Acta., 55, 8504 (2010).
- 49 -
Chapter 4
Improvement of Cell Performance in Low-Pt-Loading Cathode
Catalyst Layers with Pt/Ta-SnO
2Prepared by the ES method
4.1 Introduction
Platinum-based catalysts supported on CB have been adopted as typical cathode catalysts for PEFCs, although these materials undergo degradation under the operating conditions of low pH, high humidity and high potential [1-3], The mechanism were described in detail in the previous Chapter (3.1, Introduction). As alternative supports to carbon, many researchers have focused on metal oxides as cathode catalyst supports. Ioroi reported that Pt supported on Magneli phase Ti4O7
and also TiOx were stable at high potentials (<1.5 V), and that a single cell with a 10% Pt/Ti4O7
cathode was able to be operated (80◦C in 0.67 V with H2/O2) successfully for 350 h [4-6]. Other
transition metal-based materials such as TiN have also been investigated as carbon-free cathode electrocatalysts for PEFCs [7-13]. We proposed a fabrication method for Sb-doped SnO2
nanoparticles with CB-like aggregated structures, and reported high durability in the high potential region [14]. In particular, Pt/Ta-doped SnO2 with CB-like aggregated structures catalyst have high
electrical conductivity, and this has been identified as a superior cathode candidate catalyst for PEFCs [15]. Thus, the ES method for the preparation of thin CLs with Pt low loading might be effective in improving the performance and reducing the cost of PEFCs. However, to our knowledge, no investigations of such cell performance have been reported thus far.
In this Chapter, low Pt loading CLs by the ES method with Pt/Ta-SnO2 are described. This
- 50 -
The cell performances and CL morphology were evaluated.
4.2 Experimental
4.2.1 Preparation of the catalyst ink with Pt/Ta-SnO2
The synthesis method of Pt/Ta-SnO2 material and preparation of the catalyst ink with Pt/Ta-SnO2
were described in in the previous Chapter (Section 2.2.2, Preparation of the catalyst ink with Pt/Ta-SnO2). The mass ratios of Nafion binder to SnO2 support (I/S) values were adjusted to 0.2 or
0.7 for the ES method and 0.7 for the PSS method. The catalyst inks ware prepared by the ES and the PSS methods for the cathode. The average Pt nanoparticle diameters were estimated from TEM images. The preparation of the anode ink was described in the previous Chapter (3.2.1, Preparation of the catalyst ink).
4.2.2 Preparation of CLs by the pulse-swirl-spray and ES methods
The explanations of the mechanism and components for the ES method were described in Chapter 2 (Section 2.3.2, Mode changes of ES method with Pt/Ta-SnO2). In order to investigate the cone-jet
mode with Pt/Ta-SnO2, the capillary nozzle (inner diameter 210 μm) was equipped with an ink
reservoir containing the catalyst ink, and the applied voltage set to 3.2 kV. The pressure in the ink reservoir was controlled between -0.32 and -0.38 kPa (gauge). The nozzle was positioned above the substrate at a vertical distance 2.5 cm, and the distance between the nozzle and extractor electrode plate with a single perforation was maintained at 0.5 cm. The surface temperature of the substrate was maintained at 55 oC. The PSS method conditions were similar to those describe in the previous Chapter. (Section 3.2.3, Pulse-swirl-spray method). The Pt loading amount were confirmed to be
- 51 -
0.048 mg cm-2 (PSS I/S = 0.7), 0.048 mg cm-2 (ES I/S = 0.7) and 0.054 mg cm -2 (ES I/S = 0.2) by ICP-MS. The droplets deposited on the membrane by both methods were observed by use of a digital microscope. The average thicknesses of these CLs were estimated from the values measured at 100 positions on the CL from scanning electron microscopic mode images of STEM. The anode ink was directly sprayed onto the GDLs by use of the PSS method. The Pt loading amounts of the anode CLs were confirmed to be 0.50 mg cm-2. The gas diffusion layers (GDLs) had very rough surfaces. A cathode with a low Pt loading would have been adversely affected by the roughness of the GDL surface if the thin CL had been sprayed directly onto it. On the other hand, the anode CL was able to moderate the effect of the roughness of the GDL surface due to the thicker CL.These CCMs were sandwiched between GDEs and GDLs, and hot-pressed (140 °C, 10 kgf cm-2, 3 min). Cross-sectional samples were prepared by use of FIB. Images of the CLs were obtained in the SEM mode with the STEM described above. The occupation fractions of pores in the CLs, based on binarization of the SEM images with high and low magnification, were estimated with an image analysis system. The distributions of the ionomer coated on the Pt and carbon support particles surface were observed by use of TEM [16]. These CLs with ES and PSS I/S = 0.7 were observed by use of FIB-SEM (Helios NanoLab G3UC, Thermo Fisher Scientific Inc.). Samples for imaging were prepared by attaching small squares (1.0 cm × 1.0 cm) of coated sample on standard aluminum SEM stubs with conductive carbon adhesive. The samples were placed in the vacuum chamber of the FIB-SEM under SEM imaging conditions, and the FIB intensity was kept as low as possible to prevent potential damage of the layer by the beam. Typical imaging conditions were 1 kV and 50 pA in the scanning electron (SE) mode. The FIB acceleration voltage was 30 kV, and the current was 18 pA for all processes (deposition, rough cutting and polishing) with a 4-nm pitch. Binarization of the
- 52 -
SEM images was carried out by use of in-house software supplied by Panasonic. The 3D images were constructed within a volume of 2.5 μm × 1.7 μm × 1.0 μm from a total of 250 cross-sections of the binarized SEM images. The pore diameter distributions were analyzed by use of an in-house software package from the 3D images.
4.2.3 Evaluation of the fuel cell performance
Cyclic voltammograms (CV) of the cathodes were measured between 0.075 V ~ 1.0 V at 80 oC, 80% RH, and ambient pressure with a potentiostat (PGST30 Autolab system, Metrohm Autolab B.V.) with H2 flowing through the anode (100 mL min
-1
) and a static N2 atmosphere in the cathode.
Prior to the sweep, the cathodic potential was maintained at 0.075 V for 3.0 s at 20 mV s-1. The electrochemically active surface areas (ECA) of the Pt catalysts in the cathode CLs were evaluated from the hydrogen adsorption charge of the CV based on the standard value of charge per unit area. The average Pt particle diameter was 5.0 ± 0.7 nm, and the total surface area was estimated from this value. The fraction of the total Pt surface area (termed Pt utilization, UPt) that is contacted by the
ionomer can also be accessed during the ORR in the CL. As a measure of UPt in the CL of the MEA,
the ECA obtained under inert atmosphere has been employed, as determined from the hydrogen adsorption/desorption charge QH, and the UPt.
UPt = ECA / SPt,TEM (Eq.4-1)
where the SPt,TEM values are the total surface areas of Pt, which were estimated from the average
particle size [17].
The I-V polarization curves of the MEAs were obtained under the given conditions in steady-state operation, after 5 min at each point. The cell potential was controlled galvanostatically by use of an
- 53 -
electronic load and was measured as a function of current density by use of a cell performance evaluation-system in the H2 anode and the O2 or air cathode at 80 °C under ambient pressure (100
kPa) or 150 kPa and 200 kPa as back-pressure. These gases were humidified at 80% relative humidity (RH) by use of heated water bubblers. Both gas flow rates were 100 mL min-1. Based on our previous AC impedance measurements with a Pt/Ta-SnO2-cathode cell, the high frequency (HF)
ohmic resistance was measured at 10 kHz under load by use of a digital ac milliohmmeter (Model 356E, Tsuruga Electric. Co.).
4.3 Result and discussion 4.3.1 Construction of CLs
The droplets were deposited as shown in Figs. 4-1b and 4-1c when the ink was maintained in the cone-jet mode, compared with those deposited by use of the PSS method (Fig. 4-1a). The average droplet sizes were determined from the impact traces as 109.9 ± 51.8 µm (PSS I/S = 0.7), 4.40 ± 1.39 µm (ES I/S = 0.7) and 3.64 ± 2.55 µm (ES I/S = 0.2), respectively. Clearly, there was only a small difference between the average droplet sizes for the two I/S ratios for the ES method in comparison with that for the PSS method from these photographs. The droplet shapes also differed significantly for the ES and PSS methods, similar to the case of Pt/GCB describe in the previous
Chapter (Section 3.3.1, Construction of CLs). The PSS droplets were wet, and the shapes were non-uniform. In contrast, the ES droplets were dry, and the shapes were uniform. Similar differences in droplet shapes were described in the previous Chapter using a Pt catalyst supported on GCB (3.3.1, Construction of CLs).
- 54 -
(b) ES I/S = 0.7
(c) ES I/S = 0.2
(a) PSS I/S = 0.7
(b) ES I/S = 0.7
(c) ES I/S = 0.2
Fig. 4-1 Photographic images of droplets on the membrane prepared (a) by the PSS
method with the I/S = 0.7 ink, (b) by the ES method with the I/S = 0.7 ink and (c)
by the ES method with the I/S = 0.2 ink.
- 55 -
4.3.2 Morphology comparison of CLs with PSS I/S = 0.7, ES I/S = 0.7 and ES I/S = 0.2
Low magnification FIB-secondary ion microscopy (FIB-SIM) cross-sectional images of PSS I/S = 0.7, ES I/S = 0.7 and ES I/S = 0.2 CLs are shown in Figs. 4-2a, 4-2b and 4-2c. The average thicknesses were 2.1 ± 1.1 µm (PSS I/S = 0.7), 5.4 ± 0.5 µm (ES I/S = 0.7) and 5.8 ± 0.3 µm (ES I/S = 0.2), respectively. The average thicknesses of the CLs for ES I/S = 0.7 and ES I/S = 0.2 were approximately 3 times larger than that for the PSS I/S = 0.7, in spite of having the same Pt loading amount. The droplets produced by the ES method were dry. (Fig. 3b and 3c) Therefore, the droplet morphology would hardly change during hot-pressing. In contrast, the droplets produced by the PSS method were wet. (Fig. 3a) The morphology of the PSS droplets was remarkably changed during drying and hot-pressing. The thickness of CLs prepared by use of the PSS decreased significantly. The large pores (> 300 nm) were estimated from the equivalent circles by the image analysis apparatus. The occupation fractions of the pores for each CL are summarized in Table 4-1. The pore fractions for CLs with ES I/S = 0.7 (0.33 ± 0.023) and ES I/S = 0.2 (0.36 ± 0.026) were larger than that for the PSS with I/S = 0.7 (0.21 ± 0.024). High magnification SEM cross-sectional images of the
CL images are shown in Figs. 4-2d, 4-2e and 4-2f. The extent of small pores (between 20 nm and 300 nm) was also estimated. The occupation fractions of the pores for each CL are also listed in Table 4-1. The pore fractions of CLs with ES I/S = 0.7 (0.42 ± 0.036) and ES I/S = 0.2 (0.45 ± 0.039) were larger than that with PSS I/S = 0.7 (0.25 ± 0.026). Three-dimensional images of the PSS I/S = 0.7 and ES I/S = 0.7 CLs were estimated from the binarized images obtained from the FIB-SEM. The 3-D images are shown in Figs. 4-3a and 4-3b. Both cumulative pore volumes and pore size distributions were calculated from the binarization data (Figs. 4-4a and 4-4b). The cumulative pore volume for ES I/S = 0.7 increased and became significantly larger than that for PSS,