Title
中学校・高校英語教師のジレンマ−アンケートによる一
考察−
Author(s)
平良, 辰夫
Citation
沖縄大学紀要 = OKINAWA DAIGAKU KIYO(3): 75-97
Issue Date
1983-03-31
URL
http://hdl.handle.net/20.500.12001/5667
沖縄 大学紀要第
3号 (1983
年 )
中学 校 ・高校 英 語 教 師 の ジ レ ンマ
ー ア ンケー トに よる一 考察
-′平
良
辰
夫
2
世紀以上にわたる徳川幕府の鎖国政策の後に、 日本は
1858
年、 日米 通修
条約 の締結を余儀 な くされた。 この文明開化 と同時に日本の英語教育の歴史も
始まったといえよう。従 って英語教育の歴史は百年以上に もさかのぼる。 この
間、種々の新教授法が外国か ら紹介 され、 また著名な教授たちが来 日し、講演
していった。 しか し、そのような努力にもかかわ らず、 「日本人は リスニング
とスピーキングがへた」 とい うイメージは国内外に浸透 している。中学校 ・高
校 と
6
年間 も英語を勉強 したのに、ろ くに話す ことも出来ず、 また書 くことさ
え覚束ない とい う厳 しい批判 を英語教師は常に受けて きた。
今 日、英語教育 のあり方 について激 しい論争がなされているが、これらの論争
は実際に現場 で教 えている先生方のなまの意 見、あるいは現状を無視 して行われ
ているのではないか。現場の実情を把握するために、関東、京都、北海道で教え
ている中学校の英語教師
20
人、高校の英語教師
32
人にアンケートをとってみた。
まず最初に生徒の英語の り,
スニング、ス ピーキングが出来ない原因は、現在
一般に伺い られている教授法に帰するか とい う質問に、
7
0%
近 くの先生が同意
している。ではその教授法 とは何か。中学校では
20%
、高校では
66%
の先生
が、訳 ・文法を中心 と した教授法が一般的に教室で行われていると答 えている。
これは中学校では口頭練習が重視 されているが、高校では一つの型 にはまった
大学受験一辺倒 の授業がな されていることを示 している。またアンケー トの結
果、学年が上が るにつれて口頭練習にか ける時間が減 り、代 りに訳 ・文法に授
業時間の多 くが費や される傾向が示 されている。
- 7
5
-沖縄 大学紀要第
3号 (1983
年 )
では生徒 の リスニングとスピーキングを向上 させるには どうしたらよいのか。
70
%以上の英語の先生が、現在の教育状況を何 らかの方法で変 えていく必要があると
考えている。さら
に 70%
の先生が、今よりもっと口頭練習 に時間を使 うべ きであると
認識 している。にもかかわらず、現実にはいろいろな制約 のために出来ないというジ
レンマの状態 にある。ではどのような制約があるのか.
3
つの観点から考 えてみたい。
第
1
に高校J大学 の受験対策 の影響がある。入学試験 には リスニングとスピ
ーキ ングのテス トはほとん ど行われていないので、教師 は訳 ・文法に授業時間
の大半 を使 って しま う。調査 した英語教師
66%
が、高校、あるいは大学受験の
準備のために授業活動が大 き く制約 されると答 えてい る。
第
2
の理 由は、英語教師 自身 リスニングとスピーキングを教 えるのに困難が あるこ
と。リスニン
グ
とスピーキングを教 える自信があると答 えた先生 は、中学校では
40
0
/
O
、高校の教師 ではわずか
160
/
O
に過 ぎないoこれは高校 の教科書が訳・
文法中心に
構成 されているので、高校教師 は教科書 を用いてリスニングとスピーキングを教える
のが難 しい と思っているからである。また多 くの英語教師 が リスニングとスピーキン
グを向上 させるために、イギリスか アメリカに
1
年近 く留学 したいと述べている。
最後 に、 これは英語教師に限ったことではないが、中学校、高校の教師はク
ラス運営、生活指導、 クラブ指導、会議、運動会、文化祭 の準備で毎 日が多忙
である。文部省 は 「ゆ と りあ る教育」 とい う理由で、昭和
56
年 より中学 の英語
の時間数 を週
3
時間 に削減 した。 その結果、教師 は前 と同 じ時間数を教 えるた
めに受 け持 ちクラスが増 え、 さ らに忙 しくなってい る。 およそ半数の教師が忙
し過 ぎて充分 に授業 の準備をす る時間がないと言 ってい る。 口頭練習 をさせる
ためには訳 ・文法 を教 えるよ りも多 くの準備時間が必要 とされるので、教師は
忙 しさにまかせて慣 れた訳 と文法中心 の授業を して しま うの である。
以上
3
つの どれ をとってみて も簡単に解決できる問題ではない。 しか し今 日
の小 さ くな りつつあ るあるいは複雑な世界情勢 を考慮 した時、英語教師 はその
責任の重大 さを再認識す る必要が ある。 いっまで も現実 の問題を無祝 し、机上
-7
6-^(198330
Junior and Senior High School
English Teachers1 Dilemma
Tatsuo Taira
TABLE OF CONTENTS
I. INTRODUCTION
II. METHODS AND PROCEDURES III. RESULTS OF A QUESTIONNAIRE
IV. CONCLUSIONS
APPENDICES
A.
Questionnaire Used in This Study
B. Statistical Results of the Questionnaire
INTRODUCTION
The purpose of this paper is to analyze
the attitudes and English teaching methods
of the Japanese teachers of English of
secondary school by using a Questionnaire.
The paper mainly discusses the following
points:
-198330
1.
The effects of English class activities
by entrance examinations of high schools
or universities.2.
English teachers1 difficulties in teaching,
listening and speaking in class.3.
The need of more time to prepare for
classes.4.
The attitudes of English teachers toward
the recent reduction of lessons per week
in junior high schools.5.
Students1 psychological disadvantages in
learning English.METHODS AND PROCEDURES
First of all, the author made a list of names which
mostly consisted of some Japanese contacts of the author.
These were the people to whom qestionnaires were sent from
the U.S.A.. Some of them are English teachers at junior
or senior high schools. One hundred questionnaires were
prepared and sent to the names on the list in the middle
of January, 1982. The people who received questionnaires
were asked to distribute them to English teachers at
junior or senior high schools. Fifty questionnaires out of
100 were supposed to go to junior high school English
teachers and the other 50 questionnaires were to senior high
school English teachers.
By the beginning of March, 52 questionnaires had been
received in all:
20 questionnaires from junior high school
English teachers and the other 32 questionnaires from senior
high school teachers (see Table 1).
The answers came from
the English teachers of the schools in the following pre
fectures:
Tokyo, Kanagawa, Saitama, Chiba, Tochigi, Kyoto,
Aomori, and Hokkaido.
-78--§• ( 1983 *p)
TABLE 1: PARTICIPANTS
I. 1. Type of class
Junior High School English Teachers Senior High School English Teachers Total Participants 20/50 32/50 52/100 Response Percent 40.0 64.0 52.0
The questionnaires (see Appendix A) consisted of four major sections. The first section asked for general infor mation such as type of school and class hours per week. In section 11/ the teachers were asked their philosophy and statements of belief, based on two parts of general questions and personal questions. The statements were rated in the
following manner:
1 (strongly disagree); 2 (disagree);
3 (not sure); 4 (agree); 5 (strongly agre).
Section III
contained English skills and class activities. Lastly section IV, V, VI, and VII permitted the teachers to discuss the following: IV. The testing of listening comprehension and speaking ability; V. The translation method; VI.English teaching methods as training; VII. English education in general.
THE RESULTS OF THE QUESTIONNAIRE
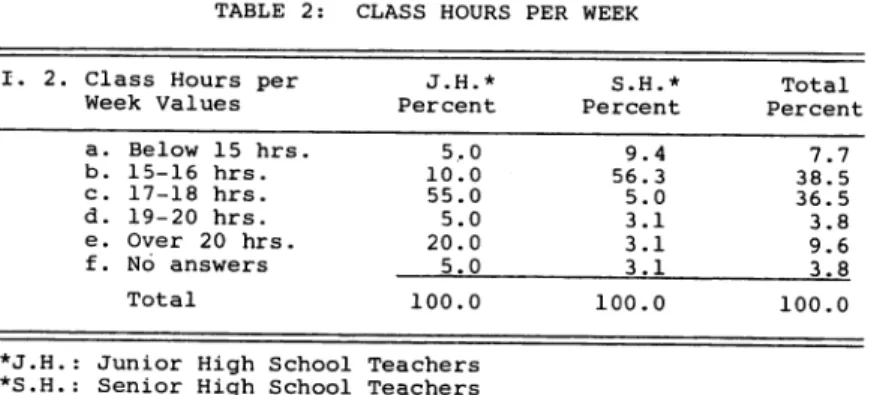
Table 2 indicates that over half of junior high school English teachers have from seventeen to eighteen class hours and in senior high school/ over half of the English teachers have from fifteen to sixteen class hours per week.
-79-TABLE 2: CLASS HOURS PER WEEK
I. 2. Class Hours per
J.H.*
S.H.*
Total
Week Values
Percent
Percent
Percent
a. b. c. d. e. f. Below 15 hrs. 15-16 hrs. 17-18 hrs. 19-20 hrs. Over 20 hrs. No answers Total 5.0 10.0 55.0 5.0 20.0 5.0 100.0 9.4 56.3 5.0 3.1 3.1 3.1 100.0 7 38 36 3 9 3 100 .7 .5 .5 .8 .6 .8 .0
*J.H.: Junior High School Teachers
*S.H.: Senior High School Teachers
Table 3 reveals that over half of both junior and
senior high school teachers feel some pressure to use their
class hours for preparing their students for the entrance
examinations of high school or universities.
TABLE 3: EFFECT OF ENTRANCE EXAMINATIONSII.
Question
Combined percent responding
"agree" and "strongly agree"
J.H. S.H. Total
11. The free activities of the
English classes arelargely-limited by the need to prepare
my students for the entrance examinations of high schoolsor universities.
55.0
62.5
59.6
1-strongly disagree; 2-disagree; 3-not sure; 4-agree;
5-strongly agree
Table 4 discloses that listening comprehension and
speaking ability are not tested very much in the entrance
examinations of universities.
In high school entrance
examinations, 38 percent of both junior and senior high
school teachers agree that only a written test like grammar
or translation is used.
-80-TABLE 4:
LISTENING COMPREHENSION AND SPEAKING
ABILITY IN THE ENTRANCE EXAMINATIONSII.
Questions
Combined percent responding
"agree" and strongly agree"
J.H. S.H. Total
L. Universities have a tendency
to use the testing of listening
comprehension in the entrance
examinations. 25.0 31.0 34.6
I. Universities have a tendency
to use the testing of speaking
ability in the entrance
examinations.
10.0
15.6
13.5
3. In high school entrance
examinations, only a written
test like grammar or trans
lation is used.
30.0
43.8
38.5
1-strongly disagree; 2-disagree; 3-not sure; 4-agree; 5-strongly agree
Table 5 indicates that in senior high schools, the
dominant teaching method is the translation method, but in
junior high school, teaching methods seem to vary.
In
addition, over sixty percent of both junior and senior
English teachers tend to teach English grammar analytically.
TABLE 5: THE PRESENT ENGLISH TEACHING METHOD
II. Questions Combined percent responding
"agree" and "strongly agree"
J.H. S.H. Total 4. The present teaching method
most used in the classroom
is the translation method. 20.0 65.5 48.0
5. Teachers tend to teach
English grammar analytically. 70.0 62.5 65.4
1-strongly disagree; 2-disagree; 3-not sure; 4-agree;
5-strongly agree
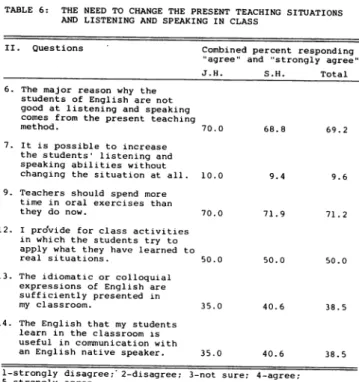
-As can be noted from Table 6, over two-thirds of both
junior and senior high school English teachers think that
the students1 inadequate listening and speaking contribute
to the present teaching method.
Furthermore, over seventy
percent of English teachers feel that they should emphasize
more oral exercises in class, and that some measure should
be taken in the present system of English instruction in
order to improve the students' communicative abilities such
as listening and speaking.
The questions 12, 13, and 17
point out that the English which teachers are teaching in
class is not so practical that the students can communicate
with English native speakers.
TABLE 6: THE NEED TO CHANGE THE PRESENT TEACHING SITUATIONS
AND LISTENING AND SPEAKING IN CLASS
II. Questions ' Combined percent responding
"agree" and "strongly agree" J-H. S.H. Total
6. The major reason why the
students of English are not
good at listening and speaking
comes from the present teaching
method. 70.0 68.8 69.2 7. It is possible to increase
the students' listening and speaking abilities without
changing the situation at all. 10.0 9.4 9.6 9. Teachers should spend more
time in oral exercises than
they do now. 70.0 71.9 71.2 12. I pro'vide for class activities
in which the students try to apply what they have learned to
real situations. 50.0 50.0 50.0 13. The idiomatic or colloquial
expressions of English are sufficiently presented in
my classroom. 35.0 40.6 38.5 14. The English that my students
learn in the classroom is
useful in communication with
an English native speaker. 35.0 40.6 38.5 1-strongly disagree;' 2-disagree; 3-not sure; 4-agree;
5-strongly agree
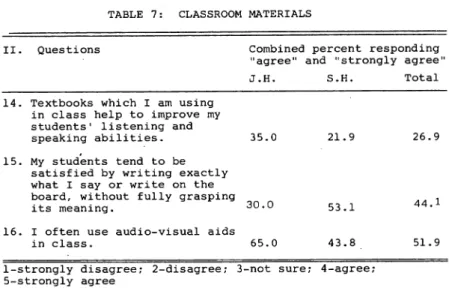
-82-Table 7 reveals that textbooks are not designed for
improving the students' listening and speaking abilities.
Among junior high school English teachers,
thirty
percent and among senior high school teachers, fifty-three
percent feel that the students tend to be satisfied by
writing exactly what the teachers say or write on the board,
without fully grasping its meaning.
Over sixty percent of junior high school English teachers
often use audio-visual aids in class.
However, among senior
high school teachers, only forty-four percent often use
audio-visuals aids.TABLE 7: CLASSROOM MATERIALS
II. Questions Combined percent responding
"agree" and "strongly agree"
J.H. S.H. Total
14. Textbooks which I am using in class help to improve my students' listening and
speaking abilities. 35.0 21.9 26.9
15. My students tend to be satisfied by writing exactly what I say or write on the
board, without fully grasping 1
its meaning.
30.0
53-1
44.1
16. I often use audio-visual aids
in class. 65.0 43.8 51.9
1-strongly disagree; 2-disagree; 3-not sure; 4-agree;
5-strongly agree
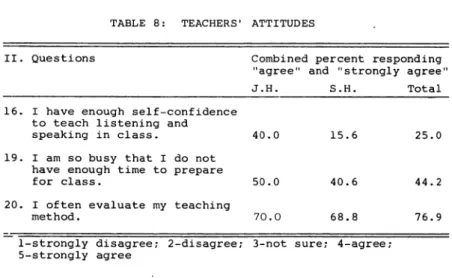
Table 8 indicates that many English teachers seem to
confront difficulties in teaching listening and speaking in
class.
Forty percent of the junior high school English
teachers surveyed have enough self-confidence for teacher
-83-listening and speaking, and in senior high school English teachers, only sixteen percent have enough self-confidence.
Half of the junior high school teachers answer that they do not have enough time to prepare for class in the first year, in which English lessons have been reduced
from four to three lessons per week.
Among senior high
school English teachers, forty-one percent feel that they -are too busy.Question 20 points out that most English teachers have enthusiasm for improving their teaching methods in the present situations.
TABLE 8: TEACHERS' ATTITUDES
II. Questions Combined percent responding
"agree" and "strongly agree" J.H. S.H. Total
16. I have enough self-confidence
to teach listening and
speaking in class. 40.0 15.6 25.0
19. I am so busy that I do not
have enough time to prepare
for class. 50.0 40.6 44.2
20. I often evaluate my teaching
method. 70.0 68.8 76.9
1-strongly disagree; 2-disagree; 3-not sure; 4-agree;
5-strongly agree
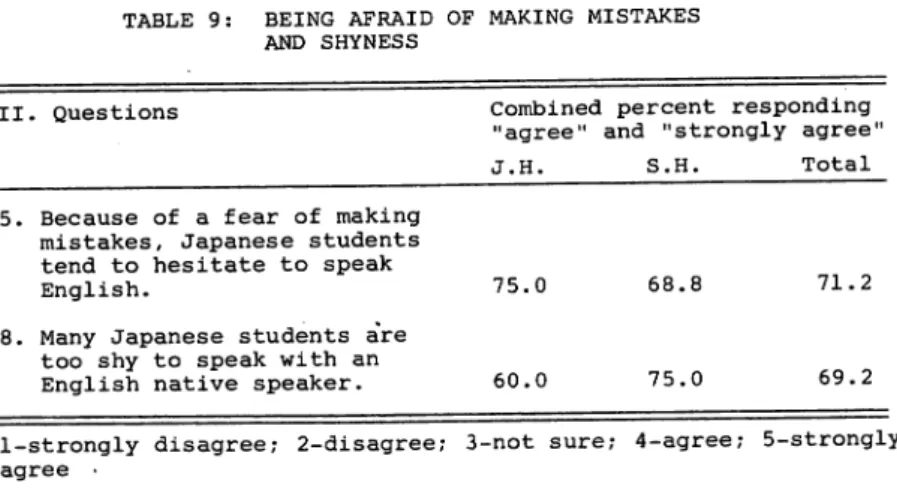
Table 9 discloses that over two-thirds of English teachers of both junior and senior high schools believe that the students tend to hesitate to speak English for fear of making mistakes. Furthermore, an analysis of the data
84-indicates that the students are too shy to speak with
English native speakers.TABLE 9: BEING AFRAID OF MAKING MISTAKES
AND SHYNESS
II. Questions
Combined percent responding
"agree" and "strongly agree"
J.H. S.H. Total
5. Because of a fear of making mistakes, Japanese students tend to hesitate to speak
English.
75.0
68.8
71.2
8. Many Japanese students aVe
too shy to speak with an
English native speaker.
60.0
75.0
69.2
1-strongly disagree; 2-disagree; 3-not sure; 4-agree; 5-strongly
agree •Table 10 indicates that over half of both junior and
senior high school English teachers think that the students1
best skill in English is generally reading. In addition, overforty percent of English teachers feel that the students1
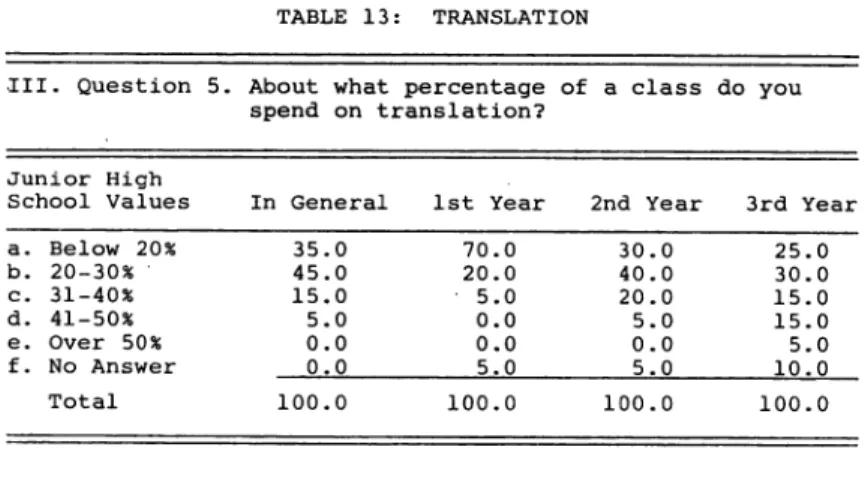
worst skill in English is speaking.As can be noted from Tables 11, 12, and 13, oral work
(pronunciation drill, oral introduction, pattern practice, and question-answering) of a class tends to decrease inaccordance with the increase of the grade.
In the explanation
of English grammar and translation, the opposite things
happen, that is, the explanation of English grammar and
translation in a class increase in accordance with the increase of the grade.
-85-TABLE 10: THE BEST AND WORST SKILLS OF ENGLISH III. Question 1. Which English skill do you think your
students are best at in general?
Values J.H. Percent 5.0 15.0 55.0 15.0 10.0 0.0 0.0 S.H. Percent 3.1 3.1 53.1 18.8 9.4 9.4 3.1 Total Percent 3.. 8 7.7 53.8 17.3 9.6 5.8 1.9 a. Listening b. Speaking c. Reading d. Writing e. Grammar Analysis f. Other g. No Answers Total 100.0 100.0 100.0
Question 2. Which English skill do you think your
students are worst at in general?
Values J.H. Percent 15.0 45.0 0.0 20.0 10.0 5.0 5.0 S.H. Percent 25.0 37.5 3.1 18.8 9.4 0.0 6.3 Total Percent 21.1 -40.4 1.9 19.2 9.6 1.9 5.8 a. Listening b. Speaking c. Reading d. Writing e. Grammar Analysis f. Other g. No Answers Total 100.0 100.0 100.0
TABLE 11: ORAL WORK
III. Question 3. About what percentage of a class do you spend on oral work (pronunciation drill, oral introduction, pattern practice, question-answering?)
Junior High
School Values In General 1st Year 2nd Year 3rd year a. Below 20% b. 20-30% c. 31-40% d. 41-50% e. Over 50% f. No Answers Total 15.0 40.0 30.0 15.0 0.0 0.0 100.0 10.0 10.0 20.0 25.0 30.0 5.0 100.0 20.0 30.0 35.0 15.0 0.0 0.0 100.0 35.0 40.0 15.0 0.0 0.0 10.0 100.0
-
86-Senior High
School Values In General 1st Year 2nd Year 3rd Year a. b. c. d. e. f. Below 20% 20-30% 31-40% 41-50% Over 50% No Answers Total 37.5 37.5 15.6 0.0 3.1 6.3 100.0 31.3 34.4 12.5 12.5 3.1 6.3 100.0 34.4 40.6 9.4 3.1 0.0 12.5 100.0 59.4 18.8 3.1 3.1 0.0 15.6 100.0
TABLE 12: THE EXPLANATION OF ENGLISH GRAMMAR
III. Question 4.
Junior High School Values
About what percentage of a class do you spend on the explanation of English grammar?
In General 1st Year 2nd Year 3rd Year Below 20% 20-30% 31-40% 41-50% Over 50% No Answers Total 10 35 50 5 0 0 .0 .0 .0 .0 .0 .0 45.0 30.0 15.0 0.0 0.0 10.0 5.0 55.0 30.0 10.4 0.0 0.0 0.0 30.0 20.0 40.0 0.0 10.0 100.0 100.0 100.0 100.0 Senior High
School Values In General 1st Year 2nd Year 3rd Year Below 20% 20-30% 31-40% 41-50% Over 50% No Answers Total 3.1 40.6 31.3 21.9 3.1 0.0 12.5 37.5 31.3 12.5 3.1 3.1 3.1 40.6 25.0 21.9 3.1 6.3 3.1 31.3 15.6 28.1 9.4 12.5 100.0 100.0 100.0 100.0
-87-TABLE 13: TRANSLATION
III. Question 5. About what percentage of a class do you
spend on translation?
Junior High
School Values In General 1st Year 2nd Year 3rd Year
a. b. c. d. e. f. Below 20% 20-30% 31-40% 41-50% Over 50% No Answer Total 35.0 45.0 15.0 5.0 0.0 0.0 100.0 70.0 20.0 5.0 0.0 0.0 5.0 100.0 30.0 40.0 20.0 5.0 0.0 5.0 100.0 25.0 30.0 15.0 15.0 5.0 10.0 100.0 Senior High
School Values In General 1st Year 2nd Year 3rd Year
a. b. c. d. e. f. Below 20% 20-30% 31-40% 41-50% Over 50% No Answers Total 0.0 12.5 31.3 34.4 21.9 0.0 100.0 3.1 18.8 34.4 21.9 18.8 3.1 100.0 0.0 9.4 37.5 28.1 15.6 9.4 100.0 0.0 6.3 21.9 37.5 18.8 15.6 100.0
The main answers of Question IV, V, and VI are the
followings:Question IV.
(How do you test listening comprehension
and speaking ability?)Answers: a. Question-Answering b. Dictation
c. By using a cassette tape recorder or a language laboratory room
Most teachers say that they do not test
the listening and speaking abilities.
-88-Question V. (What do you think is the main problem with the translation method and how can the teacher solve the problem?)
Answers: With the translation method the students
spend most of time in learning Japanese,
not English itself. It's like a Japanese
lesson. We can solve this problem by
helping the students to imagine the
situation of the text with the rapid
reading method, by emphasizing creative
writing, and by using the methods of
dramatization and dialogue, (a senior
high school teacher)
The biggest problem, I think is that students tend to aim at translation itself and do not read English itself so much. But in order
to check students1 understanding of English,
translation is useful.
So we should try to
use the translation method properly and save
time to train them in the field of morepractical English.
(a senior high school
teacher)As it is generally said, the students learn NOT "living English" itself but ABOUT English, so they find themselves understood
in it.
(a senior high school teacher)
Some English teachers point out the same thing: As students try to translate English into
Japanese, emphasizing the meaning of each
word, they often have a difficulty in
grasping the context of stories as a whole.
(Tr. by author)
Question VI. (In your own training to be an English teacher, what method(s) was (were) emphasized?)
Answers: a. The Direct Method
b. The Oral Approach c. The Translation Method
-89-CONCLUSION
The effects on English-class activities from high school
or university entrance examinations.
It is an undesirable fact that over half of both
junior and senior high school English teachers are teaching
English through class activities that are limited by the
need to prepare their students for entrance examinations
to high school or universities (see Table 3).
This effect
can be made clearer from another fact, namely, that the
proportion of oral work in the classroom decreases as
entrance examinations draw nearer.
On the other hand, the
proportions of the explanations of English grammar and
translation in a class increases at that time (see Table
11, 12, and 13).A senior high school teacher says about the present
entrance examination system'.It is often said that present entrance examination
system distorts English education in Japan.
I
agree with this opinion.
I want to make my students
really enthusiastic about learning English.
But when
I think about the progress o£ classes and the
preparing of entrance examinations for my students,
the free class activities are influenced.
(Tr. by author)
Many English teachers seem to be faced with the conflict
of wanting to emphasize more oral exercises in class, but
being unable to because they have to spend more time to
prepare their students for entrance examinations (see Table 6)
Another high school teacher comments on the present
teaching situations:I believe it is time that something should be done;
drastic measures should be taken toward the improve
ment of the present rather traditional situation of English teaching so that the students will be able to enjoy talking with English speaking people after their graduation from high schools.90-^(1983 30
English teachers have some difficulties in teaching listening and speaking in class.
With respect to the teachers' abilities in listening
and speaking, most English teachers do not have enough self-confidence to teach listening and speaking in the classroom.
Especially this is a serious problem for high school English
teachers (see Table 8).
Some English teachers say the same thing:
English teachers, themselves, cannot speak English well. So all of the English teachers should be
given a chance to go abroad for a year or so to brush up their English.
(Tr. by author)
English teachers need more time to prepare for classes. Almost half of the English teachers feel that they are so busy with various duties that they do not have enough time to prepare material in advance (see Table 8).
A junior high school English teacher says: It is desirable to introduce a new sentence
pattern using vocabularies which students already know, not introducing a pattern by directly explaining English grammar first. However, when I actually teach in class, I mainly tend to use Japanese in order to explain grammar. I know this is not a good method to teach English grammar and
I have to study more teaching methods. But I am so
busy with the guiding of students' life and the operation of my classroom that I cannot prepare for
classes well.
(Tr. by author)
The attitudes of English teachers toward the recent reduction of lessons per week in junior high schools.
The following are opinions of junior high school English teachers concerning the reduction of lessons from four to three lessons per week during 1981.
It is very difficult to improve students' listening and speaking abilities and make themselves understood to the class in the classroom which consists of forty-five
-students To make matters worse, the reduction of lessons from four to three lessons just increases the number of students who cannot maintain pace with the class. As repetition is required in learning a foreign language, every day practice is desirable, even in a short period. (Tr. by author)
Another teacher says that English classes in junior high school have been decreased to three hours since 1981:
"So we face many difficulties in teaching effectively and enjoyably. The students have too many things to learn in a very limited class hour. The contents should be more carefully selected, so that the students can acquire them more easily."
Students' psychological disadvantages in learning English. With respect to the psychological aspects of the students, most English teachers believe that Japanese students tend to be afraid of making mistakes and are too shy to speak with English native speakers (see Table 9). This can be said to be one of the biggest disadvantages in learning a foreign language. It is almost impossible to master a foreign language without making mistakes. The English teachers should know the reasons to which these psychological disadvantages are attributed.
In summary, the author strongly feels that the Japanese teachers of English face a dilemma and are subjected to harsh criticism. They seem to be eager to take some action to solve the various problems which
are deeply rooted in the present English education in Japan. It is hoped that their enthusiasm may solve these various
problem.
92-APPENDIX A: QUESTIONNAIRE USED IN THIS STUDY
I. Please circle the appropriate letter in each of the following two questions:
1. Type of school: a. Junior high school
b. Senior high school 2. Class hours per week: a. below 15 hrs.
b. 15-16 hrs. c. 17-18 hrs. d. 19-20 hrs. e. over 20 hrs.
II. Please rate each statement below using the following scale: 1 - strongly disagree
2 - disagree 3 - not sure
4 - agree
5 - strongly agree
General questions: Answer on the basis of what you think
most teachers feel.
1. Universities have a tendency to use the testing
of listening comprehension in the entrance examinations. 2. Universities have a tendency to use the testing of
speaking ability in the entrance examinations. 3. In high school entrance examinations, only a written
test like grammar or translation is used.
4. The present teaching method most used in the classroom
is the translation method.
5. Because of a fear of making mistakes, Japanese students tend to hestitate to speak^ English.
6. The major reason why the students of English are not good at listening and speaking comes from the present teaching method.
7. It is possible to increase the students' listening and speaking abilities without changing the present teaching situation at all.
8. Many Japanese students are too shy to speak with an English native speaker.
9. Teachers should spend more time in oral exercises than they do now.
10. Teachers tend to teach English grammar analytically.
-93-Personal questions: Answer on the basis of your own
teaching practices and self-evaluation.
1. The free activities of the English classes are
largely limited by the need to prepare my students for the entrance examinations of high schools or universities.
2. I provide for class activities in which the students try to apply what they have learned to real situations. 3. The idiomatic or colloquial expressions of English
are sufficiently presented in my classroom.
4. Textbooks which I am using in class help to improve my students1 listening and speaking abilities. 5. My students tend to be satisfied by writing exactly
what I say or write on the board, without fully grasping its meaning.
6. I have enough self-confidence to teach listening and speaking in class.
7. The English that my students learn in the classroom is useful in communicating with an English native speaker.
8. I often use audio-visual aids in class.
9. I am so busy that I do not have enough time to prepare for class.
10. I often evaluate my teaching method.
III. Please answer the following questions by circling the letter representing the best answers.
1. Which English skill do you think your students are best at in general? a. Listening b. Speaking c. Reading d. Writing e. Grammar Analysis f. Other
2. Which English skill do you think your students are worst at in general? a. Listening b. Speaking c. Reading d. Writing e. Grammar Analysis f. Other
94
-3. About what percentage of a class do you spend on oral
work (pronunciation drill, oral introduction, pattern
practice, question-answering)? In a. b. c. d. e. aeneral Below 20% 20-30% 31-40% 41-50% Over 50% lsi a. b. c. d. e. b year Below 20% 20-30% 31-40% 41-50% Over 50% 2nd a. b. c. d. e. year Below 20% 20-30% 31-40% 41-50% Over 50% 3 a b c d e rd year . Below 20% . 20-30% . 31-40% . 41-50% . Over 50%
4. About what percentage of a class do you spend on the explanation of English grammar?
In a. b. c. d. e. general Below 20% 20-30% 31-40% 41-50% Over 50% a. b. c. d. e. Below 20% 20-30% 31-40% 41-50% Over 50% a. b. c. d. e. Below 20% 20-30% 31-40% 41-50% Over 50% a. b. c. d. 3. Below 20% 20-30% 31-40% 41-50% Over 50% 5. About what percentage of a class do you spend on
translation? In aeneral a. Below 20% b. 20-30% c. 31-40% d. 41-50% e. Over 50% a. b. c. d. e. Below 20% 20-30% 31-40% 41-50% Over 50% a. b. c. d. e. Below 20% 20-30% 31-40% 41-50% Over 50% a. b. c. d. e. Below 20% 20-30% 31-40% 41-50% Over 50%
IV. How do you test listening comprehension and speaking
ability? (answer in Japanese or in English)
V.
What do you think is the main problem with the translation
method and how can the teacher solve the problem?VI. In your own training to be an English teacher, what method(s) was (were) emphasized?
VII. Any comment on English education in Japan,
(use back of sheet if desired)
-95-*( 19 83*0
APPENDIX B:
STATISTICAL RESULTS OF THE QUESTIONNAIRE
Statistical Results 7. 8. 9. 10. J.H. S.H. J.H. S.H. J.H. S.H. J.H. S.H. Values Percent Percent Values Percent I. 1. J.H.: 2. J.H.: S.H. :II. General Questions
1. J.H.
S.H. 2. J.H. S.H. 3. J.H. S.H. 4. J.H. S.H. 5. J.H. S.H. 6. J.H. S.H. 20/50: 40% S.H.: 32/50: 64% 0 5.0 3.1 0 5.0 0.0 5.0 0.0 0.0 0.0 0.0 0.0 0.0 0.0 0.0 0.0 0.0 0.0 0.0 0.0 0.0 0.0 0.0 0.0 Personal Questions J.H. S.H. J.H. S.H. J.H. S.H. 0.0 3.1 5.0 3.1 0.0 0.0 a 5.0 9.4 1 10.0 0.0 35.0 15.6 10.0 12.5 10.0 3.1 0.0 0.0 0.0 0.0 15.0 28.1 0.0 0.0 0.0 0.0 0.0 0.0 0.0 0.0 5.0 0.0 5.0 3.1 b 10.0 56.3 2 20.0 56.3 35.0 56.3 55.0 28.1 50.0 9.4 5.0 9.4 30.0 3.1 55.0 50.0 35.0 12.5 5.0 9,4 10.0 15.6 30.0 15.6 20.0 25.0 20.0 31.3 c 55.0 25.0 3 40.0 12.5 15.0 12.5 5.0 15.6 20.0 21.9 20.0 21.9 0.0 28.1 20.0 12.5 5.0 12.5 25.0 18.8 20.0 21.9 15.0 18.8 20.0 21.9 40.0 25.0 d 5.0 3.1 20.0 21.9 5.0 12.5 25.0 28.1 15.0 53.1 40.0 34.4 55.0 53.1 10.0 9.4 30.0 50.0 45.0 53.1 50.0 53.1 40.0 53.1 50.0 40.6 35.0 40.6 20.0 3.1 5 5.0 9.4 5.0 3.1 5.0 15.6 5.0 12.5 35.0 34.4 15.0 15.6 0.0 0.0 30.0 25.0 25.0 18.8 20.0 9.4 15.0 9.4 0.0 9.4 0.0 0.0-96-ill. 4. J.H.: 0.0 S.H.: 0.0 5. J.H.: 0.0 S.H.: 3.1 6. J.H.: 0.0 S.H.: 0.0 7. J.H.: 0.0 S.H.: 0.0 8. J.H.: 0.0 S.H.: 0.0 9. J.H.: 0.0 S.H.: 0.0 10. J.H.: 0.0 S.H.: 0.0 1. J.H.: Values 0 Percent 0.0 S.H.: 3.1 2. J.H.: 5.0 S.H.: 6.3 3. J.H.: Ingeneral 0.0 S.H.: ' " J.H. : S.H.: J.H.: 2nd year 0.0 S.H.: " " " J.H.: 3rd year 10.0 S.H. * - ' 6.3 1st year 0.5 6.3 0.0 12.5 10.0 15.6 0.0 0.0 10.0 6.3 5.0 3.1 10.0 12.5 0.0 12.5 0.0 9.4 10.0 15.6 0.0 0.0 5.0 3.1 15.0 25.0 15.0 37.5 10.0 31.3 20.0 34.4 35.0 59.4 4. J.H.: In general 0.0 10.0 S.H.: 0.0 3.1 J.H.: 1st year 10.0 45.0 S.H.: 3.1 12.5 J.H.: 2nd year 0.0 5.0 S.H.: 6.3 3.1 J.H.: 3rd year 10.0 S.H. : 12.5 5. J.H.: In general 0.0 S.H. : 0.0 .H.: 1st year 5.0 S.H. 3.1 .H.: 2nd year 5.0 S.H. : 9.4 0.0 3.1 35.0 0.0 70.0 3.1 30.0 0.0 30.0 46.9 40.0 21.9 25.0 31.3 J.H.: 3rd year 10.0 25.0 S.H.: 15.6 0.0 25.0 40.6 35.0 34.4 10.0 9.4 b 15.0 3.1 45.0 37.5 40.0 37.5 10.0 34.4 30.0 40.6 40.0 18.8 35.0 40.6 30.0 37.5 55.0 40.6 30.0 31.3 45.0 12.5 20.0 18.8 40.0 -9.4 30.0 6.3 25.0 25.0 25.0 ' 18.8 25.0 40.6 35.0 30.0 31.3 15.6 10.0 6.3 5.0 9.4 20.0 21.9 c 55.0 53.1 0.0 3.1 30.0 15.6 20.0 12.5 35.0 9.4 15.0 3.1 50.0 31.3 15.0 31.3 30.0 25.0 20.0 15.6 15.0 31.3 5.0 34.4 20.0 37.5 15.0 21.9 25.0 18.8 20.0 40.6 35.0 12.5 35.0 28.1 55.0 37.5 25.0 34.4 55.0 59.4 d 15.0 18.8 20.0 18.8 15.0 0.0 25.0 12.5 15.0 3.1 0.0 3.1 5.0 21.9 0.0 12.5 10.0 21.9 40.0 28.1 5.0 34.4 0.0 21.9 5.0 28.1 15.0 37.5 10.0 3.1 10.0 12.5 5.0 3.1 0.0 12.5 10.0 6.3 25.0 6.3 15.0 9.4 e 10.0 9.4 10.0 9.4 0.0 3.1 30.0 3:1 0.0 0.0 0.0 0.0 0.0 3.1 0.0 3.1 0.0 3.1 0.0 9.4 0.0 21.9 0.0 18.8 0.0 15.6 5.0 18.8 f 0.0 9.4 5.0 0.0