The Effect of pH from Simulated Acid Rain on Multi- Element Contents of Leaves, Stems and
Roots of the Crops
Osamu Fujino*,
Masahiko Maekawa , Tatsuo Kawahigashi*, Yuzuru Nakaguchi**and Hideo YamazakiTakeshi Minami**,
**
*R esearch Institute for Science and Technology, Kinki University, Kowakae, Higashi-Osaka 577-8502, Japan
**F aculty of Science and Technology, Kinki University
(Received, December 21, 2005)
Abstract
In this study, simulated acid rain in which the pH differs was sprinkled on crops for 1 week. The concentrations of Mg, Ca, K, P , Fe and Zn in the leaves, stems and roots of these crop plants was determined by ICP atomic emission spectrometry. As a result, it was shown that many elements were easily released from the crops, as the pH was lowered.
However, it became clear that Fe ion was very easily absorbed by each part of the plant at pH 5.6, though the level was decreased at pH 4.7 or less.
Keywords: leaf, stem and root of crops, essential element, inorganic ion, simulated acid rain
1. Introduction
Recently, forest have withered due to acid rain or acidic mist, and the effect on cultural assets has become a large social problem.Cases in which the soil has become acidifiedand casesinwhich acid rain directly falls on the plant9-14are considered the path ways by which plants are affected by acid rain. Extensive research on plant growth and the absorption, storage and release ofions has examined the effect of acidified soill-g. Regarding the direct effect of acid rain falling on plants, however, only researcho
14n the yield point of crops has been carried outIt is known that organic substances and inorganic ions like calcium and
potassium are released from each part of the plant by rain3. However, there is limited research
on theyeffects of acid rain at various pH
levels2'3. Therefore, Kaiware daikon (radish:
Raphnus sativus), Alfalfa (pulse :Medicago sativa) and Tohmyo (pea: Pisum sativum) grown from a plant height of several cm to about 10 cm as an experimental crop were used this study.
During germination and growth of these crops, simulated acid rain of various pH levels were sprinkled on these seeds and the seedlings were grown for one week. Magnesium (Mg), calcium (Ca), potassium (K), phosphorus (P), iron (Fe) and zinc (Zn) concentrations in each part of the
leaf, stem and root of these crops were measured by inductively coupled plasma atomic emission spectrometry (ICP -AES).
As a result, it is reported, data were obtained 2. Experimental design
2.1 Formation of simulated acid rain
Simulated acid rain for this study was prepared by dissolving known quantities3 of various salts in pure water, and the solutions containing salt were respectively adjusted using inorganic acid to pH 5.6, 4.7, 4.0 and 3.5.
2.2 Growth and decomposition procedure of the crops
Rainfall test equipment of simulated acid rain used during germination and growth of crops is shown in Fig. 1. Panel.1 of Fig.1 shows a thin plastic vessel (base area: 47.8 cm2 10 heights cm) with 30 empty holes measuring about 1 mm diameter. Such containers were sown with 1 to lOg of seed. These crops were grown under 20°C room temperature, 12000Lx optical intensity and about 70% humidity and were sprinkled with simulated acid rain from many holes measuring about 1 mm in diameter as shown in Panel 4 of Fig. 1. One cup of water was sprinkled on the crops 4 times at a rainfall speed 140m1 /10sec for 3. Result and Discussion
3.1 Amount of rainfall used for the experiment.
The quantity of natural rain over 1 year averages 1800 liters/m2, namely 1800mm annual.
This becomes about 15 mm/day, assuming that rainfall occurs on 1/3 of days (120th) over the year. This experiment used a move severe rain level than natural, as described in 2.2, because the test amount was 117mm of rainfall. However, rainfall of this degree was required using this experimental equipment to prevent the crops
from becoming withered
3.2 The effect of the simulated acid rain on multi-element content in each part of the crop plant grown for 1 week.
showing a relationship between the
concentrations of ions in the crop and the pH of simulated acid rain.
1 day. For decomposition of the crop before the measurement, 1 g of leaf, stem or root was respective placed in a glass container, and then decomposed by inorganic acids. The resultant plant material was then dissolved in 100m1
(10mg/ml) of the pure water. Ions in these sample solution were measured by ICP-AES, after being diluted with pure water 10-100 times.
;..I
Rain'tct t of.-td acid. r.. I : Seed of croiN,":*lie 1F9d.3 simulakd acidrain, 4:samiatedacid niinall eq-€;.5::suctionpt.rttsi.mt l ttNi acidmin.
3.2.1 The effect of simulated acid rain on the germination and growth of crop
The pH of rain differs regionally around the world, and the pH of uncontaminated rain is 5.6.
Average pH of recent rain water was 4.7 and in places that are more contaminate the rainfall maybe pH 4-3.5. Therefore, the effect on germination and growth crop of this simulated acid rain was investigated within a range of pH pH 5.6-3.5. The degree of effect on crop growth was represented as a ratio to the sum total of the
size of stem and leaf grown at pH 5.6 simulated rain as the standard. Naturally, the standard size differs with the crop. The standard size for Kaiware daikon was 8-11 cm. For Alfalfa and Tohmyo, standard sizes were 4-5.5 and 7-9 cm
-~ )-
respectively. As a result, there was relatively little the change at pH 4.7. However, there was about
10-25% decrease at pH 4.0 and a sharp decrease of 30-50% at pH 3.5.
3.2.2 The effect of the pH of simulated acid rain water on elemental concentrations in each part of the crop.
At a pH range of 5.6-3.5, elemental concentrations in each part of the crop plants was examined. Mg, Ca, K and P were chosen as macro-component essential elements of the plant
and Fe, Zn were chosen as micro-component essential elements15. Results of analyses for these 6 elements in each part of 3 kinds of crops grown for one week are shown in Table 1-'6. Behavior of each macro and micro-component element in grown crop is described below.
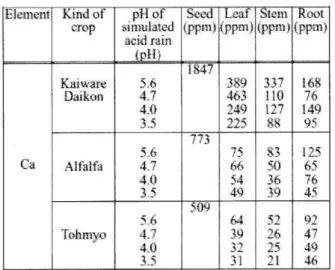
1) Macro-component element Mg, Ca, K and P To begin with, the result for Mg is shown in Table 1. It was shown that the Mg concentration in the leaf of each crop was relatively higher than those in the stem and root, when pH of the simulated acid rain was 5.6. This was especially, remarkable in Kaiware Daikon. However, these differences in Mg concentration could not be seen in Ca, as shown in Table 2. This difference is greatly concerned with photosynthesis. Next, Mg and Ca concentrations decreased to about 30-60% in each part of the plant, when pH was lowered to 4.7. However, Mg and Ca concentrations did not demonstrate further large changes, when pH was lowered to 3.5. Though
Table 1 The effect of p14 of th e simulated acid rain fcr the Mg content in each part place of the crops
Element
leg
Kind of crop
Kaiware .Dalkon
Alfalfa
pH of simulated
acid rain(/p143
5.6 4.7 4.0 3,5 5.6 4.7 4.0
Seed (i?pni)
Leaf (pp)
2633 712 779 609 553 1618
167 111 74
Stem (ppm)
107 4$
108 59 80 2 126
Root (ppm)
79 47 5$
95 24 4
Table 2 The effect of pH of the simulated acid rain for the Ca content in each part place of the crops
Eleine ni
Ca
Kind of crop
Kaiware Daikon
Alfalfa
Tohmyo
p11 of simulated acid rain
5.6 4.7 4.0
4.0 35 5.6 4.7 4.0 3.5
Seed (ppm)
1847
773
509
Leaf (ppm)
,389 46 3 749
?25 75
66
54 49 64 39 31
Stem (ppm)
337 110
$8 83 50 36 39 52 26 25 21
Root (PM)
168 76 149 95 125
65.
76 45
,[[.7 4 46
the reason is not clear, it is thought to be due to the increased hydrogen ion concentration in simulated acid rain, which generated damage to the crop cells, and causing abnormalities in the behavior of these ions.
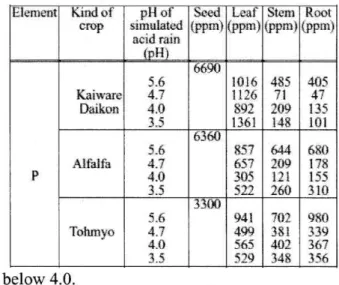
The result for K is shown in Table 3. In all crops, there was no change in the concentration of K in each part of the plant, and there was no apparent effect at pH 5.6-3.5. Especially, Tohmyo showed remarkable K levels in these crops. The K concentration in the seed is known to be very high. It is considered therefore, that it is not influenced by the hydrogen ion concentration within the range tested. Next, the result for P which showed the highest concentration of the 6 elements in the seed is shown in Table 4. P was compared between the stem and root because the concentration in the leaf was slight, At pH 4.7, there was marked elution generated in the stem and root. However, there was not a large change in P, when pH was
Table 3 The effect of pH of the simulated acid rain for the K content in each part place of the crops
Element
K
Kind of crop
Kaiware Daikon
Alfalfa
p14 of simulated
acid rain (p1-13
5.6 4.7 4.0 3.5 5.6 4.7 4.0
Seed (ppm)
7517
1641
Leaf (.ppnn)
771 771 681 686 648 787 393
Stem (1,pm)
678 607 432 4441.
$36 492, 392
Root (ppm)
1078 429 782 . 449 602 539 570
'tabl
e 4 The effect of pH of the simulated acid rain for the P content in each part place of the crops
Table 5 The effect of pH of the simulated acid rain thr the Fe content in each part place of the crops
Element
P
Kind of crop
Kaiware Dalkon
Alfalfa
Tolunvo
p11 of simulated
acid rain (pH)
4.7 4.0 3.5 5.6 4.7 4.0 3.5 5.6 4.7 4.0 3.5
Seed (ppm)
6690
6360
3300 Leaf (ppm)
1016 1126 892 1361 857 657 305
941 499 565 519
Stein (ppm.)
485 71 209 148 644 209 121 260 702 381 40' 34$
Root (pprn)
405 47 135 101 6$(t 178 155 310 980 .339 367
356
Element
Fe
Kind of crop
Kaiware L)a'ikon
Alfalfa
Toh rwo
pH of simulated
acid rain (0-11
4.7 4.0 3.5 5.6 4.7 4.0
5.€
4.7 4.0 3.5
Seed (ppm)
92
7$
183 Leaf (ppm)
336 45 28
G 36
316 37 40 2 299
11 13 12
Stem (ppm)
294 32 19 16 2<.6
29 34 6 289
8 7 6.5
Root (ppm)
299 26 2$
15 290
34 63 8 285
12 13 11
below 4.0.
2) Micro component element Fe and Zn
The results for Fe and Zn, which are micro-elements, are respectively shown in Table 5 and Table 6. Fe concentration in the seed is very low. However, Fe in each part of plants grown at pH 5.6 showed a several-fold higher concentration compared with that in the seed. It was shown that Fe was very easily absorbed to the crop, though many elements examined here were released from each part place. However, Fe concentrations in each part rapidly decreased, when pH of the simulated rain water decreased below 4.7. Especially, in Tohmyo, when the pH was 3.5, Fe was only slightly detected, and the effect of acid rain on Fe was noticeable. In the case of Zn, there was a similar low concentration in the seed of each crop, equivalent to that of Fe.
4. Conclusion
Simulated acid rain water in this experiment contained quantities of inorganic components similar to these in natural rain water, and the pH range changed from 5.6 to 3.5. Using the simple equipment shown in Fig.1, the experimental crops were sprinkled with simulated acid rain at these pH levels, at several times the natural amount of rainfall on crops at this growth stage in order to prevent plant death due to water References
1. K. Murano,"Acid rain and acidic mist",
Table 6 The effect of of the simulated acid rain for the Zn content in each part place of the crops
Element
Zn
Kind of crop
Kaiware Dai.kon.
Alfalfa
Tohnvo
p11 of simulated
acid rain (PHI
5.6 4,7 4.0 3.5 5.6 4.7 4.(0 3.5 5.6
...7
1.0 3.5
Seed (ppni)
49
51
37
.1_.eaf (ppm)
0.68
1.2
6.2
Stem.
(Pim)
0.13
2.4
Root.
(ppm)
0.44
0.42
- not detected
However, Zn was completely undetectable in from each part of the crop, when the pH was 4.7 or less. Therefore, it became clear that Zn was very easily affected by acid rain.
shortage. Therefore, the result is understood to represent the effect of natural acid rain. However,
it is expected that the pH of acid rain will decrease below pH 4.7 in the future3. And, an increased amount of rainfall based on global warming is also estimated. Therefore, the data obtained here is expected to be useful in expanding our knowledge of environmental
science.
Shokabo, Tokyo (1997).
-32-
2.
3.
4.
5.
6.
7.
8.
9.
M. Ichikuni, Chemical and Education, 38, 17 (1990).
K. Kimura, "What is rain for crops?", Noubunkyou, Tokyo (1997).
K. Satake, Environ. Sci, 12, 217 (1999).
JSSSPN, "Soil of low pH and plant", Hakuyusha, Tokyo (1994).
Y. Nouti, Soil Science and Plant Nutrition, 65, 74 (1994).
0. Fujino, et al., Nihon Kagakukai-shi, 580 (1992).
0. Fujino, et al.,Nihon Kagakukai-shi, 751 (1999).
J. J. Lee, et al. Environ. Exp. Bot., 21, 171
10.
11.
12.
13.
14.
15.
(1981).
T. Kobayashi, et al., agrometeo., 47, 83 (1991).
T. Hosono, et al, Air, Poll. Inst., 27, 111 (1992).
Y. Kohno, et al., Wat. Air Soil.Poll. 45,173 (1989).
P. M. Irving, Environ. Exp. Bot, 25, 327 (1985).
L. S. Evans, et al. New Phytol., 91, 429 (1982).
E. Takahashi,. "Mechanism of crop nutrition", Noubunnkyou, Tokyo (1993).