特集論文
Acoustic Characteristics for Japanese Stops in Word-initial Position:
VOT and Post-stop fo
†Hi-Gyung Byun*
日本語における語頭閉鎖音の音響特徴 ―VOT と後続母音の fo―
SUMMARY: The voicing contrast for Japanese word-initial stops is primarily realized as differences in the Voice Onset Time (VOT). However, previous studies have pointed out that VOT alone cannot differentiate the two stop categories because their VOT values overlap. A few studies have attempted to find another characteristic by examining post-stop fo and voice quality but have failed to find an answer. This study investigated VOT and post-stop fo using data drawn from eighty-two native speakers from four regions. The result shows that post-stop fo differences can distinguish the two categories, but not alone. The acoustic space of VOT and post-stop fo demonstrates a clear distinction between the two categories, while the effect of VOT and post-stop fo on voicing contrast differs from region to region. The result of this study provides evidence that post-stop fo functions as an acoustic characteristic responsible for voicing contrast along with VOT.
Key words: Japanese, word-initial stop consonant, VOT, post-stop fo, regional difference, clear speech
1. Introduction
1.1 Acoustic Characteristics of Word-initial Stops
When categorizing word-initial stops on the basis of voicing, Japanese is classified as a two-way contrast language: voiced stops vs. voiceless stops. The former involves vocal cord vibration at the time of articulation, whereas the latter does not. However, like English, the Japanese word-initial voiced stops (/b, d, g/) do not necessarily involve vibration of the vocal cords when they are produced. In such cases, categorization on the basis of aspiration into aspirated stops (/p, t, k/) and unaspirated stops (/b, d, g/) makes possible a cate-gorization of more phonetic realization. The two stop categories of Mandarin Chinese can also be perfectly discriminated by the presence and absence of aspira-tion, However, categorization using aspiration would make it impossible to explain true-voice languages distinguished by the presence and absence of voicing.
According to Voicing Onset Time (VOT: the time interval between the release of a stop and the onset of glottal vibration of a following sound) proposed by
* Akita International University(国際教養大学)
† This paper, which originally appeared in the Journal of the Phonetic Society of Japan, Vol. 23 (December 2019) in Japanese, was selected for the Best Paper Award for that year. As part of its international information outreach, the Phonetic Society of Japan is pleased to present here an English translation of this prize-winning paper.
Lisker and Abramson (1964), the word-initial stops of 11 languages they examined nearly all belong to one of the three categories of: voicing lead (−125~−75 ms centering at−100 ms), short lag (0~25 ms centering at 10 ms), or long lag (60~100 ms centering at 75 ms). For example, in Hungarian and Spanish, which have two stop categories, the VOT of voiced stops is voicing lead and that of voiceless stops is short lag. In the cases of English and Mandarin Chinese, which also have two categories, the VOT of English voiced and Chinese unaspirated stops is short lag and that of En-glish voiceless and Chinese aspirated stops is long lag. Since VOT includes both the characteristics of voicing and aspiration, a categorization using the concept of VOT allows explanation of both languages that can only be explained by voicing and those that can only be explained by aspiration. It is also possible to explain languages like Thai that have the three stop categories of voiced, unaspirated, and aspirated stops.
However, with regard to stops in Korean, which has three stop categories just in its voiceless stops (lenis, fortis, aspirated) according to Lisker and Abramson
(1964), since the VOT for lenis stops and fortis stops almost overlap, it is not possible to explain the three categories well using VOT alone. That is, VOT alone is insufficient and a parameter other than VOT is needed. Kim (1965) held that in order to explain word-initial stops in Korean, the two characteristics of tenseness and aspiration are needed; the presence and absence of tenseness distinguishes lenis stops on the one hand from fortis and aspirated stops on the other, and the presence and absence of aspiration distinguishes between fortis stops and aspirated stops. Lisker and Abramson (1964) also touched upon tenseness, but, since, in contrast to voicing and aspiration which can be shown by a single parameter, the voice bar for voicing and aspi-ration for aspiaspi-ration, it is difficult to identify a key parameter that characterizes tenseness and character-istics that correlate with tenseness are also observed with voiceless consonants, they remove tenseness from the discussion. Kim (1965) also explained tenseness as being a composite of multiple acoustic and physio-logical characteristics. Later research, beginning with Silva (2002, 2006), has clarified that distinguishing categories in word-initial stops in Korean involves the two parameters of VOT and the fundamental frequency (fo)1) of the following vowel (Kang and Guion 2008, Lee and Jongman 2012, Kang 2014, Byun 2016a, 2016b, 2017, among others). That is, fortis stops are distinguished from lenis and aspirated stops by VOT and lenis and aspirated stops are distinguished by a difference in post-stop fo. It is clear from consideration of the cases of Korean and Thai that, while there are cases like Thai in which a single parameter is sufficient to distinguish three stop categories, there are also cases like Korean in which another parameter (in this case post-stop fo) in addition to VOT is necessary.
1.2 Dialectal Variations in Acoustic Characteris-tics of Word-initial Stops
Since it is related to this study, I will describe word-initial stops in Korean in some more detail. As Lisker and Abramson (1964) mentioned, the VOT of lenis stops was originally so short that they overlapped with the fortis stops, but it has become clear in recent research that a diachronic change has taken place such that the VOT of lenis stops has lengthened to the point that it has merged with the VOT of aspirated stops. As a result of this change, the lenis and aspirated stops, which used to be distinguished by differences in their VOT, have come to be distinguished by dif-ferences in post-stop fo. That is, in their production, lenis stops have a long VOT and a low fo, aspirated
stops have a long VOT and a high fo, and fortis stops have a short VOT and a high fo. However, there are dialect differences in the change in VOT in word-initial stops, and it is primarily in the Seoul dialect, which lacks lexical pitch accent, that post-stop fo is associ-ated with distinguishing segmental categories, while in the Gyeongsang dialect (spoken by approximately 6-million people in southeast Korea), the three categories are, as a rule, distinguished by VOT alone (Jo and Shin 2003, 2004, Holiday and Kong 2011, Lee and Jongman 2012). Furthermore, while in the Seoul dialect post-stop fo is used in addition to VOT for the stop contrast, it has been reported that in the Yanbian and Hamgyong dialects, it is the L1-L2 (the amplitude difference of the first two harmonics) of the following vowel that is used (Kang and Han 2012, Oh and Yang 2013, Ito 2017). The Yanbian and Hamgyong dialects, like the Gyeongsang dialect have pitch accents and share the fact that in general post-stop fo is not associated with the stop contrast. Concerning this, there is the view that, since the fo is already associated with lexical accent, it is blocked from further involvement in distinguishing segmental categories (Kenstowicz and Park 2006, Lee and Jongman 2012)2).
1.3 The VOT of Word-initial Stops in Japanese
When categorizing by VOT, the VOT for voiceless stops always has a positive value, but the VOT for voiced stops varies by language and may take either a positive or a negative value or may take both. In the case of English, many voiced stops have a positive VOT (Lisker and Abramson 1964, Klatt 1975, Kong et al. 2012), but even though both voiced and voiceless stops have positive VOTs, since the former always belong to the short lag category and the latter to the long lag category, as a rule, there is no clash between categories. However, the VOT for voiceless stops in Japanese is 29~57 ms and is thus between the short lag and long lag categories (Riney et al. 2007), and there are cases in which it is difficult to distinguish them from the short lag of voiced stops. For this reason, it has long since been pointed out that VOT is not an effective parameter for distinguishing stop categories in Japanese (Homma 1980). Similar observations can be found in recent literature as well, and Kong et al. (2012) say that, while VOT is necessary to distinguish the categories, because there is frequent overlap between categories, VOT alone is not sufficient.
In the literature on word-initial stops in Japanese, in addition to that described above reporting that VOT alone is insufficient for distinguishing between
cate-gories, there are also reports presenting data clearly showing that the VOT for voiced stops is negative and that for voiceless stops is positive (Itoh et al. 1979, Kobayashi 1981, Shimizu 1996, 1999). Regional di ffer-ences can be thought to be behind this finding of differ-ent results when analyzing the same Japanese language. Looking at the native dialects of speakers in previous studies, Shimizu (1996) reported that of six informants, two had slight dialect accents, but they were treated as Standard Japanese speakers along with the other four. The native dialects of the four informants in Kobayashi (1981) were Ky¯ush¯u, Kant¯o, and K¯obe, and negative VOTs for voiced stops were predominant. On the other hand, in the case of J¯o (2008), which surveyed 41 college students, 34 of whom were from the three T¯okai prefectures and also included students from Hokkaid¯o and T¯oky¯o, positive VOTs for voiced stops were in the majority. The native dialects of the three informants reported in the aforementioned Homma (1980) were Ky¯oto and Ky¯ush¯u dialects. Considering all of these, it can be seen that even for speakers from the same region, there is inconsistency in the results depending on the literature that cannot be explained by dialectal differences alone. Regarding “the devoicing of word-initial stops” by which word-word-initial voiced stops have a positive VOT rather than a negative VOT, it has been reported that not only are there regional differences, but there are also age differences (Takada 2004, 2006, 2011). These will be described in detail in the next section.
1.4 VOT Changes in Word-initial Voiced Stops
Using two varieties of speech corpus, Takada (2011), analyzed the VOT of word-initial stops produced by 908 native speakers born between 1895 and 2001. It was found that, with northern Kant¯o as a boundary, in the T¯ohoku region and to the north (T¯ohoku and Hokkaid¯o), the voiced stops originally have a positive VOT and in the Kant¯o region and to the west, they originally have a negative VOT, but beginning with informants born after the 1920s, positive VOTs for voiced stops start to appear in Kant¯o and to the west, and this devoicing of word-initial voiced stops is on-going today as well.
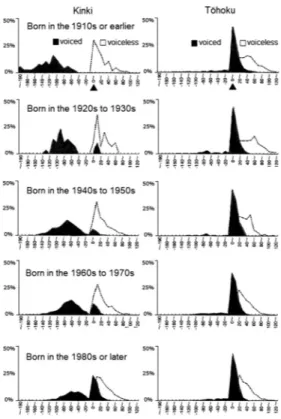
Figure 1 is the result from Takada (2011, figure 3–24 of the original), which is slightly modified (■=voiced, □=voiceless; in the original both were white, ▲ has been added in the top figure to indicate 0 ms). The Kinki region on the left is representative of the Kant¯o region and to the west, and the T¯ohoku region on the right is representative of the T¯ohoku region and to the
Figure 1 Distribution of word-initial stop VOT (Figures 3-24 from Takada (2011, p. 145) partially mod-ified).
north. Each figure is divided by speakers’ year of birth, aggregated by 20-year bands. The horizontal axes show VOT with−190 ms on the left edge and 120 ms on the right edge, from −180 ms to 120 ms with 20 ms intervals. The vertical axes show the percent of tokens belonging to each VOT value, marking from the bottom 0%, 25%, and 50%.
Looking at voiced stops in Figure 1, VOT is nearly completely positive for T¯ohoku speakers born in the 1910s and before. This tendency does not change as the year of birth nears the present, and the VOT for voiced stops in T¯ohoku can be considered to be fundamentally positive. On the other hand, in Kinki, positive VOT are not found for speakers born in the 1910s or earlier, and the VOT for voiced stops are all negative and those for voiceless stops are all positive. Beginning with speakers born in the 1920s to 1930s, utterances with positive VOT for voiced stops start to appear and as the year of birth nears the present, that percentage becomes higher. The VOT of voiceless stops does not change as much as that of voiced stops, but as the speakers get younger, the pattern changes little by little and for the
younger generation born since the 1980s, they form a peak around 20~30 ms in both Kinki and T¯ohoku.
1.5 Acoustic Characteristics Other than VOT As-sociated with the Stop Contrast
The question is what acoustic characteristics other than VOT do the younger generation in the Kant¯o and the west region, whose VOT for voiced stops and voiceless stops have become closer due to the devoicing of voiced stop, and speakers in T¯ohoku and to the north, where both voiced and voiceless stops originally had positive VOT, use to distinguish word-initial stop categories?
As characteristics that could replace or supplement VOT, previous research has considered the fo and the voice quality (L1–L2) of the following vowel (Kang and Kong 2014, Takada et al. 2016), but no consistent view has been reached. Regarding the following vowel, there are also reports that the type of following vowel influences VOT (Shimizu 1996, Takada 2011, Kang and Kong 2014), but, again, previous research has not attained consistent results.
One thing that should not be forgotten when debating whether fo is associated with the stop contrast is the existence of pitch accent in Japanese. This is because, as described in section 1.2, in dialects that have pitch accents, the use of the fo of the following vowel (post-stop fo) to distinguish (post-stop categories is avoided. With regard to this, in Japanese it has been confirmed that consonant-induced fo differences do not affect lexical accent (Gao and Arai 2018), therefore it is possible for the post-stop fo difference and the fo difference stemming from lexical accent to coexist.
2. Purpose of This Study
Given the data discussed above, this study exam-ines, including regional differences, (1) whether or not the devoicing of word-initial voiced stops has further progressed and (2) as a substitute parameter for VOT, whether or not post-stop fo is associated with discrim-ination of stop categories in the generation for whom the distinction between voiced and voiceless stops is unclear or is in the process of becoming unclear due to changes in VOT.
The participants of this study were all born in the 1990s and are either the same age group as or slightly younger than the youngest speakers in Takada (2011) and (1) is a follow up study to Takada (2011). (1) will also pursue the following vowel issue affecting VOT, on which previous studies have not yet reached
an agreement. (2) will pay special attention to two dialects. The first is the T¯ohoku dialect where voiced stops originally have positive VOT and thus whose VOT overlaps with the positive VOT of voiceless stops. It will look at to what degree post-stop fo is associated with distinguishing stop categories. The second is the Miyazaki dialect of the Ky¯ush¯u region that, like the Seoul dialect, lacks lexical pitch accent. This study will see whether post-stop fo is associated with the stop contrast in this accentless dialect.
3. Methodology
Since the material for examining the influence of the following vowel (/a, i, u, e, o/) on VOT and the material to examine the influence of fo in distinguishing stop categories are different, the first will be designated Experiment I and the latter Experiment II, and the two are described separately below.
The material for Experiment I consists of one-mora nonsense words produced in isolation. The material for Experiment II uses the H&H theory (Lindblom 1990, Johnson et al. 1993) to obtain evidence for the involvement of VOT and post-stop fo in stop categories. According to H&H theory that provides explanations for acoustic-phonetic modification in clear speech pro-duction, it is necessary to look at hyperarticulated speech (hyper speech) in order to search out phonetic targets involved in phonemic contrasts; speech that is easy to catch and understand is not ordinary speech like list reading (citation form speech) but is speech that is carefully and clearly articulated (clear speech). The term clear speech is sometimes used in the same meaning as hyper speech (Moon and Lindblom 1989, 1994, Stent et al. 2008), but, like speech under noisy conditions (Lombard effect), speech to someone with impaired hearing, speech to language learners (for-eigner talk), or speech to infants (motherese), it is also used to refer to a kind of speech style from which speakers choose consciously or unconsciously as highly enunciated speech (Uchanski 2008). In any case, by establishing a situation like those described above, it is possible to elicit clear speech. Clear speech does not assume slow speech, and slow speech or speaking in a loud voice does not necessarily result in clear speech (Krause and Braida 2002). Whether the various acoustic characteristics found in clear speech are directly linked to intelligibility remains in part unclear, but in English it has been reported that there is a possibility that lengthened VOTs for voiceless stops contribute to the high intelligibility of clear speech (Uchanski 2008).
3.1 Experiment I: Normal Speech 3.1.1 Participants and Recording
The participants were 82 native speakers of T¯ohoku, Ch¯ubu, Kinki, and Ky¯ush¯u dialects. In detail, there were 18 T¯ohoku speakers (10 from Akita Prefecture, 3 from Aomori Prefecture, 2 from Iwate Prefecture, 2 from Miyagi Prefecture, 1 from Yamagata Prefecture), 15 Ch¯ubu speakers (15 from Aichi Prefecture), 23 Kinki speakers (10 from ¯Osaka Prefecture, 13 from Hy¯ogo Prefecture), and 26 Ky¯ush¯u speakers (14 from ¯Oita Prefecture, 12 from Miyazaki Prefecture). The reasons for choosing these regions are as follows: As described earlier, T¯ohoku is a region in which the voiced stops have traditionally a positive VOT, Ch¯ubu is a region barely considered in Takada (2011), and Kinki is a region in which the VOT for voiced stops is in the process of changing, as seen in Figure 1. Ky¯ush¯u is an area where, as in Kinki, change in VOT is in progress, but is added as a target for study to see whether there are differences from Kinki and to see the involvement of post-stop fo in a region without pitch accent (Miyazaki dialect) as described earlier.
Data collection was made over the period 2016 to 2018 of students at Akita International University in T¯ohoku, Aichi Gakuin University in Ch¯ubu, K¯obe University in Kinki, and Nagasaki University and Nagasaki University of Foreign Studies in Ky¯ush¯u. Recordings were made in a quiet room using a SONY condenser microphone and recorded to a personal computer through an audio interface at a sampling rate of 22050 Hz.
3.1.2 Speech Materials
Words for the Experiment I were nonsense words of the form/CV/, where the onset C was one of /p, t, k, b, d, g/ and V was one of /a, i, u, e, o/. Participants read the words one by one, including dummies, from a sheet of paper in random order at a comfortable speaking rate. Each participant read each word two times and a total of 4264 tokens were obtained [(/p, k, b, g/ x /a, i, u, e, o/ + /t, d/ x /a, e, o/) × 82 speakers × 2 times].
3.2 Experiment II: Clear Speech 3.2.1 Participants and Recording
The participants were 72 native speakers of T¯ohoku, Ch¯ubu, Kinki, and Ky¯ush¯u dialects. They were the same speakers as for Experiment I, but there was a different number of them. In detail, there were 10 T¯ohoku speak-ers (6 from Akita Prefecture, 2 from Aomori Prefecture, 1 from Iwate Prefecture, 1 from Miyagi Prefecture), 14 Ch¯ubu speakers (14 from Aichi Prefecture), 23 Kinki speakers (10 from ¯Osaka Prefecture, 13 from Hy¯ogo Prefecture), and 25 Ky¯ush¯u speakers (13 from ¯Oita Prefecture, 12 from Miyazaki Prefecture). Recordings were the same as in Experiment I. Recording proce-dures will be described along with speech materials in the following section.
3.2.2 Speech Materials
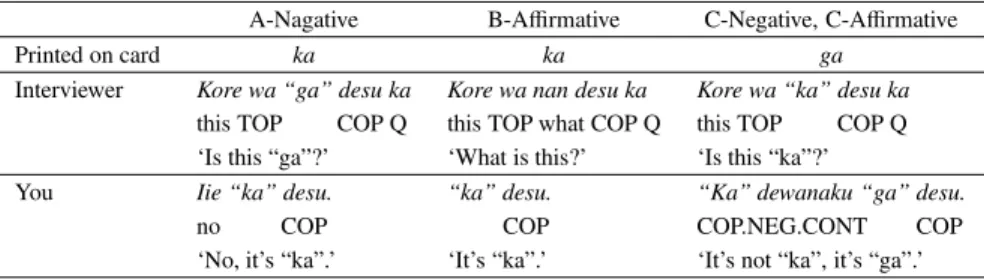
Words for the Experiment II were nonsense words of the form/CV/, where the onset C was one of the six stops /p, t, k, b, d, g/ and V was the vowel /a/. In order to elicit clear speech in which voiced and voiceless stops can be grasped contrastively and their respective acoustic characteristics are expressed clearly, three kinds of short conversations were created (A, B, C in Table 1). A in Table 1 is a single negative sentence, B is a single affirmative sentence, and C is composed of a negative and an affirmative sentence. When the interviewer (the author) asks a question while showing the participant the cards, the participant answers with the part marked “You” while looking at the nonsense word on the card. The actual interview took place after some practice to familiarize participants with the conversation. The words analyzed were the 6 words (ka, ga, ta, da, pa, ba) contained in the quotation marks in the “you” portion of the card, which were produced once each by the 72 participants and a total of 1728 tokens were obtained [6 words×(A-Negative+B-Affirmative+ C-Negative+ C-Affirmative) × 72 participants)3).
The ka in Ka desu ‘It’s ka.’ in A and B carry contrastive focus and information focus respectively (K¯ori 2013). It is possible that both the ka in Ka Table 1 Experiment II conversational texts to elicit clear speech.
A-Nagative B-Affirmative C-Negative, C-Affirmative
Printed on card ka ka ga
Interviewer Kore wa “ga” desu ka Kore wa nan desu ka Kore wa “ka” desu ka this TOP COP Q this TOP what COP Q this TOP COP Q ‘Is this “ga”?’ ‘What is this?’ ‘Is this “ka”?’
You Iie “ka” desu. “ka” desu. “Ka” dewanaku “ga” desu.
no COP COP COP.NEG.CONT COP
dewa naku ‘It’s not ka,’ and the ga in Ga desu ‘It’s ga.’ carry contrastive focus. In Japanese, it has been
reported that the phonetic realization of focus mainly uses fo difference (K¯ori 1989), and it is likely that the fo used to mark focus and the fo used to distinguish stop categories mutually influence each other. Since there is no literature covering how they might influence each other, it is impossible to confirm whether they do or not. However, even if it should be the case that they influence each other, since/pa, ta, ka, ba, da, ga/ are evenly distributed across all conditions, both voiced and voiceless stops are placed in the same circumstances, and neither one alone is being influenced. On the other hand, when two focused elements appear in a row, the second element undergoes accent weakening whereby its fo is significantly lowered compared to that of the first element (K¯ori 1997, 2011). Accordingly, there is the possibility that the first fo of the C-Negative will be relatively high and that of the second C-Affirmative will be relatively low. Furthermore, there is a possibility of negative narrow focus being added to C-Negative, mak-ing it even higher. The focus that emphasizes only the relevant element and clear speech, which emphasizes all elements, have in common the fact that they are both hyperarticulated, and thus it was considered that using focus is an appropriate way to elicit clear speech.
3.3 Measurement
The VOT and fo were measured using Praat (version 6.0.22). For VOT, if there was the voice bar of voiced stops prior to stop release, its length was measured as a negative VOT. If there was no voice bar, the length from the point of the stop release to the onset of voicing on the following vowel was measured as a positive VOT. For post-stop fo, the point when both the first and second formants were observed after the wave form became periodic was determined as vowel onset. The values for VOT and fo were converted to z-scores within each speaker’s productions in each dimension in order to remove speaker-specific and consonant-specific differences, such as gender-based variation in fo range and consonant-based variation in VOT. All statistical analyses below use these standardized values.
3.4 Statistical Analysis
Listing up the items considered in this study, for Experiment I: whether or not the devoicing of word-initial stops has further progressed compared to previ-ous research, whether post-stop fo is associated with the stop contrast, what are the regional differences in the relative importance of VOT and fo, and whether
the type of following vowel is associated with the stop contrast. For Experiment II, which of VOT and fo is enhanced in clear speech, how much of a difference is there in the accuracy of category distinction between normal speech and clear speech, and whether there is the use of fo in accentless regions. Looking at the data collected for this purpose, it is as follows.
The data was repeatedly measured from a single speaker under different conditions, so individual varia-tion must be considered (random effect). As can be seen in Figure 2, the results for VOT with voiced stops form a bimodal distribution and not a normal distribution. The vowel types in Experiment I and the clear speech condition in Experiment II are nominal variables while the VOT and fo values are continuous variables. Given these attributes of the data, this study used generalized linear mixed effects models (GLMMs) as implemented with the glmer function from the lme4 package (version 1.1-21) in R (R Core Team 2019, version 3.61). Specif-ically, logistic regression models were built. The model included vowel types in Experiment I and speech types in Experiment II as independent variables, and stop categories (voiced, voiceless) as a dependent variable. The models also included by-speaker random intercepts to account for variability in VOT and fo of speakers, but by-item random intercepts were not included because we used all six stop consonants. This study estimated the effect of the fixed variables VowelType (/a/, /i/, /u/, /e/, /o/) and SpeechType (Normal, Clear A, Clear B) on the dependent variable. Categorical variables were simple-coded.
This study was particularly interested in the relative importance of VOT and fo. To analyze the relative importance, we conducted coefficient comparisons and further used odds ratios. By using an odds ratio, we could tell that how many times the odds one predictor has over the other predictor. Furthermore, to examine the degree of classification accuracy by VOT and fo in the four regions, we used correct classification accuracy rates in Experiment II.
4. Results
Results will be described in the order of Experiment I: normal speech (4.1), Experiment II: clear speech (4.2), and the accentless region (4.3). For Experiment I, we first report the results for VOT and fo by region and move on to the results for the following vowel type. For Experiment II, after reporting the results for VOT and fo, we will move on to the results for the correct classification accuracy rates by speech type.
Figure 2 Distribution of VOT by region. 4.1 Experiment I: Normal Speech
4.1.1 VOT and Post-stop fo by Region
First, we look at what degree devoicing of voiced stops has progressed among the speakers in this study compared to the youngest speakers in Takada (2011) seen in Figure 1. Figure 2 presents histograms of the VOT results by region. The graphs are arranged from the highest devoicing rate of voiced stops to the lowest: T¯ohoku, Ky¯ush¯u, Kinki, Ch¯ubu. The numbers on the vertical axis show the number of tokens (n) (The total number of tokens includes tokens outside the limits). In order to be able to directly compare Figures 1 and 2, Figure 2 shows all tokens without distinguishing among places of articulation, as was done in Takada (2011), but even if the tokens are divided by place of articulation, the tendencies in the distribution of the VOT do not change. The horizontal axis shows VOT in 10 ms intervals. The birth years of the youngest speakers in Takada’s study were roughly the same as the speakers in this study. Comparing Figures 1 and 2, we cannot see any notable change in T¯ohoku and Kinki. It is probably more reasonable to interpret it as being because the years of birth are close, making it difficult for any conspicuous change to emerge, rather than interpreting it as meaning that the change in VOT has come to a halt. In Figure 2, voiced and voiceless stops overlap in all regions, and it is evident that VOT alone cannot differentiate the two stop categories.
The devoicing rate of voiced stops (the percentage
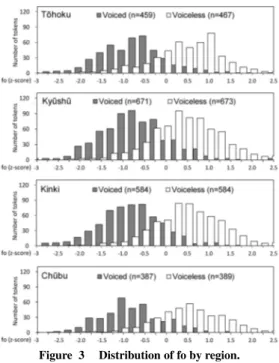
Figure 3 Distribution of fo by region.
of tokens with voiced stops that were produced with a positive VOT) was, in order of largest to smallest, T¯ohoku 83%, Ky¯ush¯u 73%, Kinki 45%, and Ch¯ubu 26%. Putting aside T¯ohoku, where voiced stops orig-inally have a positive VOT, the devoicing of voiced stops is most advanced in Ky¯ush¯u and least advanced in Ch¯ubu. In other words, in terms of the change in VOT, Ky¯ush¯u is the most innovative and Ch¯ubu is the most conservative.
Figure 3 shows the results for post-stop fo. Overall, those following voiced stops are low, and those follow-ing voiceless stops are high, but there is a substantial overlap between the two categories in all the regions. Therefore, like VOT, fo alone cannot distinguish the two stop categories.
4.1.2 Relative Importance of VOT and Post-stop fo
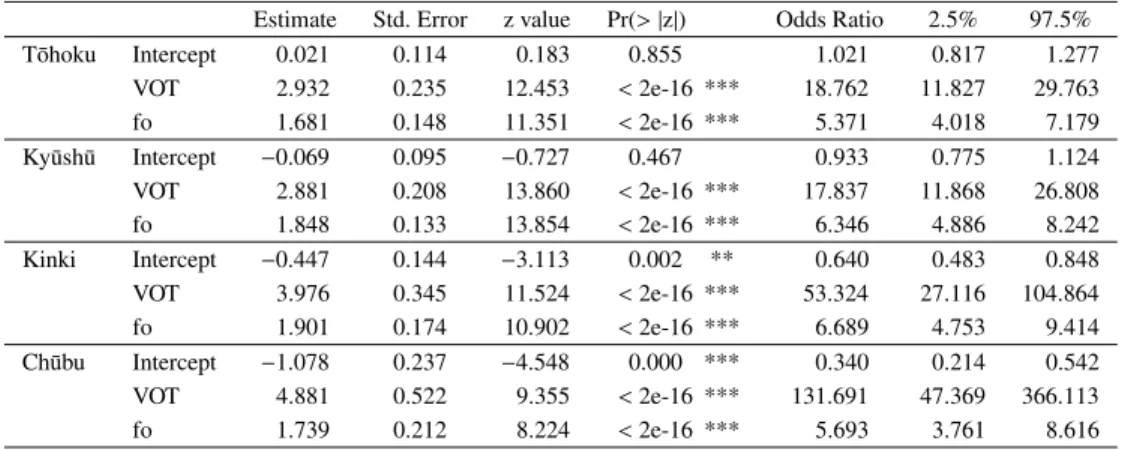
Table 2 provides a summary of mixed effects logis-tic regression models along with the odds ratio with confidence interval4). Figure 4 shows prediction curves visually presented based on coefficients in Table 2. As mentioned earlier, VOT and fo values were standard-ized using z-score transformation so that VOT and fo can be compared with each other directly.
We first look at the Table 2. The coefficient of each parameter (predictor) indicates the magnitude of the effect in determining a non-reference category (here, voiceless stops. The non-reference category is com-pared to a reference category, here voiced stops). The
Table 2 A summary of mixed effects logistic regression models and odds ratios (Normal speech). Estimate Std. Error z value Pr(> |z|) Odds Ratio 2.5% 97.5% T ¯ohoku Intercept 0.021 0.114 0.183 0.855 1.021 0.817 1.277 VOT 2.932 0.235 12.453 < 2e-16 *** 18.762 11.827 29.763 fo 1.681 0.148 11.351 < 2e-16 *** 5.371 4.018 7.179 Ky¯ush¯u Intercept −0.069 0.095 −0.727 0.467 0.933 0.775 1.124 VOT 2.881 0.208 13.860 < 2e-16 *** 17.837 11.868 26.808 fo 1.848 0.133 13.854 < 2e-16 *** 6.346 4.886 8.242 Kinki Intercept −0.447 0.144 −3.113 0.002 ** 0.640 0.483 0.848 VOT 3.976 0.345 11.524 < 2e-16 *** 53.324 27.116 104.864 fo 1.901 0.174 10.902 < 2e-16 *** 6.689 4.753 9.414 Ch¯ubu Intercept −1.078 0.237 −4.548 0.000 *** 0.340 0.214 0.542 VOT 4.881 0.522 9.355 < 2e-16 *** 131.691 47.369 366.113 fo 1.739 0.212 8.224 < 2e-16 *** 5.693 3.761 8.616 Significance codes: 0 ‘***’ 0.001 ‘**’ 0.01 ‘*’ 0.05 ‘.’ 0.1 ‘ ’ 1
Figure 4 Prediction curves estimated by mixed effects logistic regression models (Normal speech). greater the absolute value of the coefficient is, the
more influence the parameter has. If the coefficient is positive, then it shows that the probability of a voiceless stop is higher, and if it is negative, the probability of a voiced stop is higher. In other words, the longer the VOT or the higher the fo, the more likely it is a voiceless stop. The absolute value of VOT is higher than that of fo in all regions and it can be said that in distinguishing word-initial stop categories, the VOT has more influence than fo (the influence of VOT is strongest in Ch¯ubu). The effects of fo and VOT are both statistically significant.
Next, we look at the odds ratio to examine how
much more of an influence VOT has than fo is in each region. For an odds ratio of VOT over that of fo, the odds ratio greater than 1 means that VOT has more influence than fo as much as the odds ratio indicates, and an odds ratio less than 1 means the opposite. (fo has more influence than VOT.) The range of odds ratio is 0 to infinity. The odds ratio of VOT over that of fo is 3.5 (18.762/5.371) in T¯ohoku, 2.8 (17.837/6.346) in Ky¯ush¯u, 8.0 (53.324/6.689) in Kinki, and 23.1 (131.691/5.693) in Ch¯ubu. That is, in distin-guishing the two stop categories, T¯ohoku speakers were 3.5 times more likely to use VOT than fo. In the same way, Ky¯ush¯u speakers were 2.8 times, Kinki speakers
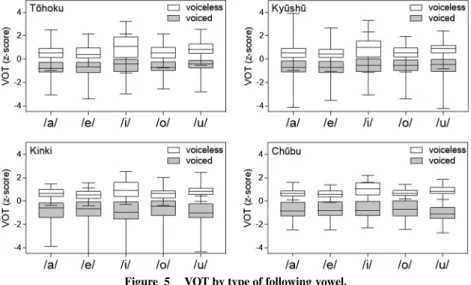
Figure 5 VOT by type of following vowel.
were 8.0 times, and Ch¯ubu speakers were 23.1 times. Figure 4 shows the prediction curve plotted over the measured values. The curves are the inverse logit curves estimated by the mixed effects logistic regres-sion models, and the slope is the coefficient of each parameter. The larger the coefficient, the steeper the slope. The slope of VOT is steepest in Ch¯ubu, where its influence is greatest. The slope of fo, which the influence is relatively small compared to VOT, is gentle in all regions.
4.1.3 VOT by Type of Following Vowel
Figure 5 shows the results of VOT by following vowel. Previous studies have pointed out that the VOT of voiceless stops is very different when followed by certain vowels; Shimizu (1996) reported that the VOT tends to be longer with/ki/ and /ku/ and Takada (2011) with high vowels. In Figure 5, the medians with the high vowel/i/ are slightly higher than that of other vowels. However, no such tendency is observed with/u/, also a high vowel. In the case of/u/, the medians of the two categories are more separated than other vowels in all regions, and with regard to the stop contrast, one could say that the effect of /u/ on the phonemic contrast is greater than that of/i/. Figure 5 shows pooled results without distinguishing among places of articulation, but, looking at the results broken down by place of articulation, in all regions, it is mainly when a velar stop is followed by/i/ (i.e. /ki/) that the VOT of voiceless stops tends to lengthen.
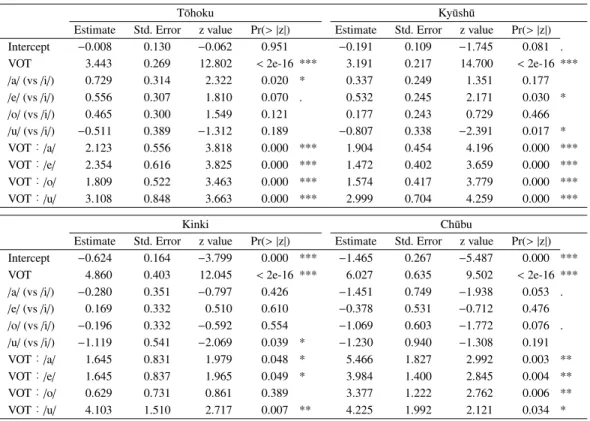
Table 3 provides a summary of mixed effects logistic regression models for all regions. It shows whether or not the VOT difference due to the following vowel type
affects the stop contrast. The independent (predictor) variables are vowel type (reference category:/i/) and VOT value, and the dependent (outcome) variable is the stop contrast (reference category: Voiced). Since what is being tested here is not whether the type of following vowel itself affects the phonemic contrast (the main effect of following vowels), but, for example, whether the VOT of stops consonant before /a/ (compared to the VOT of stops before /i/) affect the stop contrast, attention must be paid to the interaction marked by “:” here. Even if the VOT is long when the vowel is/i/, if that does not affect the stop contrast, it is meaningless. Except for the Kinki “VOT:/o/”, the interactions are significant for all vowels in all regions, and the longer the VOT is, the higher the probability of a voiceless stop when the vowel is a non-reference vowel. Based on the coefficients in Table 3, leaving aside the Ch¯ubu “VOT:/a/”, the effect of the vowel /u/ is the greatest. Now, look at the result of the correct classification rate that shows which vowel is the most effective in distinguishing stop categories in relation to the VOT of preceding stops in Table 4.
The correct classification rate (CCR) is the classifica-tion accuracy predicted by the logistic regression model and it can be used as a way of evaluating the fit of a given model. In regions where there is a lot of overlap between the two categories, the greater the number of tokens, the lower the classification accuracy because the chance of overlap increases. Accordingly, it is possible that, because/i/ and /u/ do not include alveolar stops (/ti/ and /tu/), the number of tokens including /i/ and /u/ is less than those of other vowels (/a/, /e/, /o/) and
Table 3 A summary of mixed effects logistic regression models and odds ratios (VOT by type of following vowel).
T ¯ohoku Ky¯ush¯u
Estimate Std. Error z value Pr(> |z|) Estimate Std. Error z value Pr(> |z|) Intercept −0.008 0.130 −0.062 0.951 −0.191 0.109 −1.745 0.081 . VOT 3.443 0.269 12.802 < 2e-16 *** 3.191 0.217 14.700 < 2e-16 *** /a/ (vs /i/) 0.729 0.314 2.322 0.020 * 0.337 0.249 1.351 0.177 /e/ (vs /i/) 0.556 0.307 1.810 0.070 . 0.532 0.245 2.171 0.030 * /o/ (vs /i/) 0.465 0.300 1.549 0.121 0.177 0.243 0.729 0.466 /u/ (vs /i/) −0.511 0.389 −1.312 0.189 −0.807 0.338 −2.391 0.017 * VOT:/a/ 2.123 0.556 3.818 0.000 *** 1.904 0.454 4.196 0.000 *** VOT:/e/ 2.354 0.616 3.825 0.000 *** 1.472 0.402 3.659 0.000 *** VOT:/o/ 1.809 0.522 3.463 0.000 *** 1.574 0.417 3.779 0.000 *** VOT:/u/ 3.108 0.848 3.663 0.000 *** 2.999 0.704 4.259 0.000 *** Kinki Ch¯ubu
Estimate Std. Error z value Pr(> |z|) Estimate Std. Error z value Pr(> |z|) Intercept −0.624 0.164 −3.799 0.000 *** −1.465 0.267 −5.487 0.000 *** VOT 4.860 0.403 12.045 < 2e-16 *** 6.027 0.635 9.502 < 2e-16 *** /a/ (vs /i/) −0.280 0.351 −0.797 0.426 −1.451 0.749 −1.938 0.053 . /e/ (vs /i/) 0.169 0.332 0.510 0.610 −0.378 0.531 −0.712 0.476 /o/ (vs /i/) −0.196 0.332 −0.592 0.554 −1.069 0.603 −1.772 0.076 . /u/ (vs /i/) −1.119 0.541 −2.069 0.039 * −1.230 0.940 −1.308 0.191 VOT:/a/ 1.645 0.831 1.979 0.048 * 5.466 1.827 2.992 0.003 ** VOT:/e/ 1.645 0.837 1.965 0.049 * 3.984 1.400 2.845 0.004 ** VOT:/o/ 0.629 0.731 0.861 0.389 3.377 1.222 2.762 0.006 ** VOT:/u/ 4.103 1.510 2.717 0.007 ** 4.225 1.992 2.121 0.034 * Significance codes: 0 ‘***’ 0.001 ‘**’ 0.01 ‘*’ 0.05 ‘.’ 0.1 ‘ ’ 1
Table 4 Correct classification rates for VOT by type of following vowel.
T ¯ohoku Ky¯ush¯u Kinki Ch¯ubu
/a/ 89% 83% 86% 91% /e/ 84% 83% 88% 89% /i/ 75% 77% 86% 86% /o/ 83% 81% 82% 90% /u/ 87% 89% 92% 95% average 83% 83% 87% 90%
their CCR could be higher. However, as seen in Table 4, although they are both high vowels, the CCR of/i/ is lower and that of/u/ is higher.
The results of this study are different from previous studies that reported the influence of the type of fol-lowing vowels on the voiced-voiceless distinction. It is true that when the vowel is/i/, the VOT of the preceding voiceless stop becomes longer, but that is not associated with the stop contrast, and it can be said that differences in the VOT of a stop due to the following vowel is not effective in distinguishing stop categories.
4.2 Experiment II: Clear Speech 4.2.1 VOT in Clear Speech
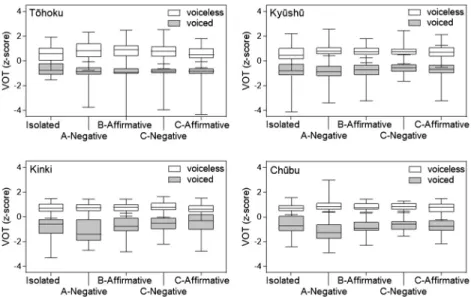
Figure 6 presents the VOT results for clear speech. The boxplots are labeled with the four conditions “A-Negative” (Iie, “ka” desu. ‘No, it’s “ka”.’), “B-Affirmative” (“Ka” desu. ‘It’s “ka”.’), “C-Negative” (“Ka” dewa naku, ‘It’s not “ka”,’), “C-Affirmative” (“Ka” desu. ‘It’s “ka”.’), and for comparison, the tokens in isolation from Experiment I with the fol-lowing vowel /a/ is also included and is labeled “Isolated”. Since in Experiment I, each utterance was repeated twice, but in Experiment II each consonant was produced once in each of the four conditions, in order to match up the number of tokens (in order to avoid a large variance that would result from having twice as many tokens), only the first of the isolated form was used.
As can be seen in Figure 6, in all regions, the difference between the two categories were clearer in the A, B, and C conditions of clear speech compared to “Isolated” of normal speech. The means by which the distinction between the categories was clarified in clear speech differed between Kinki and the other regions.
Figure 6 VOT for normal speech (isolated) and clear speech (conditions A, B, and C).
In contrast to Kinki, where the distance between the categories was maintained by extending the negative VOT of voiced stops, in T¯ohoku, Ky¯ush¯u, and Ch¯ubu, the distance between the categories was maintained by condensing each category. Looking at the median values of the boxplots, in all regions, the differences between the categories was larger in the “A-Negative” condition than in the other conditions, and it appears that under the A condition the effect of clear speech is more obvious.
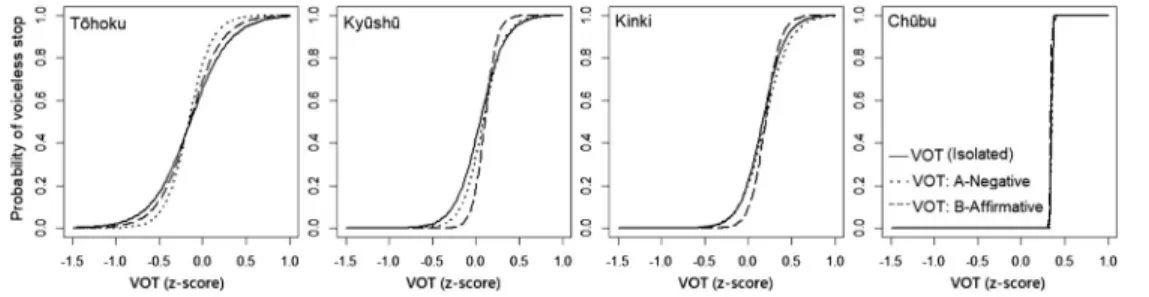
In order to determine whether the clear speech is effective for the stop contrast compared to “Isolated” of normal speech, a logistic regression analysis was conducted. Of the various conditions, as in the case of fo described in the next section, only conditions A and B were used. The independent variables were three nor-mal and clear speech typs (reference category: Isolated) and the dependent variable was the stop categories (ref-erence category: Voiced). Table 5 presents a summary of the models and odds ratios with confidence intervals, and Figure 7 shows prediction curves estimated by the mixed effects logistic regression models. Since what is being looked at is not the main effect of clear speech conditions A and B, but whether the VOT in clear speech conditions A and B are significantly different from the VOT of the isolated case, attention is paid to the interactions. The result for the Ch¯ubu region has been omitted from the Table 5 because the values were inappropriate although estimates were obtained. When there is a complete separation or a quasi-complete separation, a logistic regression analysis sometimes
does not get calculated properly (the model fails to converge) (Albert and Anderson 1984, King and Ryan 2002, ¯Okura and Kamakura 2007), and the voiced and voiceless stops in the Ch¯ubu region in Figure 7 are almost completely separate.
It is clear from the coefficients in Table 5 that in T¯ohoku “VOT: A-Negative” is more influential in dis-tinguishing the categories than “VOT: B-Affirmative”, while in Ky¯ush¯u and Kinki “VOT: B-Affirmative” is more influential than “VOT: A-Negative”. How-ever, only “VOT: B-Affirmative” in Ky¯ush¯u is sta-tistically significant. Looking at the odds ratios, in terms of influence on category distinction, in T¯ohoku “VOT: A-Negative” is about 7.6 times (19.832/2.616) more influential than “VOT: B-Affirmative”, while in Ky¯ush¯u and Kinki “VOT: B-Affirmative” is 457.3 times (1895.088/4.144) and 89.9 times (41.251/0.459) more influential, respectively, than “VOT: A-Negative”.
Aside from Ky¯ush¯u’s “VOT: B-Affirmative”, which shows a statistical significance, there is not much dif-ference in the slopes of the prediction curves for clear speech A and B and those for “Isolated”. Since the coefficients determine the steepness of the slopes of the curves5), the steeper the slope, the greater the influence on category distinction. The slope of the T¯ohoku curve is more gentle than those of Ky¯ush¯u and Kinki, and it is clear that use of VOT in T¯ohoku is less active than use in Ky¯ush¯u and Kinki.
4.2.2 Post-stop fo in Clear Speech
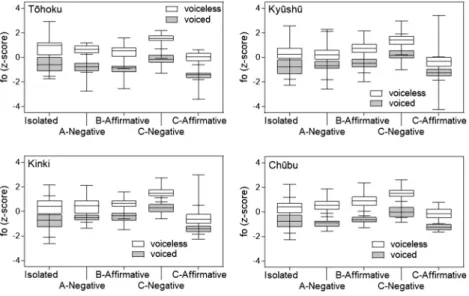
Figure 8 presents the results for fo in boxplots. As in the VOT case, for comparison, the “Isolated” results
Table 5 A summary of mixed effects logistic regression models and odds ratios (Clear speech VOT). Estimate Std. Error z value Pr(> |z|) Odds Ratio 2.5% 97.5%
T ¯ohoku Intercept 0.642 0.348 1.846 0.065 . 1.900 0.961 3.755
VOT 4.438 0.790 5.618 0.000 *** 84.573 17.984 397.719
A-Negative 0.562 0.833 0.675 0.500 1.754 0.343 8.968
B-Affirmative 0.174 0.747 0.233 0.815 1.191 0.275 5.147
VOT: A-Negative 2.987 2.100 1.423 0.155 19.832 0.324 1215.742 VOT: B-Affirmative 0.962 1.351 0.712 0.477 2.616 0.185 36.977
Ky¯ush¯u Intercept −0.329 0.252 −1.303 0.193 0.720 0.439 1.180
VOT 6.951 1.105 6.289 0.000 *** 1044.086 119.646 9111.000
A-Negative −0.393 0.469 −0.838 0.402 0.675 0.269 1.693
B-Affirmative −1.155 0.650 −1.777 0.076 . 0.315 0.088 1.126
VOT: A-Negative 1.422 1.211 1.174 0.240 4.144 0.386 44.450 VOT: B-Affirmative 7.547 3.161 2.387 0.017 * 1895.088 3.861 9.302E+05
Kinki Intercept −1.281 0.304 −4.211 0.000 *** 0.278 0.153 0.504
VOT 7.754 1.131 6.856 0.000 *** 2329.960 253.900 21380.000
A-Negative −0.090 0.674 −0.134 0.893 0.914 0.244 3.421
B-Affirmative −0.993 0.747 −1.331 0.183 0.370 0.086 1.600
VOT: A-Negative −0.778 1.969 −0.395 0.693 0.459 0.010 21.760 VOT: B-Affirmative 3.720 3.120 1.192 0.233 41.251 0.091 18670.000 Ch¯ubu
―
Significance codes: 0 ‘***’ 0.001 ‘**’ 0.01 ‘*’ 0.05 ‘.’ 0.1 ‘ ’ 1
Figure 7 Prediction curves estimated by mixed effects logistic regression models (Clear speech VOT). of normal speech are also plotted. In all regions, the
difference between the categories is greater in clear speech than for the normal speech “Isolated” case. In order to make the difference between the categories clearer, in the VOT case, either the way the negative VOT of the voiced stops was lengthened causing it to draw away from the positive VOT of voiceless stops or the way each category was condensed to keep the distance between the two categories was used. However, in the case of fo, primarily the latter was used to separate each category.
Compared to the clear speech conditions A and B, variation in the fo of condition C was quite large. Unlike A and B in which the whole sentence receives focus, in condition C, two elements receiving focus
are contiguous. Since the fo of the “C-Negative” that first receives focus is quite high while that of the “C-Affirmative” that follows is relatively low, this can be seen as a case of accent weakening in which the accent of a following element is suppressed (K¯ori 1989). Com-paring “C-Negative” and “C-Affirmative”, in all regions the separation between the categories was more distant, and, from the perspective of differentiating the stop categories, the effect of clear speech seems to be more apparent with the negative than with the affirmative. However, when the “A-Negative” and “B-Affirmative” are compared, the reverse situation obtains and in all regions the separation between the two categories is more distant with the “B-Affirmative” case, and the effect of clear speech is high with affirmative utterances.
Figure 8 fo for normal speech (isolated) and clear speech (conditions A, B, and C).
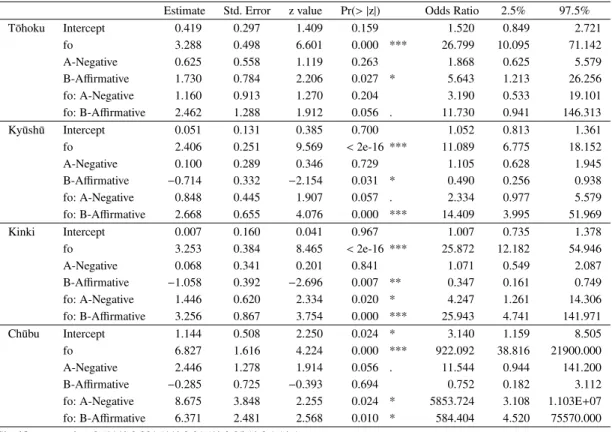
In order to examine whether the various conditions in clear speech are significantly associated with the stop contrast compared to the “Isolated” case, a logistic regression analysis was conducted. The independent variables are speech type (reference category: Isolated) and fo and the dependent variable is the stop contrast (reference category: Voiced). Since the variation in fo in condition C is large, and because that alone could be statistically significant, here only the A and B conditions are compared with the “Isolated” case. As was the case with VOT, attention is paid to the interactions. Table 6 presents a summary of the models and the odds ratios with confidence intervals. Figure 9 shows the prediction curves.
Looking at the coefficients in Table 6, in T¯ohoku, Ky¯ush¯u, and Kinki, the influence of “fo: B-Affirmative” on the stop contrast is greater than that of “fo: A-Negative”, but in the Ch¯ubu region the opposite relation obtains and the influence of “fo: A-Negative” is greater than that of “fo: B-Affirmative”. Other than the T¯ohoku and Ky¯ush¯u “fo: A-Negative”, all are significant at the 5% level. A look at the odds ratios shows that for T¯ohoku, Ky¯ush¯u, and Kinki, the influence of “fo: B-Affirmative” on the stop contrast is 3.7 times, 6.2 times, and 6.1 times that of “fo: A-Negative”, respectively, and for Ch¯ubu the influence of “fo: A-Negative” is about 10 times that of “fo: B-Affirmative”.
The prediction curves in Figure 9 are the results of the interactions contrasted with the “Isolated” case. The slopes of the curves were determined by coefficients, which were estimated by the mixed effects logistic
regression models. Compared to T¯ohoku, the curve of “fo: B-Affirmative” in Ky¯ush¯u, Kinki, and Ch¯ubu appear later (dashed line). It is because in Table 6, the coefficients for “fo: B-Affirmative” include negative values. If a coefficient is positive, the higher the fo, the higher the probability of a voiceless stop and if the coefficient is negative, the reverse is true, and the probability of a voiced stop is high. As seen in Figure 8, the fo values for voiced stops of “B-Affirmative” case were slightly higher than that of “Isolated” case in Ky¯ush¯u, Kinki, and Ch¯ubu compared to Tohoku. The logistic regression models were based on the measured values in Figure 8, thus the model predicted that these three regions required a higher fo to be a voiced stop.
As seen in Figure 9, the differences in slope between “Isolated” case and the A and B conditions are large compared to the VOT case. More regions in Table 6 show statistical significances than was the case for VOT, and at first glance one gains the impression that in clear speech the effects of fo are greater than those of VOT, but that is not necessarily the case. Comparing the interaction coefficients in Tables 5 and 6, for example, in Kinki the coefficient of “fo: B-Affirmative” is smaller than the coefficient of “VOT: B-Affirmative”, but it is significant. Since, as described in footnote 5, the slope of the interaction item is the product of the coefficient of “fo (Isolated)” and the coefficient of the interaction item, it is more difficult for the VOT, for which the slope of “Isolated” is already steep, to show differences with clear speech, compared to fo, for which that is not the case. In the next section, we will explore which
Table 6 A summary of mixed effects logistic regression models and odds ratios (Clear speech fo). Estimate Std. Error z value Pr(> |z|) Odds Ratio 2.5% 97.5%
T ¯ohoku Intercept 0.419 0.297 1.409 0.159 1.520 0.849 2.721
fo 3.288 0.498 6.601 0.000 *** 26.799 10.095 71.142
A-Negative 0.625 0.558 1.119 0.263 1.868 0.625 5.579
B-Affirmative 1.730 0.784 2.206 0.027 * 5.643 1.213 26.256
fo: A-Negative 1.160 0.913 1.270 0.204 3.190 0.533 19.101
fo: B-Affirmative 2.462 1.288 1.912 0.056 . 11.730 0.941 146.313
Ky¯ush¯u Intercept 0.051 0.131 0.385 0.700 1.052 0.813 1.361
fo 2.406 0.251 9.569 < 2e-16 *** 11.089 6.775 18.152
A-Negative 0.100 0.289 0.346 0.729 1.105 0.628 1.945
B-Affirmative −0.714 0.332 −2.154 0.031 * 0.490 0.256 0.938
fo: A-Negative 0.848 0.445 1.907 0.057 . 2.334 0.977 5.579 fo: B-Affirmative 2.668 0.655 4.076 0.000 *** 14.409 3.995 51.969
Kinki Intercept 0.007 0.160 0.041 0.967 1.007 0.735 1.378
fo 3.253 0.384 8.465 < 2e-16 *** 25.872 12.182 54.946
A-Negative 0.068 0.341 0.201 0.841 1.071 0.549 2.087
B-Affirmative −1.058 0.392 −2.696 0.007 ** 0.347 0.161 0.749
fo: A-Negative 1.446 0.620 2.334 0.020 * 4.247 1.261 14.306 fo: B-Affirmative 3.256 0.867 3.754 0.000 *** 25.943 4.741 141.971
Ch¯ubu Intercept 1.144 0.508 2.250 0.024 * 3.140 1.159 8.505
fo 6.827 1.616 4.224 0.000 *** 922.092 38.816 21900.000
A-Negative 2.446 1.278 1.914 0.056 . 11.544 0.944 141.200
B-Affirmative −0.285 0.725 −0.393 0.694 0.752 0.182 3.112
fo: A-Negative 8.675 3.848 2.255 0.024 * 5853.724 3.108 1.103E+07 fo: B-Affirmative 6.371 2.481 2.568 0.010 * 584.404 4.520 75570.000 Significance codes: 0 ‘***’ 0.001 ‘**’ 0.01 ‘*’ 0.05 ‘.’ 0.1 ‘ ’ 1
Figure 9 Prediction curves estimated by mixed effects logistic regression models (Clear speech fo). of VOT and fo in clear speech is further enhanced to
differentiate the stop categories.
4.2.3 Correct Classification Rate (CCR) in Normal Speech and Clear Speech
The effects of VOT and of fo in normal speech and clear speech will be examined together. Figure 10 shows scatterplots of VOT and fo. Only A and B con-ditions are presented from clear speech. Since putting A and B together means each consonant is produced twice, in order to make the number of tokens match, for the normal speech, the tokens for vowel/a/ in Figure 5
were used, which were produced twice. The number of tokens, including those out of range, for both normal speech and clear speech for each of the categories is 60 in T¯ohoku, 150 in Ky¯ush¯u, 138 in Kinki, and 84 in Ch¯ubu. As seen in the previous section, the effect of clear speech on the stop contrast varies by region. One region has more effect of clear speech in “A-Negative” case, other regions in “B-Affirmative” case, but it is clear that, looking at clear speech overall, in all re-gions the voiced-voiceless distinction is greater in clear speech than in normal speech. The difference between
Figure 10 VOT-fo space for normal speech (top) and clear speech (bottom).
Table 7 Odds ratios and confidence intervals for normal speech and clear speech.
Normal speech Clear speech
Odds Ratio 2.5% 97.5% Odds Ratio 2.5% 97.5% T ¯ohoku VOT 42.950 6.805 271.097 1767.217 7.367 4.239E+05
fo 10.318 2.603 40.900 764.637 3.909 1.496E+05 Ky¯ush¯u VOT 31.924 13.469 75.667 2898.157 46.689 1.799E+05
fo 5.022 2.892 8.722 6.335 1.758 22.837
Kinki VOT 1061.160 40.054 2.811E+04 1126.896 61.696 2.058E+04
fo 16.820 4.015 70.470 18.778 4.008 4.008
Ch¯ubu VOT 7004.973 85.446 5.743E+05
— — —
fo 4.503 1.795 11.297
normal speech and clear speech appears clearly in Figure 10.
Now we consider the relative importance of VOT and fo in normal speech and clear speech. Table 7 presents the odds ratios and confidence intervals. The result for Ch¯ubu for clear speech could not be obtained because of the separation of the two categories. As can be seen from Table 7, the influence of VOT in both normal speech and clear speech is greater than that of fo in all regions. Concretely, compared to the influence of fo, that of VOT is, in the order of normal speech, clear speech: T¯ohoku 4.2 times and 2.3 times, Ky¯ush¯u 6.4 times and 457.4 times, Kinki 63.1 times and 60.0 times, and Ch¯ubu, normal speech only, 1555.6 times. In the case of T¯ohoku, the odds ratio of VOT over that of fo is smaller in clear speech than in normal speech, meaning that the influence of fo is greater than that of VOT. That is, in T¯ohoku, it is fo that is enhanced in clear speech.
Similarly, in Kinki as well, it is fo rather than VOT that is enhanced in clear speech (however, this does not change the fact that the influence of VOT is greater than that of fo in both regions because the odds ratio is greater than 1). In Ky¯ush¯u, it is absolutely VOT that is enhanced in clear speech. It is impossible to make a judgement about Ch¯ubu as an odds ratio could not be obtained for clear speech.
Table 8 shows the results for CCR in normal speech and clear speech. The CCR is the classification accu-racy predicted by the logistic regression models with VOT and fo as independent variables in Table 7. Each region includes three CCRs; overall, voiced stops, and voiceless stops. As with Table 7, the result for Ch¯ubu could not be obtained for clear speech.
Setting aside Ch¯ubu, in all regions the CCR is higher with clear speech than with normal speech. The CCR with normal speech in Ky¯ush¯u is slightly low compared
Table 8 Correct classification rates for normal speech and clear speech.
T ¯ohoku Ky¯ush¯u Kinki Ch¯ubu
All Voiced Voiceless All Voiced Voiceless All Voiced Voiceless All Voiced Voiceless
Normal speech 94% 93% 95% 88% 87% 89% 94% 95% 92% 93% 89% 96%
Clear speech 97% 98% 97% 97% 97% 97% 97% 98% 97% — — —
Table 9 A summary of mixed effects logistic regression models and odds ratios for Miyazaki dialect (Normal speech). Estimate Std. Error z value Pr(> |z|) Odds Ratio 2.5% 97.5% Miyazaki Intercept −0.061 0.181 −0.335 0.738 0.941 0.660 1.342 VOT 3.248 0.325 10.006 < 2e-16 *** 25.746 13.626 48.645 fo 1.783 0.200 8.910 < 2e-16 *** 5.946 4.017 8.801 Significance codes: 0 ‘***’ 0.001 ‘**’ 0.01 ‘*’ 0.05 ‘.’ 0.1 ‘ ’ 1
to other regions, but, since the VOT effect emerged extremely strongly in clear speech, as seen in Table 7, the CCR with clear speech is the same as other regions. In all the four regions, the CCRs are quite high at 97% in clear speech, and it can probably be said that in four regions discussed in this study, the stop contrast in word-initial position can be almost completely ex-plained by VOT and post-stop fo.
4.3 VOT and Post-stop fo in Accentless Regions
First, we will report the results for Experiment I. Of the speakers whose data was explained in section 3.1.1, 12 were native speakers of the Miyazaki dialect, which has no lexical pitch accent. A logistic regres-sion analysis was conducted with VOT and fo as the independent variables and the stop categories as the dependent variable. Table 9 provides a summary of mixed effects logistic regression models along with odds ratios and confidence intervals, and Figure 11 shows prediction curves estimated by the models. In Table 9, the main effect of VOT and fo are significant, and it can be said from their coefficients, the effect of VOT is greater than that of fo. Looking at the odds ratios, the influence of VOT is 4.3 times (25.745/5.946) greater than fo. The slopes of the prediction curves also show the magnitude of the influence of VOT, steep for VOT and gentle for fo.
Next, from Experiment II, we will report on which of VOT and fo is enhanced in clear speech compared to the “Isolated” case. Figure 12 shows the results for VOT (left) and fo (right). In the VOT plot, the distance between voiced and voiceless stops is greater for all conditions compared to the “Isolated” case, and it is accomplished by reducing the variation of each category. In the fo plot, the use of fo in clear speech appears to be less active than that of VOT.
Figure 11 Prediction curves estimated by mixed effects logistic regression models for Miyazaki dialect (Normal speech).
For “B-Affirmative” and “C-Negative” the distance between the two categories is clearly greater than that in the “Isolated” case, but for “A-Negative” and “C-Affirmative” the medians of each category are closer than in the “Isolated” case. One thing that is consistent with other regions is that the C-condition includes a huge fluctuation in fo, suggesting that a special focus was put on “C-Negative” and accent weakening occurred on “C-Affirmative”.
A logistic regression analysis was conducted using the data from Figure 12. The independent variables are speech type (A-Negative, B-Affirmative, reference category: Isolated) and VOT or fo, and the depen-dent variable is the stop contrast (reference category: Voiced). Table 10 provides a summary of the models and the odds ratios with confidence intervals, and Fig-ure 13 shows prediction curves. The interaction items are of interest. From their coefficients, it can be said that the effect of VOT and fo on the stop contrast is greater with the affirmative condition than the negative condition, but it is only for fo with the “B-Affirmative” condition that it is statistically significant. However, as described for other regions in section 4.2.2, since the
Figure 12 VOT for normal speech (isolated) and clear speech (conditions A, B, and C) in Miyazaki dialect.
Table 10 A summary of mixed effects logistic regression models and odds ratios for Miyazaki dialect (Clear speech). Estimate Std. Error z value Pr(> |z|) Odds Ratio 2.5% 97.5%
VOT Intercept 0.176 0.475 0.370 0.711 1.192 0.470 3.021
VOT 8.502 2.697 3.152 0.002 ** 4922.000 24.910 9.726E+05
A-Negative −0.450 0.799 −0.563 0.573 0.638 0.133 3.051
B-Affirmative 0.122 1.236 0.099 0.921 1.130 0.100 12.740
VOT: A-Negative 3.982 2.497 1.595 0.111 53.620 0.402 7159.000 VOT: B-Affirmative 11.295 7.736 1.460 0.144 80 390.000 0.021 3.094E+11
fo Intercept 0.038 0.185 0.205 0.838 1.039 0.722 1.494
fo 2.128 0.319 6.669 0.000 *** 8.396 4.492 15.691
A-Negative −0.270 0.411 −0.656 0.512 0.763 0.341 1.710
B-Affirmative −1.006 0.482 −2.085 0.037 * 0.366 0.142 0.942
fo: A-Negative 0.174 0.611 0.284 0.776 1.190 0.359 3.939
fo: B-Affirmative 1.813 0.821 2.208 0.027 * 6.131 1.226 30.655 Significance codes: 0 ‘***’ 0.001 ‘**’ 0.01 ‘*’ 0.05 ‘.’ 0.1 ‘ ’ 1
Figure 13 Prediction curves estimated by mixed effects logistic regression models for Miyazaki dialect (Clear speech).
coefficient for the VOT in the “Isolated” case is so large, it is difficult for the coefficients of the interactions to become significant, but for fo, for which that is not the case, it is easy for even a small difference to become significant. In Figure 13 as well, the difference between the “Isolated” case and the “B-Affirmative” condition is large, but the slope of the fo curve is more gentle than that of VOT.
Figure 14 shows scatterplots of VOT and fo, and Ta-ble 11 presents the odds ratios with confidence intervals
Figure 14 VOT-fo space for normal speech and clear speech in the Miyazaki dialect.
for normal and clear speech. The number of tokens for normal speech and clear speech is the same, n=72 for each category. Although it is possible to distinguish the two categories in normal speech, in clear speech the distance between the categories is even more clear, and it is obvious that the effect of VOT is greater than that of fo. Looking at the odds ratios in Table 11, the relative importance of VOT over fo is about 4.8 (60.837/12.593) for normal speech and 2079.3 (8013.787/3.854) for clear speech, indicating that what was enhanced in clear speech is VOT, not fo.
Table 11 Odds ratios and confidence intervals for normal speech and clear speech in the Miyazaki dialect.
Normal speech Clear speech
Odds Ratio 2.5% 97.5% Odds Ratio 2.5% 97.5% Miyazaki VOT 60.837 10.762 343.891 8013.787 57.169 1.123E+06
fo 12.593 3.039 52.183 3.854 0.994 14.934
Table 12 Correct classification rates for normal speech and clear speech in the Miyazaki dialect.
All Voiced Voiceless Normal speech 90% 89% 90%
Clear speech 99% 99% 99%
Table 12 presents the result of CCR. The CCR with normal speech is 90%, but it is extremely high with clear speech at 99%. Compared with the CCR of other regions in Table 8, that of normal speech is lower than T¯ohoku, Kinki, or Ch¯ubu, but it is higher than that of any other region with clear speech. The higher CCR in clear speech, as can be seen in the odds ratios, is entirely due to the enhancement of VOT.
5. Discussion
We will first discuss the effect of fo in distinguishing stop categories based on the results described above. Following that, methods of eliciting clear speech will be discussed.
5.1 The Effect of Post-stop fo on Stop Voicing
The post-stop fo being low after a voiced stop and high after a voiceless stop is a characteristic that is found in many languages (Caisse 1981, Ohde 1984, Shimizu 1996, Dmitrieva et al. 2015, Kirby and Ladd 2016, among others). However, whether this difference in fo is used in distinguishing phonemic categories varies by language. In Seoul Korean, which has a three-way contrast, fo functions to distinguish between lenis and aspirated stops on a par with VOT, which distinguishes between fortis and aspirated/lenis stops. English has also post-stop fo differences in word-initial position, but the difference in fo is redundant as VOT is sufficient to distinguish the categories (Kong et al. 1012, Abrahamson and Whalen 2017). On the other hand, from what has been seen here, in Japanese the stop contrast is primarily made by VOT, but VOT alone is insufficient and post-stop fo is also associated with the contrast. The degree of fo effect differs depending on the dialect. In Tohoku, fo is used as a primary cue on a par with VOT, while in Chubu, its effect is minimal.
In the results, the odds ratios were used to find the rel-ative importance of VOT and fo in each of the regions. The odds ratio explains the relative importance between the predictors (independent variables) being discussed, but it does not give information as to how much of the whole phenomenon is explained by the predictors selected. In order to make the claim that in addition to VOT, post-stop fo is needed to distinguish stop categories, in this study both VOT and fo were picked up from the first and were considered by focusing on their relative importance in each region. However, as was clear from the results from the Ch¯ubu region and the Miyazaki dialect, there are cases where, depending on the region/dialect, it is possible to distinguish the categories by VOT alone. It would be desirable to examine specifically how much difference there is in CCR between the case of VOT alone, of fo alone, and of VOT+fo. The CCR provides the classification accuracy predicted by logistic regression models and explains the whole of the stop categories.
Table 13 presents the CCRs when the predictor is VOT alone, fo alone, and VOT+fo. Each region includes three different CCRs. The CCRs for VOT for normal speech in Experiment I are the same values as the average values in Table 4, and the CCRs for VOT+fo for normal and clear speech in Experiment II are the same values as the “All” values in Table 8. Experiment II used only the vowel/a/, but Experiment I includes tokens of all 5 vowels6). The normal speech was produced by reading a list (citation-form speech) and the clear speech was produced in a conversation style. Both of these are presented at once in order to discuss in various contexts.
For predictors, comparing VOT alone and fo alone, in Ky¯ush¯u, Kinki, and Ch¯ubu, in both Experiments I and II, the CCR of VOT alone was higher than that of fo alone. The dominant order of predictors in these regions can be said to be VOT a primary cue and fo a secondary cue. On the other hand, in T¯ohoku, in Experiment II the CCR of fo alone was higher than that of VOT, although the difference was slight, and in T¯ohoku it is possible for fo to be a primary cue. Comparing VOT alone and VOT+fo, aside from Ch¯ubu, the CCR for VOT alone was the highest at 95% and for VOT+fo at 97%.
Table 13 Correct classification rates by parameter.
T ¯ohoku Ky¯ush¯u Kinki Ch¯ubu
Expt. I Expt.II Expt. I Expt.II Expt. I Expt.II Expt. I Expt.II Normal Normal Clear Normal Normal Clear Normal Normal Clear Normal Normal Clear
VOT 83% 81% 94% 83% 84% 95% 87% 86% 93% 90% 91% 99%
fo 81% 85% 97% 78% 75% 81% 80% 80% 85% 80% 76% 93%
VOT+ fo 90% 94% 97% 89% 88% 97% 93% 94% 97% 93% 93% —
For speech modes, in clear speech, the CCR in T¯ohoku was higher for fo than for VOT, confirming that fo is an important cue on a par with VOT in T¯ohoku. On the other hand, the CCR in Ch¯ubu was already 99% for VOT alone and was higher than the 93% of VOT+fo in normal speech. Therefore, it can be said that in the case of Ch¯ubu although not without fo effect, the magnitude of fo effect is minimal compared to other regions, and VOT alone is sufficient for the stop contrast. Comparing VOT alone in clear speech and VOT+fo in normal speech, in T¯ohoku they have the same CCR, but in Kinki adding fo raises the CCR slightly. In contrast, in Ky¯ush¯u, the clear speech effect is greater than the fo effect. This is attributed to Miyazaki, in which the effect of VOT is as great as (and the effect of fo is as small as) in Ch¯ubu. In any case, leaving aside Ch¯ubu, the CCR was highest at 94% in normal speech and 97% in clear speech.
5.2 The Post-stop fo Effect in an Accentless Region
Changes in the VOT of word-initial lenis stops in Korean are said to be diachronic changes that occurred in dialects like the Seoul dialect that do not have pitch accents. As a result of the originally short VOT of lenis stops lengthening and merging with the VOT of aspirated stops, in the Seoul dialect, the function of distinguishing between lenis and aspirated stops shifted from VOT to post-stop fo (Kang 2014, Byun 2016a). However, as already described in section 1.2, since such a change is not found in dialects like the Gyeongsang dialect that do have a pitch accent system, some researchers have argued that, because fo is already used for lexical accent, the use of fo for segmental distinctions is avoided (Kenstowicz and Park 2006, Lee and Jongman 2012). In section 4.3, in order to see whether the same sort of change occurs in accentless Japanese dialects, consideration was given to speakers of the Miyazaki dialect, but the results were different from the Seoul dialect. In the Miyazaki dialect, there was seen no active use of fo for the stop contrast, and even in clear speech, the effect of VOT was much greater than the effect of fo. As shown in Table 14, in
Table 14 Correct classification rates by parameter for Miyazaki dialect.
Expt. I Expt.II Normal Normal Clear
VOT 85% 87% 99%
fo 78% 77% 82%
VOT+ fo 89% 90% 99%
Miyazaki, even VOT alone reached a CCR of 99% in clear speech, higher than VOT with fo added in normal speech. Whether the results for Miyazaki are unique to the Miyazaki dialect or are common to all accentless Japanese dialects cannot be determined just from the results of this study, but if the latter is the case, another interpretation that is different from the case of the Seoul dialect would be needed.
5.3 Ways to Elicit Clear Speech
In Experiment II, which examined which of VOT and fo was enhanced in clear speech in contrast to normal speech, to a greater or lesser extent, in T¯ohoku and Kinki, fo was enhanced and in Ky¯ush¯u, VOT was enhanced (Table 7, no result for Ch¯ubu in clear speech was obtained). Whether it was VOT or fo, all have in common that, compared to normal speech, in clear speech acoustic characteristics were enhanced in order to distinguish between the two stop categories, and their effects were confirmed in Tables 13 and 14. This study used the A-, B-, and C-conditions to elicit clear speech. Now let us consider which was the most effective.
Starting from considering conditions A and B, Ta-ble 15 repeats the odds ratios of the interaction sections of Tables 5 and 6. Looking at Table 15, it can be seen that, compared to the normal speech “Isolated” case, for both VOT and fo in Ky¯ush¯u and Kinki, the odds ratio of the “B-Affirmative” condition is greater than that of the “A-Negative” condition, and, thus, having the speaker respond XX desu ‘It’s XX’ is an effective way of eliciting both VOT and fo. In contrast, in T¯ohoku, the odds ratio for fo is higher with the affirmative condition and that for VOT is higher with