Research and Development of Highly Active and
Durable Cathode Catalysts for Polymer Electrolyte
Fuel Cells
A Doctoral Thesis Presented to the Interdisciplinary Graduate
School of Medicine and Engineering University of Yamanashi
March 2016
Contents
Chapter 1 : General Introduction
1-1. Background 1
1-2. Polymer electrolyte fuel cells (PEFCs) 1 1-3. Problems for catalyst layers (CLs) in PEFCs 4
1-4. Objective of the present research 7
1-5. References 11
Chapter 2 : Oxygen Reduction Reaction Activity and
Durability at High Potential of Pt Catalysts Supported on
Titanium Carbide
2-1. Introduction 13
2-2. Experimental 15 2-2-1. Preparation of Pt/TiC catalyst 15 2-2-2. Characterization of Pt/TiC 17
2-2-3. Electrochemical measurements 17
2-3. Results and discussion 19
2-3-1. Characterization of Pt/TiC catalysts 19
2-3-3. Durability of Pt/TiC-600 °C in the potential step cycle test 32
2-4. Conclusion 36
2-5. References 37
Chapter 3 : Oxygen Reduction Reaction Activity of
Carbon-Supported Pt-M (M = Fe, Co, and Ni) Alloys with
Stabilized Pt-Skin Layers
3-1. Introduction 40
3-2. Experimental 45
3-2-1. Preparation of Pt2AL−Pt-M/C Catalysts 45
3-2-2. Characterization and Electrochemical Measurement of
Pt2AL−Pt-M/C 46 3-2-3. Electrochemical Measurement of Pt2AL−Pt-M/C 46
3-3. Results and discussion 48
3-3-1. Characterization of Pt2AL−Pt-M/C catalysts 48 3-3-2. ORR activities and H2O2 yields of Pt2AL−Pt-M/C 53 3-3-3. Durability of Pt2AL−Pt-M/C to potential changes 62
3-4. Conclusion 65
3-5. References 66
List of publications
72Meeting abstracts
73-1-
Chapter 1
General Introduction
1-1. Background
Since the industrial revolution, people have utilized a huge amount of energy, leading to rich lives. The primary energy dominantly used so far is the fossil fuels such as coal, petroleum oil, and natural gas. First, they were combusted to generate heat energy directly or to operate steam engines. Since 1960’s (specifically in Japan), a vast amount of fossil fuels have been combusted to generate electricity, which is the most convenient form of the secondary energy, by thermal power plants. Also, gasoline and diesel oil have been used to operate internal combustion engines (ICE) for vehicles. The energy conversion efficiency of the thermal power generation is, however, not so high, typically as low as 40%, due to a limitation of the Carnot efficiency for the conversion of the thermal energy into the mechanical energy. The efficiency of the ICE is lower than a large-size thermal power generation; typically 15% for small-size vehicles.
Since the East Japan Disaster by big earthquake and the serious trouble of Fukushima nuclear power plant (by Tsunami) in 2011, ca. 90% of electricity is generated by the thermal power generation in Japan (show in Fig. 1-1). The consumption (or waste) of the fossil fuels with low efficiency in both power plants and vehicles leads two big problems. The first is a risk of the depletion of resources. The second is the emission of a large amount of CO2, which has a considerable impact on a
-2-
global warming. Besides CO2, air pollutants of NOx, SOx and particulates (such as
PM2.5) caused serious problems world wide.
-3-
It is really important to develop alternative clean power generation systems with higher conversion efficiency. In recent years, large-scale power generation systems using various renewable energy technologies (photovoltaic cells, wind power, thermoelectrics etc) are increasing rapidly. Because the power output strongly depends on weather conditions and time (daytime and nighttime), which may not always meet the demand, they cannot become the main basic (primary) power source. Hence, a large-scale and long term energy storage system is necessary, besides batteries (small-scale and short-term). Hydrogen production by the use of renewable power is a good option for such an energy storage.
The fuel cells (FCs) are devices that produce electric power via the electrochemical reaction of fuel (reductant) and oxygen (oxidant). The overall cell reaction is the combustion of the fuel. The maximum electrical energy utilized in FCs is Gibbs free energy, ΔG. of the cell reaction, whereas the energy obtained by the combustion of the fuel under a constant pressure is the enthalpy, ΔH. The theoretical conversion efficiency of the FC (conventionally defined as ε = ΔG°/ΔH°, where “°” denotes the standard condition) is never limited by the Carnot efficiency, and, therefore, is higher than the thermal engines. Let’s consider an oxidation reaction of hydrogen to generate liquid water.
H2 + 1/2O2 → H2O
Pure hydrogen is available from the water electrolysis by using the renewable energy as described above. The FC operated with pure H2 emits water only, i.e., completely
-4- bio-gas.
CH4 + 2H2O → 4H2 + CO2
Such an H2-rich gas is called as a reformate. Carbon dioxide is, of course, produced in
the reforming reaction. However, because the energy conversion efficiency of the FCs is, in principle, about two times higher than that of conventional thermal power generation plants, both CO2 emission and the consumption of the fuel are reduced to
half. Furthermore, the fuel is not combusted at high temperature, NOx (oxidation
product of N2 in air) emission is negligibly low.
1-2. Polymer Electrolyte Fuel Cells (PEFCs)
There are several kinds of FCs such as alkaline fuel cell (AFC), polymer electrolyte fuel cell(PEFC), phosphoric acid fuel cell (PAFC), molten carbonate fuel cell (MCFC), and solid oxide fuel cell (SOFC). These FCs are classified by the kinds of electrolytes and the operating temperatures.
PEFC can be operated at relatively low temperature (from ambient temperature to ca. 100 oC),1-3 therefore, having advantages of a quick start-up and easy maintenance. As described below, the electrolyte material used is polymer membrane of light weight, leading to high power density per unit mass of FCs. Due to such advantages, PEFCs have been developed specifically for clean and energy-efficient applications such as residential co-generation systems and fuel cell vehicles (FCVs). Since the first commercialization of a 1 kW-class residential PEFC (ENE·FARM®) system in 2009 in Japan, the cumulative number of systems installed has exceeded
-5-
120,000 in fiscal year 2014. The Toyota Motor Corporation commenced to sell a FCV called the “MIRAI” in December, 2014.
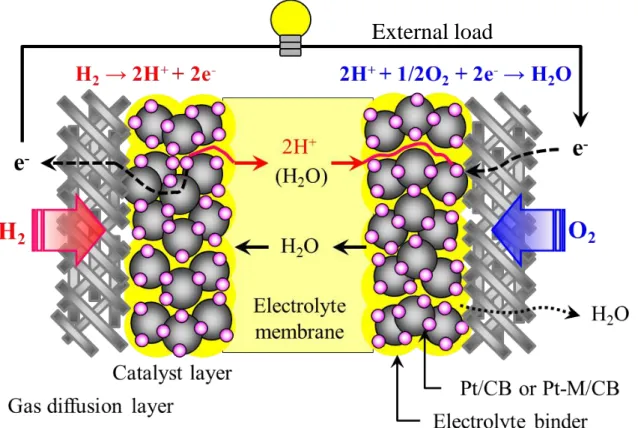
The operation principle of PEFC is schematically shown in Figure 1-2. In general, the single cell for PEFC consists of the anode, cathode and the polymer electrolyte membrane (proton exchange membrane, PEM). Hydrogen is fed to the anode catalysts layer (CL), and air (oxygen) is fed to the cathode CL. At the anode, hydrogen gas is oxidized into protons by the hydrogen oxidation reaction (HOR). Protons move to the cathode CL through the PEM. The electrons also move to the cathode through an external circuit. Protons and electrons react with oxygen in the cathode CL, and water is generated by the oxygen reduction reaction (ORR). These reactions are written below,
Anode :H2 → 2H+ + 2e-
Cathode :1/2O2 + 2H+ + 2e- → H2O
-6-
Figure 1-2 Schematic of a PEFC
-7-
1-3. Problems for catalyst layers (CLs) in PEFCs
The most important part of the PEFC single cell is the membrane-electrode-assembly (MEA). The MEA is composed of a PEM sandwiched between anode and cathode CLs. The PEMs employed so far are perfluorinated sulfonic acid polymers such as Nafion. In general, the anode and cathode CLs were prepared from platinum (Pt) and Pt-alloy nanoparticles supported on the carbon material, together with the proton-conductive electrolyte binder (or ionomer). This is because precious metals such as Pt exhibit high electrocatalytic activities for both the HOR and the ORR and corrosion resistance for the operation potentials in the highly acidic polymer electrolyte. The reduction of the amount of expensive Pt used in the CLs is indispensable for the large-scale commercialization of PEFCs. Therefore, the alternative catalyst with high activity and durability must be developed.
In order to increase ORR activity at the cathode catalysts, it is necessary to increase the Pt utilization and the area-specific activity js. As the result of an extensive
research and development (R & D) program involving the catalyst itself and its effective utilization in the cathode CLs, the Pt loading has been reduced remarkably. However, to promote large-scale commercialization, it is essential to reduce the amount of Pt further, by increasing both the mass activity (MA, A gPt−1) and the
durability of the catalyst. The MA is defined as the product of the area-specific activity
js (ORR current density per active surface area, A m−2) and the electrochemically
active area ECA (m2 gPt−1).
-8-
ORR at minimum Pt loading in the CLs. So far, Pt nanoparticles with ECA values as large as 100 m2 g(Pt)−1 have been dispersed on high-surface-area (HSA) supports such
as carbon black (CB, e.g., SCB = 800 m2 g−1), denoted as Pt/CB.
The use of Pt alloyed with nonprecious metals such as Cr, Fe, Co, Ni, Cu, etc. has been recognized to be very effective in increasing js.4-7 By using multiple types
of analyses,6,8 our group clearly demonstrated that nonprecious metal elements in Pt-M (M = Fe, Co, Ni) solid solutions were leached out in an acidic electrolyte, but a Pt-skin layer was spontaneously formed on the alloy surface. The Pt-skin layer protected the underlying alloy from corrosion, and its electronic state modified by the alloy induced the enhanced js values.
In order to increase durability of cathode catalysts, it is necessary to use a stable support material in PEFC operating conditions. A severe degradation of the CB support of the Pt/CB cathode catalysts has been recognized at high potentials, especially during the start-stop cycles of FCVs.9-14 It is known that the corrosion rate of carbon itself is low even under PEFC operating conditions, but the rate is accelerated by Pt catalysts loading with increasing temperature and potential. The corrosion of the carbon support leads to an agglomeration (sintering) and/or a detachment of Pt nanoparticles from the surface, together with a reduction of the electronic conductance in the CL.15-22 Thus, the ECA for the ORR decreases
-9-
1-4. Objective of the present research
For the cathode catalyst, New Energy and Industrial Technology Development Organization (NEDO) and the Fuel Cell Commercialization Conference of Japan (FCCJ) have set a target to enhance 10-fold catalytic activity and 2-fold the durability in order to reduce the Pt amount to 1/10, compared with those levels in 2007.
In the present research, I have investigated novel cathode catalysts to obtain clear design concept to achieve the target.
In Chapter 2, I focus on the support material having high electrical conductivity together with chemical stability at high potentials in acidic media in order to enhanced durability of cathode catalyst. The support material employed was titanium carbide (TiC), which exhibits high electrical conductivity and electrochemical stabilityin strong acidic media and high potentials. I have prepared Pt nanoparticles supported on TiC (Pt/TiC) by colloidal method. The ORR activity and the durability of the Pt/TiC were examined by the use of the rotating disk electrode (RDE) technique. It was found that Pt/TiC exhibited much higher durability at high potential than that of commercial Pt/CB (c-Pt/CB) at high potential. The MA of Pt/TiC-600 °C at 0.85 V was comparable to that of c-Pt/CB.
As the second step, the MA for the ORR should be increased (higher than Pt) with keeping high durability. I consider Pt-M (M = Fe, Co, and Ni) alloy nanoparticles as the candidates. However, before supporting them on the stable support such as TiC, two important subjects must be solved. The first is the suppression of
-10-
dealloying of conventional Pt-M in strong acidic media at practical temperatures. The second is the increase in the durability for potential changes of load-cycles (typically between 0.6 V and 1.0 V), which are more frequent than the start-stop cycles. For such purposes, I have chosen carbon material as the support, because the corrosion of carbon is not so severe below 1.0 V. It was found in our group that PtCo alloy with two atomic layers of Pt-skin, Pt2AL−PtCo/GCB (graphitized carbon black, specific surface
area = 150 m2 g–1), exhibited superior performances both in the MA and the durability versus potential changes (simulating load-changes and start-stop cycles of FCVs), compared with those of conventional ones. Very recently, by the use of high-surface area carbon support (ca. 780 m2 g–1), Pt2AL−PtFe/C, Pt2AL−PtCo/C, and Pt2AL−PtNi/C
have been synthesized in our group. In Chapter 3, I have examined the ORR activity and the durability for the first time by the use of the multi-channel flow double electrode method. I have obtained a clue for designing highly active, highly durable catalysts.
-11-
1-5. References
(1) Dhar, H. P. J. Electroanal. Chem. 1993, 357, 237-250. (2) Steele, B. C. H.; Heinzel, A. Nature 2001, 414, 345-352.
(3) Carrette, L.; Friedrich, K. A.; Stimming, U. Fuel Cells 2001, 1, 5-39.
(4) Toda, T.; Igarashi, H.; Uchida, H.; Watanabe, M. J. Electrochem. Soc., 1999, 146, 3750.
(5) Gasteiger, H. A.; Kocha, S. S.; Sompalli, B.; Wagner, F. T. Appl. Catal. B: Environ.,
2005, 56, 9.
(6) Watanabe, M.; Tryk, D. A.; Wakisaka, M.; Yano, H.; Uchida, H. Electrochim. Acta,
2012, 84, 187.
(7) Wang, C.; Markovic, N. M.; Stamenkovic, V. R. ACS Catal., 2012, 2, 891.
(8) Uchida, H.; Yano, H.; Wakisaka, M.; Watanabe, M. Electrochemistry, 2011, 79, 303.
(9) Wilson, M. S.; Garzon, F. H.; Sickafus, K. E.; Gottesfeld, S. J. Electrochem. Soc.
1993, 140, 2872-2877.
(10) Willsaw, J.; Heitbaum, J. J. Electroanal. Chem. 1984, 161, 93-101 (11) Yu, X.; Ye, S. J. Power Sources. 2007, 172, 145-154.
(12) Tang, H.; Qi, Z. G.; Ramani, M.; Elter, J. F. J. Power Sources, 2006, 158, 1306-1312.
(13) Meyers, J. P.; Darling, R. M. J. Electrochem. Soc., 2006, 153, A1432-A1442. (14) Reiser, C. A.; Bregoli, L.; Patterson, T. W.; Yi, J. S.; Yang, D.; Perry, M. L.; Jarvi, T. D. Electrochem. Solid-State Lett., 2005, 8, A273-A276.
-12-
(15) Ferreira, P .J.; LaO, G. J.; Shao-Horn, Y.; Morgan, D.; Makharia, R.; Kocha, S.; Gasteiger, H. A. J. Electrochem. Soc., 2005, 152, A2256-A2271.
(16) Darling, R. M.; Meyers, J. P. J. Electrochem. Soc., 2003, 150, A1523-A1527. (17) Xie, J.; Wood, D. L.; Wayne, D. M.; Zawodinski, T. A.; Atanassov, P.; Borup, R. L.
J. Electrochem. Soc., 2005, 152, A104-A113.
(18) Xie, J.; Wood, D. L.; More, K. L.; Atanassov, P.; Borup, R. L. J. Electrochem. Soc.,
2005, 152, A1011-A1020.
(19) Stevens, D. A.; Hicks, M. T.; Haugen, G. M.; Dahn, J. R. J. Electrochem. Soc.,
2005, 152, A2309-A2315.
(20) Patterson, T. W.; Darling, R. M. Electrochem. Solid-State Lett., 2006, 9, A183-A185.
(21) Yoda, T.; Uchida, H.; Watanabe, M. Electrochim. Acta, 2007, 52, 5997-6006. (22) Hara, M.; Lee, M.; Liu, C-Y.; Chen, B-H.; Yamashita, Y.; Uchida, M.; Uchida, H.; Watanabe, M. Electrochim. Acta, 2012, 70, 171-181.
-13-
Chapter 2
Oxygen Reduction Reaction Activity and Durability at
High Potential of Pt Catalysts Supported on Titanium
Carbide
2-1. Introduction
Platinum nanoparticles highly dispersed on carbon black support, Pt/CB, is a one of the typical catalysts for the cathode of PEFC. However, carbon has an intrinsic thermodynamic instability as a result of its oxidative corrosion to carbon dioxide under the PEFC operating conditions of low pH and high humidity. It is, therefore, essential to develop novel cathode catalysts with both high MA for the ORR and high durability at high electrode potentials up to 1.5 V vs. RHE. So far, electronic conductive oxides or nitrides have been examined as stable supports for PEFCs, e.g., Pt/SnO2,1,2
Pt/TiO2,3-6 Pt/Ti4O7, 7,8 Pt/TiN,9 among others. The support materials used are typically
in the form of nanoparticles with high-surface-area (HAS) to disperse Pt catalyst particles uniformly, but the use of HSA supports often leads to a high contact resistance between the particles. These catalysts have some problems. For example, the ECA of Pt/SnO2 was lower than Pt/C, theSpecific activity jk of Pt/TiO2 was lower than
Pt/C, and Pt/TiN was required conductive path due to the high contact resistance. Recently, Kakinuma et al. have developed Sb-, Nb- and Ta-doped SnO2−δ nanoparticle
supports with a fused aggregated structure having both HSA and low contact resistance.10-13 They reported that Pt dispersed Nb-SnO2−δ and Ta-SnO2−δ exhibited
-14-
commercial Pt/CB (c-Pt/CB) catalysts. It was also found that the kinetically controlled specific ORR activities on various Pt/Nb-SnO2−δ catalysts increased with increasing
apparent electrical conductivity of the support.14
In the present research, I focus on the support material having high electrical conductivity together with chemical stability at high potentials in acidic media. Titanium carbide (TiC) exhibits high electrical conductivity. For example, the conductivity of bulk TiC has been reported to be as high as 1.5 × 10⁴ S cm–1,15 which is approximately one order of magnitude higher than that of bulk Ta-SnO2−δ.16 In strong
acidic media and high potentials, TiC is chemically and electrochemically stable. Indeed, several reports are available for the application of TiC or TiC-based materials to bipolar plates in phosphoric acid fuel cells (PAFCs),17 Pt/TiC cathode catalysts for PAFCs,18 and Ir-dispersed TiC as the anode catalyst (O2 evolution) in a proton
exchange membrane water electrolysis system.19 PtO nanoparticles were first dispersed on the TiC support by a colloidal method.20,21 After a heat treatment at 600 °C in 1% H2/N2, hemispherical Pt nanoparticles with clear lattice fringes were found to be well
dispersed on the TiC support (Pt/TiC-600 °C). I have examined the ORR activity and durability of Pt/TiC-600°C by the use of the rotating disk electrode (RDE) technique.
-15-
2-2. Experimental
2-2-1. Preparation of Pt/TiC catalyst
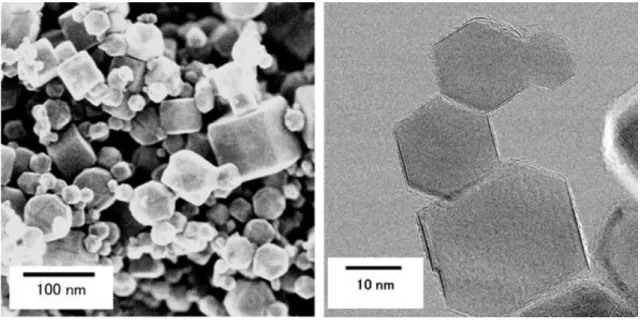
Figure 2-1 shows SEM and TEM images of TiC nanoparticles. TiC nanoparticles (average diameter = ca. 40 nm, prepared by a radio-frequency plasma method) were supplied by Nisshin Engineering Co. The surface area of the TiC nanoparticles was measured to be 77 m2 g(Pt)–1 by the Brunauer, Emmett and Teller
(BET) adsorption method (BELSORP-max, BEL Japan Inc.). Platinum nanoparticles were dispersed on the TiC support by the colloidal method.20,21 A calculated amount of
hexachloroplatinic acid was dissolved in sodium hydrogen sulfite solution under stirring. In order to prepare a Pt (or PtOx) colloid, hydrogen peroxide was added to the
solution at a rate of 2 ml min–1, and the pH value was held at 5.0 by adding 5 wt.% sodium hydroxide solution. A dispersion of TiC powder, pure water (Milli-Q water, 18.2 MΩ cm, Millipore Japan Co., Ltd.) and catalase (to decompose excess H2O2)
were added into the Pt colloid solution at room temperature, followed by stirring for 6 h. The powder obtained was filtered and washed thoroughly with pure water. The powder (PtOx/TiC) was then heat-treated at 600 °C in 1% H2-containing N2
atmosphere for 2 h and quenched to room temperature. The amount of Pt loaded on the TiC support was measured by an inductively coupled plasma-mass spectrometric analyzer (ICP-MS, 7500CX, Agilent Technologies Inc.).
-16-
-17-
2-2-2. Characterization of Pt/TiC
The crystalline phase of the Pt/TiC catalyst was characterized using X-ray diffraction (XRD, Ultima 4, Rigaku Co.) with monochromated CuKα radiation
(0.15406 nm, 40 kV, 40 mA). The morphology of the catalyst was observed by transmission electron microscopy (TEM, H-9500, Hitachi High-Technologies Co.) and scanning transmission electron microscopy (STEM, HD-2700, Hitachi High-Technologies Co.). The Pt (or PtOx)/TiC catalyst was also analyzed by X-ray
photoelectron spectroscopy (XPS, ESCA5800, ULVAC-PHI Inc.).
2-2-3. Electrochemical measurements
The ORR activities of the Pt/TiC and a c-Pt/CB (TEC10E50E, 45.6 wt.%-Pt supported on high-surface-area carbon black, Tanaka Kikinzoku Kogyo K.K.) catalysts were examined by the rotating disk electrode (RDE) technique. The working electrode consisted of a thin layer of these catalysts uniformly dispersed on a glassy carbon disk substrate (diameter = 5 mm, geometric area = 0.196 cm2) at a constant loading of 5.50 μg(Pt) cm–2, which corresponds to an approximately 2.5-monolayer height of TiC
support particles. A thin film of Nafion was coated on the catalyst layer with an average thickness of 0.05 μm.22
A platinum wire and a RHE were used as the counter and the reference electrodes, respectively. The electrolyte solution of 0.1 M HClO4 was prepared from
reagent-grade chemicals (Kanto Chemical Co.) and Milli-Q water. All of the electrode potentials were controlled by a potentiostat (HZ5000, Hokuto Denko Co.). The
-18-
electrolyte solution was saturated with N2 or O2 gas bubbling for at least 1 h prior to
the electrochemical measurements.
The durability testing of the catalysts was performed according to a standard potential step protocol recommended by the Fuel Cell Commercialization Conference of Japan (FCCJ) in 0.1 M HClO4 solution purged with N2 at 25oC. The
potential was stepped between 0.9 V and 1.3 V, with a holding period of 30 s at each potential (1 min per cycle).23 After a given number of potential step cycles, changes in the ECA values and ORR activities were examined.
-19-
2-3. Results and Discussion
2-3-1. Characterization of Pt/TiC catalysts
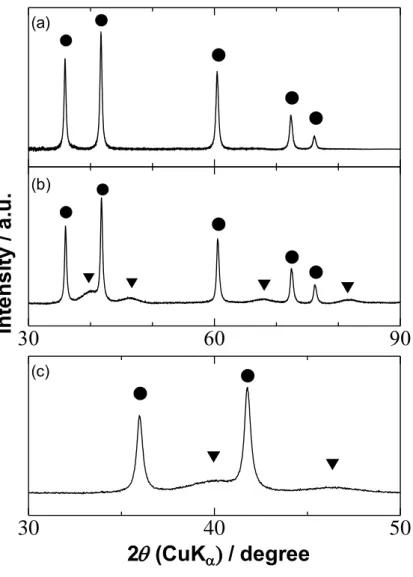
Figure 2-2 shows XRD patterns of various Pt/TiC catalysts. The sharp peaks at 2θ = 36 ° and 42 ° for both samples were assigned to cubic TiC (111) and TiC (200), respectively. The broad peaks at 2θ = 40 ° and 46 ° for the catalysts heat-treated at 600°C were assigned to Pt (111) and Pt (200), respectively. The Pt crystallite size
dXRD, calculated from Scherrer’s equation for the XRD peak at ca. 46 °, was 3.8 nm for
the Pt/TiC-600 °C. However, no such peaks were observed for the as-prepared Pt/TiC catalyst, suggesting that the supported particles were not metallic platinum.
The XP spectra of as-prepared Pt/TiC and Pt/TiC-600 °C are shown in Fig. 2-3. The formation of Pt(II) oxide (PtO) was confirmed for the as-prepared Pt/TiC catalyst from the Pt 4f core-level region in Fig. 2-3 (a). After the heat treatment at 600°C in N2 containing 1 % H2, the peak of metallic Pt (Pt0) appeared, with significant
diminishing of the PtO peak, which is consistent with the XRD results described above. In Fig. 2-3 (b), I observed a broad peak assigned to Ti4+, presumably TiO2, besides the
main peak assigned to Ti3+ in the TiC phase. The heat treatment at 600 °C in N2
containing 1 % H2 resulted in a decrease of the Ti4+ peak with a low-energy shift. Such
-20-
Figure 2-2. X-ray diffraction patterns for (a) Pt/TiC as-prepared and (b) (c) heat-treated at 600 ºC (Pt/TiC-600 ºC). The panel (c) is the enlarged XRD pattern from 30 to 50° for Pt/TiC-600 ºC. The assignment of peaks is shown by (●) cubic TiC and (▼) Pt.
Int
e
n
s
it
y
/
a
.u
.
● ● ▼ ▼
2 (CuK
/ degree
● ● (b) (a) ▼ ● ● ● ● ● ● ● ● ▼ ▼ (c) ▼30
60
90
30
40
50
-21-
Figure 2-3. XPS of as-prepared Pt/TiC and Pt/TiC-600 °C in the binding energy region of (a) Pt 4f7/2 and (b) Ti 2p3/2.
68
69
70
71
72
73
74
N
o
rma
liz
e
d
in
te
n
s
it
y
/
a
.u
.
Binding energy / eV vs. E
Pt
2+Pt
0(a)
F F452
454
456
458
460
Binding energy / eV vs. E
N
o
rma
liz
e
d
in
te
s
n
it
y
/
a
.u
.
Ti
4+Ti
3+(b)
Pt/TiC-600 °C Pt/TiC-600 °Cas-prepared Pt/TiC as-prepared Pt/TiC
68
69
70
71
72
73
74
N
o
rma
liz
e
d
in
te
n
s
it
y
/
a
.u
.
Binding energy / eV vs. E
Pt
2+Pt
0(a)
F F452
454
456
458
460
Binding energy / eV vs. E
N
o
rma
liz
e
d
in
te
s
n
it
y
/
a
.u
.
Ti
4+Ti
3+(b)
Pt/TiC-600 °C Pt/TiC-600 °C-22-
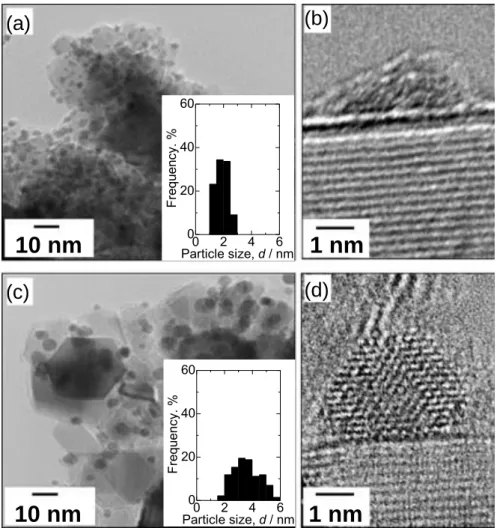
Figure 2-4 shows TEM images of as-prepared Pt/TiC and Pt/TiC-600 °C, together with the particle size distribution histograms. PtO or Pt particles were well dispersed on the TiC support for both samples. The average Pt particle size dTEM of
as-prepared Pt/TiC and Pt/TiC-600 °C were 1.9 ± 0.4 nm and 3.7 ± 1.0 nm, respectively. It was seen in a typical high resolution image (Fig. 2-4 (b)) for the as-prepared Pt/TiC that a dome-shaped particle (presumably PtO) was covered with a thin amorphous layer. After the reduction at 600 °C (Pt/TiC-600 °C, Fig. 2-4 (d)), clear fringes corresponding to the (111) lattice distance of Pt (0.224 nm) were observed, without any thin amorphous layer.
Considering the XPS results shown in Fig. 2-3, the thin amorphous layer observed in Fig. 2-4 (d) can be assigned with certainty to TiO2, which was reduced at
600 °C in 1% H2. The dTEM of Pt on Pt/TiC-600°C accords well with the crystallite
sizes dXRD, i.e., each Pt particle observed by TEM was a single crystallite. Thus, I
clarified that Pt nanocrystals were formed on the TiC support by the reduction of TiO2-covered PtO particles, followed by agglomeration. It is also noted that most of Pt
nanocrystals dispersed on the TiC support were hemispherical as seen in Fig. 2-4 (d), suggesting a strong interaction between Pt and the support.
-23-
Figure 2-4. TEM images of as-prepared Pt/TiC (a) (b) and Pt/TiC-600 °C (c) (d), together with the Pt particle size distribution histograms.
10 nm
1 nm
(a)
(b)
(d)
(c)
1 nm
10 nm
0 2 4 6 0 20 40 60 Particle size, d / nm F re qu en cy . % 0 2 4 6 0 20 40 60 Particle size, d / nm F re qu en cy . %-24-
2-3-2. Electrochemical characterization of Pt/TiC catalysts
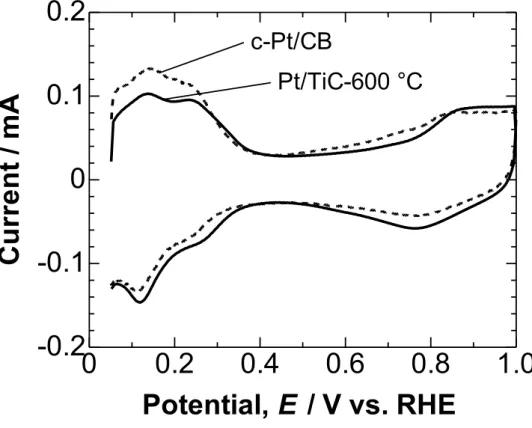
Figure 2-5 shows the cyclic voltammograms (CVs) of the Nafion-coated Pt/TiC-600 °C and c-Pt/CB electrodes in N2-purged 0.1 M HClO4 solution measured at
25 °C. For both electrodes, the hydrogen adsorption/desorption peaks were clearly observed at potentials below 0.4 V. The oxidation of Pt commenced at approximately 0.8 V in the positive-going scan, while the reduction peak was seen at 0.75 V in the negative-going scan. The ECA values of Pt/TiC-600 °C and c-Pt/CB, which were evaluated from the hydrogen adsorption charge in Fig. 2-5, were 75 m2 g
(Pt)−1 and 80
m2 g
(Pt)−1,21 respectively. Assuming a spherical shape for the Pt particles with dTEM, the
specific surface area was calculated to be 76 m2 g(Pt)−1 for Pt/TiC-600 °C and 127 m2
g(Pt)−1 for c-Pt/CB. This suggests that nearly all Pt particles for the Pt/TiC-600 °C
catalyst can easily contact the electrolyte solution, whereas an appreciable fraction of the Pt particles in the c-Pt/CB catalyst cannot contact the electrolyte solution. It has been reported that nearly half of the Pt particles for c-Pt/CB were located in the interiors of carbon black particle.24
-25-
Figure 2-5. Cyclic voltammograms for Pt/TiC-600 °C and c-Pt/CB in N2-saturated 0.1
M HClO4 at a sweep rate of 0.1 V s−1.
0
0.2
0.4
0.6
0.8
1.0
-0.2
-0.1
0
0.1
0.2
C
u
rr
e
n
t
/ mA
Potential, / V vs. RHE
c-Pt/CB
Pt/TiC-600 °C
E
-26-
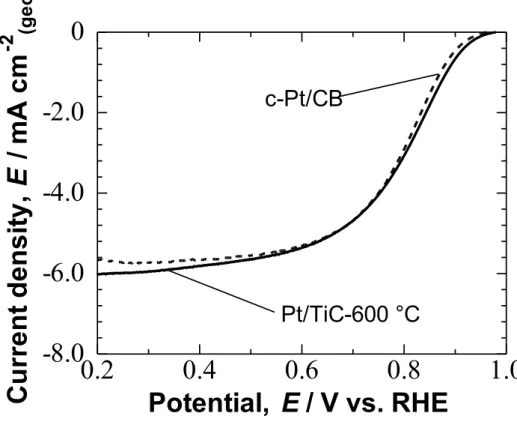
The ORR was examined by the RDE technique in O2-saturated 0.1 M
HClO4 solution at 25 °C. Hydrodynamic voltammograms for the ORR at
Pt/TiC-600 °C and c-Pt/CB electrodes are shown in Fig. 2-6. Both Pt/TiC-600 °C and c-Pt/CB electrodes exhibited nearly identical onset potential (0.98 V) for the ORR. The ORR current reached a diffusion limit at about 0.4 V. Then, the limiting current-corrected current, ILCC = I × IL / (IL − I), was calculated at 1500 rpm. According
to the Koutecky−Levich equation, ILCC is equivalent to the kinetically-controlled
current Ik.
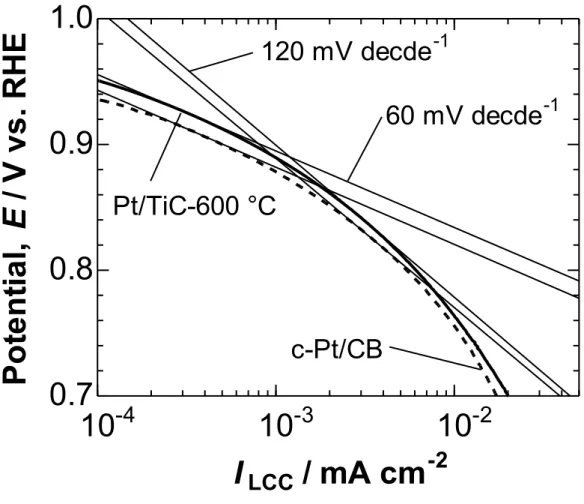
Figure 2-7 shows Tafel plots (E vs. log |ILCC|) for the ORR at
Pt/TiC-600 °C and c-Pt/CB. The Pt/TiC-600 °C showed two Tafel slope regions, similar to the case of c-Pt/CB: ca. −60 mV decade−1 in the high potential region E > 0.9 V, and ca.−120 mV decade−1
in the low potential region E< 0.85 V, being in agreement with those reported for bulk-Pt or Pt/CB.25 Therefore, the rate determining step for the ORR at Pt/TiC-600 °C is identical with that at Pt/CB or bulk-Pt.
-27-
Figure 2-6. Hydrodynamic voltammograms for the ORR at Nafion-coated Pt/TiC-600 °C and c-Pt/CB in O2-saturated 0.1 M HClO4 solution at 25 °C. Rotating
rate was 1500 rpm, and the potential sweep rate was 5 mV s-1.
0.2
0.4
0.6
0.8
1.0
-8.0
-6.0
-4.0
-2.0
0
Cu
rr
e
n
t
d
e
n
s
it
y
,
/ m
A
c
m
-2 (ge o )Potential, / V vs. RHE
c-Pt/CB
Pt/TiC-600 °C
E
E
-28-
Figure 2-7. Tafel plots for the ORR at Pt/TiC-600 °C and c-Pt/CB in O2-saturated 0.1
M HClO4 solution at 25°C with the rotating rate of 1500 rpm and the potential sweep
rate of 5 mV s-1.
10
-4
10
-3
10
-2
0.7
0.8
0.9
1.0
P
o
te
n
ti
a
l,
/
V
v
s
. R
H
E
LCC
/ mA cm
-2
120 mV decde
-160 mV decde
-1Pt/TiC-600 °C
c-Pt/CB
I
E
-29-
The kinetically-controlled currents Ik at given potentials E were determined
based on the Koutecky–Levich equation,
1/I = 1/Ik + 1 / (0.62nFSD2/3COν-1/6ω1/2)
where n is the number of electrons transferred, F is the Faraday constant, S is the effective projected area of the Pt catalyst, D is the diffusion coefficient of O2, CO is the
oxygen concentration, ν is the viscosity of the electrolyte and ω is the angular velocity. An example of the Koutecky–Levich plot for the ORR on the Nafion-coated Pt/TiC-600 °C is shown in Fig. 2-8. Linear relationships with a constant slope are seen at all of the potentials, 0.85, 0.80 and 0.76 V. By extrapolating ω−1/2 to 0 (infinite mass transport rate), the value of the kinetically controlled current Ik was calculated. The
kinetically-controlled specific activity (jk) and mass activity (MA) were calculated
based on the ECA value and the amount of Pt initially loaded on the working electrode, respectively. The value of jk of Pt/TiC-600 °C at 0.85 V was 0.70 mA cm-2, which was
approximately 1.4 times higher than that of c-Pt/CB. Similar enhancement factors of the jk were also reported for Pt/Nb-SnO2−δ and Pt/Ta-SnO2−δ. The value of MA of
Pt/TiC-600 °C at 0.85 V (507 A g−1) was, however, comparable to that of c-Pt/CB (527 A g−1), since the ECA of Pt/TiC-600 °C was smaller than that of c-Pt/CB.
-30-
Figure 2-8. Koutecky–Levich plots obtained from hydrodynamic voltammograms for
the ORR at (▲ -coated
Pt/TiC-600 °C electrode in O2-saturated 0.1 M HClO4 solution at 25 ºC.
0
0.02
0.04
0.06
0.08
0.10
-8.0
-6.0
-4.0
-2.0
0
-1/2/ (rad s
-1)
-1/2-1
/
m
A
-1
1000 rpm 2750 rpm
I
0.2 0.4 0.6 0.8 1.0 -1.5 -1.0 -0.5 0 Potential, / V vs. RHE C u rr e n t / m A E-31-
So far, the MA or jk at 0.90 V has been evaluated in both RDE cells using
0.1 M HClO4 electrolyte solution and conventional membrane-electrode assemblies
(MEAs), e.g., with 0.40 mg(Pt) cm–2 loading operated with air of 150 kPaabsolute
humidified at 100% RH.26 In contrast, the current density at 0.90 V is not completely kinetically-controlled in recent MEAs with less Pt loading of 0.04 mg(Pt) cm–2 and a
thin electrolyte membrane operated under ambient pressure at low humidity (30% RH). I have therefore judged that the MA measured at 0.85 V is more appropriate,27,28
considering the actual operating conditions of PEFCs.27 However, in order to compare
the ORR activity of our Pt/TiC-600 °C with values in the literature, I have also evaluated the activity at 0.90 V to be 0.17 mA cm-2. Recently, Ignaszak et al. prepared a Pt/TiC catalyst with similar Pt size dTEM = 3.1 nm by a microwave-assisted polyol
process.28 They reported a jk value at 0.90 V of 0.024 mA cm-2, which is only 1/7 of
our value. It is also noted that the value of ECA reported was 40 m2 g(Pt)−1, which is
approximately 1/2 that of our catalyst (76 m2 g(Pt)−1). The most important difference, I
consider, is that Ignaszak et al. did not carry out any heat treatment after dispersing the Pt on TiC. As described above, the heat treatment in H2-containing atmosphere was
found to be essential to remove the thin amorphous TiO2 layer from the Pt surface.
Because the current density during the ORR is higher than that of the CV (hydrogen adsorption/desorption), it is reasonable that the effect of the oxide layer on Pt and/or the Pt–TiC interface would be more pronounced for the jk values for the ORR than it would be for the ECA values.
-32-
2-3-3. Durability of Pt/TiC-600 °C in the potential step cycle test
Then, I have examined the durability of the Pt/TiC catalyst at high potentials. Figure 2-9 (a) shows the changes in the ECA values of the Nafion-coated Pt/TiC-600 °C and c-Pt/CB electrodes during the potential step cycle test, simulating the start-stop cycles of the FCV. The ECA values of c-Pt/CB decreased quickly after 100 cycles, whereas the ECA values of Pt/TiC-600 °C decreased slowly. As a measure of the durability, we defined N1/2, ECA, i.e., the value of N at which ECA had
decreased to 1/2 of the initial value of c-Pt/CB. It is clear that Pt/TiC-600 °C showed a much lower rate of ECA decrease; the N1/2, ECA value for Pt/TiC-600 °C was 12 times
larger than that for c-Pt/CB. Figure 2-9 (b) shows changes in the MA at 0.85 V (MA0.85V) for the ORR on the Nafion-coated Pt/TiC-600 °C and c-Pt/CB electrodes as a
function of log N. The Pt/TiC-600 °C exhibited a much lower rate of MA decrease than c-Pt/CB. The value of N at which MA had decreased to 1/2 of the initial value, N1/2, MA,
for Pt/TiC-600 °C was 11 times larger than that for c-Pt/CB. These results suggest that the decrease in the MA of Pt/TiC-600°C can be ascribed mainly to the decrease in ECA.
-33-
Figure 2-9. (a) Plots of ECA at Nafion- -600 -Pt/CB electrodes as a function of log [N]. (b) Plots of MA0.85V at
Nafion-Pt/TiC-600 -Pt/CB electrodes at 0.85 V as a function of log [N]. The dashed line were indicated N1/2.
1
10
10
210
310
410
510
610
70
20
40
60
80
100
E le ct roc he m ic al a ct iv e ar ea , E C A / m 2 g ( p t) -11
10
10
210
310
410
510
610
70
20
40
60
80
100
Number of potential step cycles,
(a)
N
M
ass
act
ivi
ty,
0. 85 V
/
A
g
(Pt) -1MA
(b)
1
10
10
210
310
410
510
610
70
200
400
600
800
Number of potential step cycles,
N
1
10
10
210
310
410
510
610
70
20
40
60
80
100
E le ct roc he m ic al a ct iv e ar ea , E C A / m 2 g ( p t) -11
10
10
210
310
410
510
610
70
20
40
60
80
100
Number of potential step cycles,
(a)
N
M
ass
act
ivi
ty,
0. 85 V
/
A
g
(Pt) -1MA
(b)
1
10
10
210
310
410
510
610
70
200
400
600
800
-34-
Figure 2-10 shows the TEM images of Pt/TiC-600 °C and c-Pt/CB before and after the durability test (N = 5000). As is well known, the CB support of c-Pt/CB corrodes severely at high potentials. Many Pt particles were found to be detached from the CB support, in addition to the agglomeration of Pt particles. It was found that Pt/TiC-600 °C exhibited high durability at high potentials, and Pt particles were not detached from the TiC support. The slow decrease of the ECA and MA values of Pt/TiC-600 °C can certainly be ascribed to an agglomeration of Pt particles. In contrast, Ignaszak et al. claimed that their Pt/TiC lost 78% of its original ORR activity after only 500 potential cycles between 0.05 V and 1.2 V at 20 mV s−1. Although the test protocol (upper limit and lower limit potential, potential sweep vs. potential step) was different, our Pt/TiC-600 °C catalyst exhibited superior durability, even with a higher potential being used, i.e., 1.3 V. Thus, I have confirmed that the removal of the TiO2 layer, as I
performed for Pt/TiC-600 °C, was very important to obtain both high ORR activity and high durability at high potentials.
-35-
Figure 2-10. TEM images of Pt/TiC-600 °C (a) (b) and c-Pt/CB (c) (d) before (a) (c) and after (b) (d) the durability test (N = 5000).
10 nm
(a)
(b)
(c)
(d)
10 nm
10 nm
-36-
2-4. Conclusions
I have succeeded in preparing Pt nanoparticles uniformly dispersed on a TiC support (Pt/TiC) by the colloidal method, followed by heat treatment in a hydrogen-containing atmosphere. Such a heat treatment was found to be important in removing a thin amorphous TiO2 layer from the Pt surface, resulting in hemispherical
Pt nanocrystals with clear lattice fringes. The heat-treated Pt/TiC at 600 °C (Pt/TiC-600 °C) exhibited high MA for the ORR in O2-saturated 0.1 M HClO4 solution
at 25°C, comparable to that of c-Pt/CB. It was also found that Pt/TiC-600 °C exhibited much higher durability than that of c-Pt/CB in a standard a potential step protocol (E = 0.9 V ↔1.3 V). By TEM observation, I have clearly demonstrated that the major reason for such a high durability of Pt/TiC-600 °C was suppression of the detachment of Pt particles from the support, unlike c-Pt/CB. Hence, based on our systematic work using various ceramic supports (TiN, doped SnO2, and TiC in the present work), the
essential factors for the highly active and highly durable cathode catalyst are the use of a chemically and electro chemically stable support with high electrical conductivity, uniform dispersion of Pt nanocrystals on the support, and the removal of an oxide layer, if any, on the Pt surface and/or Pt–ceramic support interface.
-37-
2-5 Refarences
(1) Masao, A.; Noda, S.; Takasaki, F.; Ito, K.; Sasaki, K. Electrochem. Solid-State
Lett., 2009, 12, B119-B122.
(2) Takasaki, F.; Matsuie, S.; Takabatake, Y.; Noda, Z.; Hayashi, A.; Shiratori, Y.; Ito, K.; Sasaki, K. J. Electrochem. Soc., 2011, 158, B1270-B1275.
(3) Mentus, S. V. Electrochim. Acta, 2007, 50, 27-32.
(4) Ioroi, T.; Akita, T.; Yamazaki, S.; Siroma, Z.; Fujiwara, N.; Yasuda, K. J.
Electrochem. Soc., 2011, 158, C329-C334.
(5) Huang, S. Y.; Ganesan, P.; Park, S.; Popov, B. N. J. Am. Chem. Soc., 2009, 131, 13898-13899.
(6) Huang, S. Y.; Ganesan, P.; Park, S.; Popov, B. N. Appl. Catal. B, 2011, 102, 71-77. (7) Ioroi, T.; Senoh, H.; Yamazaki, S.; Siroma, Z.; Fujiwara, N.; Yasuda, K. J.
Electrochem. Soc., 2008, 155, B321-B326.
(8) Ioroi, T.; Siroma, Z.; Fujiwara, N.; Yamazaki, S.; Yasuda, K. Electrochem.
Commun., 2005, 7, 183-188.
(9) Kakinuma, K.; Wakasugi, Y.; Uchida, M.; Kamino, T.; Uchida, H.; Deki, S.; Watanabe, M. Electrochim. Acta, 2012, 77, 279-284.
(10) Kakinuma, K.; Uchida, M.; Kamino, T.; Uchida, H.; Watanabe, M. Electrochim.
Acta, 2011, 56, 2881-2887.
(11) Kakinuma, K.; Chino, Y.; Senoo, Y.; Uchida, M.; Kamino, T.; Uchida, H.; Deki, S.; Watanabe, M. Electrochim. Acta, 2013, 110, 316-324.
-38-
Adv., 2014, 4, 32180-32188.
(13) Senoo, Y.; Taniguchi, K.; Kakinuma, K.; Uchida, M.; Uchida, H.; Deki, S.; Watanabe, M. Electrochem. Commun., 2015, 51, 37-40.
(14) Oyama, S. T. The Chemistry of Transition Metal Carbides and Nitrides; Blackie Academic and Professional: London, UK, 1996; Chapter 1, pp. 9-14.
(15) Nakao, S.; Yamada, N.; Hitosugi, T.; Hirose, Y.; Shimada, T.; Hasegawa, T. Appl.
Phys. Express. 2010, 3, 031102.
(16) La Conti, A. B.; Griffith, A. E.; Cropley, C. C.; Kosek, J. A. US Patent, 2000, July
4, 6,083,641.
(17) Jalan, V.; Frost, D. G. Fuel Cell Electrocatalyst Support Comprising an Ultra-Fine Chainy-Structured Titanium Carbide. US Patent, 1989, January 3, 4,795,684. (18) Ma, L.; Sui, S.; Zhai, Y. J. Power Sources 2008, 177, 470-477.
(19) Watanabe, M.; Uchida, M.; Motoo, S. J. Electroanal. Chem., 1986, 199, 311-322. (20) Watanabe, M.; Uchida, M.; Motoo, S. J. Electroanal. Chem., 1987, 229, 395-406. (21) Yano, H.; Akiyama, T.; Bele, P.; Uchida, H.; Watanabe, M. Phys. Chem. Chem.
Phys., 2010, 12, 3806-3814.
(22) Iiyama, A.; Shinohara, K.; Iguchi, S.; Daimaru, A. in: Vielstich, W.; Lamm, A.; Gasteiger, H. A. (Eds.), Handbook of Fuel Cells: Fundamentals, Technology and Applications; John Wiley & Sons Ltd.: Hoboken, NJ, USA, 2009, vol. 6, Chapter 61.
(23) 40. Uchida, M.; Park, Y-C.; Kakinuma, K.; Yano, H.; Tryk, A. D.; Kamino, T.; Uchida, H.; Watanabe, M. Phys. Chem. Chem. Phys., 2013, 5, 11236-11247.
-39-
(24) 41. Markovic, N.; Adzic, R.; Cahan, B.; Yeager, E. J. Electroanal. Chem., 1994,
377, 249-259.
(25) Gasteiger, H. A.; Kocha, S. S.; Sompalli, B.; Wagner, F. T. Appl. Catal. B: Environ., 2005, 56, 9-35.
(26) Lee, M.; Uchida, M.; Tryk, D. A.; Uchida, H.; Watanabe, M. Electrochim. Acta.
2011, 56, 4783-4790.
(27) Okaya, K.; Yano, H.; Kakinuma, K.; Watanabe, M.; Uchida, H. ACS Appl. Mater. Interfaces, 2012, 4, 6982-6991.
-40-
Chapter 3
Oxygen Reduction Reaction Activity of
Carbon-Supported Pt-M (M = Fe, Co, and Ni) Alloys
with Stabilized Pt-Skin Layers
3-1. Introduction
In the Chapter 2, it was found that Pt/TiC exhibited much higher durability at high potential than that of commercial Pt/CB (c-Pt/CB) at high potentials. The MA of Pt/TiC-600 °C at 0.85 V was comparable to that of c-Pt/CB. Therefore, the MA for the ORR should be increased (higher than Pt) with keeping high durability. I have chosen Pt-M (M = Fe, Co, and Ni) alloy nanoparticles as the candidates with MA several times higher than that of c-Pt/CB. However, before supporting them on the stable support such as TiC, two important subjects must be solved. The first is the suppression of dealloying of conventional Pt-M in strong acidic media at practical temperatures. The second is the increase in the durability for potential changes of load-cycles (typically between 0.6 V and 1.0 V). For such purposes, I have chosen carbon material as the support. The use of Pt alloyed with nonprecious metals such as Cr, Fe, Co, Ni, Cu, etc. has been recognized to be very effective in increasing js.1-4 By
using multiple types of analyses,3,5 Watanabe and co-workers clearly demonstrated that nonprecious metal elements in Pt-M (M = Fe, Co, Ni) solid solutions were leached out in an acidic electrolyte, but a Pt-skin layer was spontaneously formed on the alloy surface. The Pt-skin layer protected the underlying alloy from corrosion, and its electronic state modified by the alloy induced the enhanced js values (show in Fig.3-1).
-41-
Fig.3-1 Composition dependence of the specific activity jk of the alloy for oxygen
-42-
In spite of considerable R & D on Pt alloy nanocatalysts, the optimum chemical composition and particle size, having both high MA and high durability, are still unclear. One of the major reasons is that the conventional preparation methods6-8 of such alloy nanoparticles have provided inhomogeneous composition with a broad size distribution, resulting in the formation of non-uniform Pt-skin layers. We have developed the nanocapsule method to prepare monodisperse Pt alloy nanoparticles uniformly dispersed on carbon supports with well-controlled composition.9-11 For example, the kinetically-controlled mass activity MAk of a carbon-supported Pt3Co
(atomic ratio) catalyst at 30 to 70°C was found to be 3.3 time higher than that of commercial carbon-supported Pt catalyst (c-Pt/C).11 However, the durability of our Pt3Co/C catalyst was insufficient, since the dealloying of Co was not fully suppressed
at high temperatures > 80°C, with the catalyst gradually becoming deactivated so that the MAk value was finally comparable to that of c-Pt/C. Besides the degradation of the
catalytic activity, the accompanying dissolution of nonprecious metal components must be avoided, because protons in the polymer electrolyte membrane and the electrolyte binder (ionomer) in the CL could be easily exchanged with the metal cations, inducing two types of serious damage as follows. First, the contamination by the metal cations leads to decreases in the proton conductivity, oxygen solubility, and oxygen diffusion rate, resulting in a decreased ORR rate.12 Second, some metal cations (specifically,
Fe2+ and Cu2+) accelerate the formation of OH radicals from H2O2, which can degrade
the polymer electrolyte and the gasket material; 12, 13 H2O2 is generated both via the
-43-
crossover O2 (though the membrane) with H2 adsorbed at the anode. To mitigate the
latter damage, the H2O2 yield (the percentage of H2O2 production rate with respect to
that of the overall ORR) of the catalyst should be as low as possible. By using a stepwise nanocapsule method, Okaya et al. in our group have succeeded in preparing a thin, stable Pt-skin layer on Pt-Co alloy nanoparticles, which were dispersed on graphitized carbon black (GCB).14 The average thickness of the stabilized Pt-skin corresponded to two atomic layers, but a small fraction (ca. 4 vol.%) of pure Pt nanoparticles (ca. 1.5 nm) was also deposited on the GCB. The dealloying of Co was found to be suppressed, with high values of MA being maintained even at 90°C. This catalyst also exhibited much lower H2O2 yield than that of c-Pt/C at all temperatures
examined. Very recently, a facile preparation method of the stabilized Pt-skin layers on supported nanocatalysts has been developed in our group.15 It was found that PtCo alloy with two atomic Pt-skin layers, Pt2AL−PtCo/GCB thus prepared exhibited
superior performances both in the MA and the durability versus potential changes (simulating load-changes and start-stop cycles of FCVs), compared with those of conventional ones.16 Thus, I attempted to prepare Pt-M/C with stabilized Pt-skin layers. I also estimated effect of stabilized Pt-skin layers for ORR activity and durability.
In this chapter, I have examined the kinetically-controlled mass activity MA and H2O2 yield of Pt2AL−Pt-M/C (M = Fe, Co, and Ni) in O2-saturated 0.1 M HClO4
solution at 65 °C for the first time by the use of the multi-channel flow double electrode method.16 To clarify the effect of the nonprecious metal species M on the properties, Pt-M nanoparticles with uniform size were dispersed on high-surface area
-44-
carbon black, followed by the formation of Pt2AL. It was found that the initial value of
MA at 0.85 V vs. RHE and 65 °C increased in the order, c-Pt/C << Pt2AL−PtCo/C <
Pt2AL−PtFe/C < Pt2AL−PtNi/C, while the Pt2AL−PtCo/C catalyst exhibited superior
-45-
3-2. Experimental
3-2-1. Preparation of Pt2AL−Pt-M/C Catalysts
The preparation protocol of Pt2AL−Pt-M/C (M = Fe, Co, Ni) was similar to
that of Pt2AL−PtCo/GCB,15, 16 except that high-surface area carbon black (specific
surface area = ca. 780 m2 g−1) was used as the support in place of GCB (specific surface area = 150 m2 g−1). Here, I briefly explain the protocol. Metal acetylacetonates, Pt(acac)2, Fe(acac)3, Co(acac)3, and Ni(acac)2 were used as the precursors of the Pt-M
alloys. First, Pt-M alloy (1:1 atomic ratio) nanoparticles were highly dispersed on the support (denoted as Pt-M/C) by the nanocapsule method.11 The projected total metal
loading was 30 wt% for all samples. The Pt-M/C was heat-treated in 5% H2 (N2
balance) to segregate the Pt atoms on the surface.17 It was confirmed in our previous work16 that nearly one atomic layer of Pt-skin (Pt1AL) was formed on the surface of the
Pt-Co alloy as a result of this treatment. The catalyst thus prepared will be denoted as Pt1AL−Pt-M/C. Then, one more atomic layer of Pt-skin was formed on Pt1AL−Pt-M/C
via controlled Pt deposition from a Pt-complex-containing aqueous solution with 5% H2 bubbling at 60 °C for > 1 h (until Pt-complex was reduced thoroughly), where the
amount of Pt-complex required was calculated based on the average particle size of Pt1AL−Pt-M/C determined among ca. 300 particles by TEM (Hitachi H-9500, operated
at 200 kV). After being filtered and washed with pure water, the catalyst powder was vacuum-dried. Finally, to stabilize the Pt-skin layer, the catalyst thus prepared was briefly heat-treated in 5% H2 at 200 °C. The catalysts thus prepared will be denoted as
-46-
3-2-2. Characterization and Electrochemical Measurement of Pt2AL−Pt-M/C
The Pt1AL−Pt-M/C and Pt2AL−Pt-M/C catalyst powders thus prepared were
characterized by X-ray diffraction (XRD, Rigaku Ultima IV) with CuKα radiation (40 kV, 40 mA) and TEM. The loaded amounts of the metal catalysts on the carbon support were quantified from the weight loss by combustion of the carbon, heating to 600°C in air with the use of thermogravimetry (TG). The average compositions were quantitatively analyzed by an inductively coupled plasma mass analyzer (ICP-MS, Agillent Technologies Inc. 7500CX) after dissolving in hot aqua regia the ash remaining after the TG.
3-2-3. Electrochemical Measurement of Pt2AL−Pt-M/C
The kinetically-controlled ORR activities (jk or MA) and H2O2 yield,
P(H2O2), on three kinds of new catalysts [Pt2AL−Pt-M/C (M = Fe, Co, Ni)] were
evaluated under identical reaction conditions (temperature, electrolyte solution, and O2
concentration) simultaneously by the multi-channel flow double electrode (M-CFDE) technique.11 The working electrode was Nafion®-coated Pt2AL−Pt-M/C uniformly
dispersed on an Au substrate (geometric area 0.04 cm2), which was prepared in the similar manner as that described in our previous work.11, 18 The amount of each catalyst was maintained at a constant loading of carbon support at 15 μgcarbon cm−2
(corresponding to an approximately three-layer height of carbon particles18), and the average thickness of Nafion® was 0.1 μm. The ORR activities of the commercial Pt catalyst supported on carbon black (TEC10E50E, 50 wt%-Pt, specific surface area of
-47-
the carbon support = ca. 800 m2 g–1, Tanaka Kikinzoku Kogyo, which has been chosen as the standard catalyst19) were measured separately with 5.5 μgcarbon cm−2 (ca.
monolayer height), because the dispersion state of this catalyst on the Au substrate was found to be more uniform, thus providing the intrinsic activity as described later.11, 18 The reference electrode used was a reversible hydrogen electrode (RHE).
First, all working electrodes were electrochemically stabilized by potential cycling between 0.06 and 1.00 V at 0.5 V s−1 in N2-purged 0.1 M HClO4 solution until
a steady-state cyclic voltammogram (CV) was obtained. The value of ECA of each catalyst was determined from the electrical charge for the hydrogen adsorption wave in the CV measured at 0.1 V s−1, referred to ∆QHo = 210 μC cm−2 for bulk polycrystalline
Pt.20 Then, hydrodynamic voltammograms were recorded by scanning the potential from 0.3 to 1.0 V at 0.5 mV s−1 in O2-saturated 0.1 M HClO4 solution at 65 °C. In
order to detect H2O2 generated at the working electrode, the potential of the collecting
electrode was set at 1.2 V. The collection efficiency (N) for the collecting electrode in the present M-CFDE was experimentally determined to be 0.28 ± 0.01.
-48-
3-3. Results and discussion
3-3-1. Characterization of Pt2AL−Pt-M/C catalysts
Typical properties of synthesized Pt1AL−Pt-M/C and Pt2AL−Pt-M/C are
summarized in Table 3-1. The average composition of each Pt1AL−Pt-M/C analyzed by
ICP-MS (Pt atom% = 49.8% for Pt-Co, 50.8% for Pt-Ni, and 56.3% for Pt-Fe) was closed to that planned for the preparation of Pt-M alloy (50.0 atom%-Pt). Figure 3-2 shows X-ray diffraction patterns of the Pt1AL−Pt-M/C, Pt2AL−Pt-M/C, and c-Pt/C
catalysts. All of the diffraction peaks for c-Pt/C, as expected, were assigned to the face-centered cubic (fcc) phase of pure Pt. For neither Pt1AL−Pt-M/C nor Pt2AL−Pt-M/C,
extra peaks due to metallic M or their oxides were detected. The diffraction peaks for all of the Pt1AL−Pt-M/C samples clearly shifted to higher angles than those of pure Pt,
indicating fcc alloy formation. In contrast, the diffraction peaks for the Pt2AL−Pt-M/C
catalysts were observed at positions between those for the corresponding Pt1AL−Pt-M/C
and pure Pt. Such shifts of diffraction peaks are consistent with those reported previously.14, 16 The crystallite sizes dXRD of the Pt1AL−Pt-M/C were calculated to be 2.2
to 2.3 nm by use of the Scherrer’s equation (see Table 3-1). It is noteworthy that the
dXRD value for each Pt2AL−Pt-M/C was larger by 0.3 to 0.5 nm than that of the
-49-
Table 2-1. Typical properties of synthesized Pt1AL−Pt-M/C, Pt2AL−Pt-M/C, and c-Pt/C
(reference catalyst).
M Pt-skina metal loadedb compositionc (wt%) (Pt atom%) dXRDd (nm) dTEM e (nm) Fe Pt1AL 22.0 56.3 2.2 2.4 ± 0.3 Pt2AL 31.5 [32.3]f 73.1 [70.4]g 2.6 2.9 ± 0.4 Co Pt1AL 24.4 49.8 2.3 2.8 ± 0.5 Pt2AL 32.7 [34.0]f 67.2 [63.6]g 2.8 3.3 ± 0.5 Ni Pt1AL 27.6 50.8 2.2 2.8 ± 0.3 Pt2AL 40.8 [37.6]f 71.0 [64.3]g 2.5 3.2 ± 0.4 c-Pt/C 46.7 - 2.1 2.2 ± 0.5
a Number of Pt-skin layers formed on Pt-M alloy surface. b Metal weight percent
estimated by weight loss using TG. The projected metal loading for each Pt1AL−Pt-M/C
(namely Pt-M/C) catalyst was 30 wt%. c Average composition analyzed by ICP-MS
after dissolving in hot aqua regia the ash remaining after the TG. The projected alloy composition of Pt-M was 50.0 atom%-Pt. d Crystallite size calculated from the Sherrer’s equation for the peak assigned to (220) diffraction at 2θ ≈ 67°. eAverage particle size and standard deviation based on TEM observation. f Projected metal loading for preparing the Pt2AL−Pt-M/C catalysts. g Projected average composition
-50-
Figure 3-2. X-ray diffraction patterns for Pt2AL−PtFe/C, Pt1AL−PtFe/C, Pt2AL−PtCo/C,
Pt1AL−PtCo/C, Pt2AL−PtNi/C, Pt1AL−PtNi/C, and c-Pt/C. Dashed lines indicate 2θ peaks
assigned to (111), (200), (220), and (311) planes (from low diffraction angle to high angle) of fcc Pt .
30
40
50
60
70
80
90
2
/degree
In
te
ns
ity, a
.u
.
Pt2AL−PtFe/C Pt1AL−PtFe/C Pt2AL−PtCo/C Pt1AL−PtCo/C Pt2AL−PtNi/C Pt1AL−PtNi/C c-Pt/C-51-
Such increases in the particle sizes by the controlled Pt-skin deposition were demonstrated more clearly by the TEM images. For both the Pt1AL−Pt-M/C and
Pt2AL−Pt-M/C in Fig. 3-3, the catalyst nanoparticles were uniformly dispersed on the
support. Based on the size distribution histogram among ca. 300 particles for each sample, the average particle size dTEM and the standard deviation σd of the
Pt1AL–PtFe/C, Pt1AL–PtCo/C, and Pt1AL–PtNi/C catalysts were 2.4 ± 0.3 nm, 2.8 ± 0.5
nm, and 2.8 ± 0.3 nm, respectively, i.e., fairly narrow particle size distributions, compared with that of c-Pt/C (σd > 20%). The size distribution histograms of all of the
Pt2AL−Pt-M/C were shifted to larger size with nearly perfect maintenance of the
distribution profile seen for the corresponding Pt1AL–Pt-M/C. As shown in Table 1, the
increment in the dTEM from Pt1AL−Pt-M to Pt2AL−Pt-M was 0.5 nm (M = Fe and Co)
and 0.4 nm (M = Ni) with little change in the σd. This indicates that one atomic layer
thickness of Pt-skin (ca. 0.5 nm21) was formed uniformly on every nanoparticle of Pt1AL–Pt-M. Changes in both the total metal loaded and the composition also supported
the formation of one additional Pt-skin layer on Pt1AL–Pt-M. Thus, from the analyses of
XRD, TG, ICP-MS, and TEM, we have confirmed the formation of Pt2AL–Pt-M/C, as
-52-
Figure 3-3. TEM images of (a) Pt1AL−PtFe/C, (A) Pt2AL−PtFe/C, (b) Pt1AL−PtCo/C,
(B) Pt2AL−PtCo/C, (c) Pt1AL−PtNi/C, and (C) Pt2AL−PtNi/C. The particle size
distribution histograms were obtained based on ca. 300 particles in several images; white bars, Pt1AL−PM/C; hatched bars, Pt2AL−PtM/C.
10 nm 10 nm 10 nm 10 nm 10 nm 10 nm 10 nm (a) (A) (B) (b) (C) (c) 0 1 2 3 4 5 6 0 20 40 60 80
Particle size, dTEM / nm
F re qu en cy, % 0 1 2 3 4 5 6 0 20 40 60 80
Particle size, dTEM / nm
F re qu en cy, % 0 1 2 3 4 5 6 0 20 40 60 80
Particle size, dTEM / nm
F re qu en cy, %
-53-
3-3-2. ORR activities and H2O2 yields of Pt2AL−Pt-M/C
Figure 3-4 shows the cyclic voltammograms (CVs) of Nafion-coated Pt2AL−Pt-M/C and c-Pt/C electrodes in N2-purged 0.1 M HClO4 solution measured at
65 °C. All of the CVs of the Pt2AL−Pt-M/C were very similar to that of c-Pt/C or
polycrystalline Pt. Based on the hydrogen adsorption charge in the CVs, the values of ECA of Pt2AL−Pt-M/C were calculated to be 100 m2 g−1 (M = Fe), 77 m2 g−1 (M = Co),
and 82 m2 g−1 (M = Ni), while that of c-Pt/C was 119 m2 g−1.
Figure 3-5 shows hydrodynamic voltammograms for the ORR at these working electrodes in O2-saturated 0.1 M HClO4 solution at 65 °C at a mean flow rate
Um of 4.6 cm s-1. The small anodic current densities jc (per unit geometric area)
observed at the Pt collecting electrodes are ascribed to the oxidation of H2O2. I will
discuss the H2O2 yield of the catalysts later. The ORR currents (jw) at the Pt2AL−Pt-M/C
working electrodes commenced to increase at more positive potentials and more steeply than that at the c-Pt/C electrode. At ca. 0.65 V, an identical limiting current density was observed irrespective of the kind of catalyst, whose value coincides well with the diffusion limit based on the concentration of dissolved oxygen and the Um.
Based on the hydrodynamic voltammograms obtained at Um = 4.6 to 14
cm−1, I evaluated the kinetically-controlled current Ik at a given potential.22, 23 By
extrapolating the plots of I−1 (inverse of the observed current) vs Um−1/3 to Um−1/3 = 0
(infinite mass transport rate), the value of the Ik was calculated. The
kinetically-controlled mass activity MA (Ik divided by the initially loaded mass of Pt,
-54-
The reason why I have evaluated MA or jk at 0.85 V (rather than the conventional 0.90
V) is that it is more appropriate considering recent PEFCs with low Pt loadings and thin electrolyte membranes, as discussed in detail previously.10 However, I have also evaluated the jk at 0.90 V for c-Pt/C, in order to compare it with values in the literature.
The jk value for the c-Pt/C at 0.90 V was 0.15 mA cm−2, which is the same value as that
reported for Pt/C with the similar ECA of 120 m2 g−1 measured at a scan rate of 5 mV s−1 in 0.1 M HClO4 solution at 60 oC.2 Thus, the c-Pt/C catalyst thin-layer employed
(5.5 μgcarbon cm−2) was confirmed to provide a reasonable reference activity for the


![Figure 2-9. (a) Plots of ECA at Nafion- -600 -Pt/CB electrodes as a function of log [N]](https://thumb-ap.123doks.com/thumbv2/123deta/7695180.1216904/37.892.207.693.132.918/figure-plots-eca-nafion-pt-cb-electrodes-function.webp)
