Using TOEIC Scores
to Evaluate Student Performance in English Language Courses
Brian D. Bresnihan
Abstract
This paper studies the TOEIC scores of about 1,200 students at a university in Japan and their use in determining those students’ final grades in their required English courses. After giving a brief description of the TOEIC and the history of its development, some of its producer’s claims concerning its worthiness and criticisms of these claims are considered. Next, the data used in this study is presented and compared with similar data from throughout Japan and from the initial studies of the TOEIC published by its producer. This is followed by comparisons between both average scores and individual scores of students who sat for two administrations of the TOEIC.
Finally, reasons why TOEIC scores ought not to be the sole criterion for evaluating student performance in English language courses in schools are discussed.
1. Background Information Concerning the TOEIC
Nowadays, it seems that everyone has heard of the TOEIC, or at least everyone involved both in education and with students in and from non-English speaking cultures who need to study English, as well as many people in non-English speaking countries involved both in business and with the need to engage in work with people from other countries. A decade ago, not many people would have known what this acronym stood for, and almost no one outside of Japan or South Korea would have ever heard of it. Today, the Test of English for International Communication is administered in many countries and is one of the most sat for standardized English language tests in the world, though about 80% of those tests are taken in Japan or South Korea.
1The perceived importance of this test in the field of English language testing is obvious as TOEIC scores are now included in conversion charts among various other standardized English test scores used in many countries.
2This is another recent development and attests to the prestige and power the TOEIC
1 This figure is a rounded estimate based on information from pages 3 and 7 of TOEIC Newsletter, No. 105 and page 1 of TOEIC Test Data & Analysis 2009.
2
Comparisons of TOEIC scores with other standardized test scores can be found in “The Cambridge, IELTS, TOEFL and TOEIC compared for equivalencies,” page 2 of “Can-Do Levels Table,” page 1 of “Can-Do Levels Table (2),” Taylor,
“TOEFL Equivalency Table,” and “TOEFL Equivalency Table (2).”
now holds in the world of English language testing. Although the government of South Korea is having its doubts about using the TOEIC any longer,
3TOEIC scores are increasingly being recognized by greater numbers of organizations and schools in many countries.
Briefly, the TOEIC was created, and is still produced and controlled, by one of the largest standardized testing organizations in the world, the Educational Testing Service (ETS), which is also responsible for the Test of English as a Foreign Language (TOEFL).
4The TOEFL was first administered in 1964. TOEFL scores are often used by schools of higher education in the United States to determine if non-native English speaking students have sufficient English abilities to be successful in their studies, research, and/or work at American universities.
5In 1977, a request to ETS for the creation of a different sort of English test was made by Japan’s Ministry of International Trade and Industry (MITI), now the Ministry of Economy, Trade, and Industry (METI), and the Japan Federation of Economic Organizations, now the Federal Business Federation, based on the ideas of Yasuo Kitaoka. The desire was for a test of English that would measure English abilities in business-related contexts, would distinguish differences in English abilities at fairly low levels, and would include a number of native English speaker’s dialects from various countries. ETS agreed to develop such a test and soon sent people to Japan to do exploratory research on the English requirements of non-native English speaking workers.
6This is what ETS reports concerning their findings:
“The studies were revealing. One important finding was that the language of non-native speakers clearly focuses on communication and is delivered with relatively few embellishments. For example, the least proficient person present out of necessity invariably determines the level of English used in meetings. Non-native English speakers use fewer idiomatic expressions. They employ technical terminology only when necessary.
Furthermore, they tend to use fewer complex grammatical structures, even
3
The dissatisfaction of the South Korean government with the TOEIC and how it may be replaced is discussed in Kang and Oh & Kang. Lee gives an earlier criticism of the use of the TOEIC and TOEFL in South Korea.
4
Details concerning ETS and its tests can be found in “Educational Testing Service,” “Tests & Products,” and “Who We Are.”
5
Information concerning the TOEFL can be found in “About the TOEFL Test,” “ETS Premieres World’s First Internet-Based English-Proficiency Test,” “Research and Design,” and “Test Content (TOEFL).”
6
More details about the initial negotiations prior to the creation of the TOEIC can be found in pages 14 to 16 of Bresnihan, page 8 of Chapman (2004), McCrostie (2009), page 2 of McCrostie (2010), page 6 and 18 of TOEIC Newsletter, No. 105, and page 2 of TOEIC User Guide: Listening & Reading.
though the more capable speakers in the studies were capable of speaking quite impressively.
The language specialists also noted that the business people seldom need to read very long narratives. Instead, the international business community receives much of its English-language exposure from letters, and memoranda, and other short texts.”
7Based on this research and the design of the TOEFL, ETS quickly created the TOEIC for the following stated purpose:
“The TOEIC test measures the everyday English skills of people
working in an international environment. Test scores indicate how well people can communicate in English with others in the global workplace.The test does not require specialized knowledge or vocabulary beyond that
of a person who uses English in everyday work activities.”8The phrases I have italicized in the above quotation indicate that the TOEIC is meant to measure the English abilities of adults whose work requires them to interact and communicate with others using English. It is clearly not intended for young people who have not yet entered the work force and do not have any work experience. To me, this indicates that it is inappropriate to use TOEIC scores as a major factor in, and certainly not the excusive means of, measuring the English language abilities of school-age children or even college and university students due to the differing contexts, settings, and experiences between workers in the international business world and students. This disadvantage will likely affect their scores in unpredictable ways due to factors not related to their English language proficiency.
The TOEIC was first administered in Japan in December of 1979 to a few thousand examinees. For some years, there were few test takers, and those responsible for the test in Japan were worried. However, two changes concerning the TOEIC occurred in the early 1980s that led to increases in the number of examinees sitting for the test.
97 This quotation is from page 2 of TOEIC User Guide: Listening & Reading.
8 This quotation is on page II-1 of TOEIC Technical Manual. Italics are added.
9 Details about the first few years of the TOEIC can be found in pages 17 to 20 of Bresnihan, McCrostie (2009), page 3 of McCrostie (2010), pages 2, 3, 6, and 7 of TOEIC Newsletter, No. 105, page 1 of TOEIC Test Data & Analysis 2009, and pages 5 and 6 of Woodford.
The TOEIC now has two versions, the TOEIC SP (Secure Program) Test and the TOEIC IP (Institutional Program) Test. The former is the original, and the latter was first administered in 1981.
10It is less expensive for test takers to take the latter than the former, and scores are reported more quickly for the latter than the former. Also, the TOEIC IP Test is administered at, by, and when any institution wishes and makes arrangements to do so rather than according to the fixed TOEIC SP Test locations and schedule determined by ETS and its promoters and handlers. The downside of the TOEIC IP Test is that it is not as secure and, as it is produced from already-used TOEIC SP Tests, and because those who take the institutional program tests have been preselected by the organizations, the schools or companies, they belong to in some way, its results are not as statistically robust as those from the TOEIC SP Test.
11The second change was that in January of 1982, the TOEIC was administered in South Korea for the first time.
12The result of these two changes was that within a few years, there were a great many Japanese and Koreans taking the TOEIC. Currently, the worldwide total is about 5,000,000 examinees per year, and the test is offered in about 90 countries, though, as mentioned earlier, about 80% of the tests are taken in Japan or South Korea. Cumulatively, the TOEIC has been sat for about 20,000,000 times since the test was first administered.
13The TOEIC taken by most people has two sections of multiple choice questions with most answers chosen from four possible choices, though one part provides only three possible choices to choose from. The first section of 100 questions measures the ability to understand recorded spoken English scripted as if taking place in a variety of business-related situations, including conversations, announcements, and speeches. The second section of 100 questions measures the ability to understand various types of written texts, such as letters, advertisements, and reports, also related to business in some way. All of the discourse is meant to mimic language used in circumstances that workers might find themselves facing at, related to, or as a result of their jobs.
The Listening section takes about 45 minutes, determined by the length of the recording. Test takers are given 75 minutes to complete the Reading section. In May of 2006, some changes were made to the TOEIC SP Test concerning the format of certain questions, and an increased number of
10 The first administration of the TOEIC IP Test is noted in pages 2, 3, and 7 of TOEIC Newsletter, No. 105 and page 1 of TOEIC Test Data & Analysis 2009.
11 Explanations of the differences between the TOEIC SP and IP Tests can be found in page 8 of Chapman (2004),
“Differences between SP group application and IP,” and “Group Application.”
12 This date is given in pages 2 and 7 of TOEIC Newsletter, No. 105.
13 Increases in and numbers of test takers can be found in pages 2, 3, 6, 7, 8, 18, and 19 of TOEIC Newsletter, No. 105 and page 1 of TOEIC Test Data & Analysis 2009.
dialects of native-language English began to be used in the Listening section. These changes were implemented in the TOEIC IP Test in April of 2007. The details mentioned so far, however, remained the same. What follows includes these changes.
The Listening section has four parts and consists of a recording plus some of the questions and possible answers written in the test booklet. Part 1 contains ten questions. Each question consists of one printed photograph and four one-sentence descriptive oral statements, from which the description that best fits the photograph is to be chosen. Part 2 has 30 questions, each of which is made up of one oral statement or question followed by three oral responses. The response that would be best to use following the initial statement or question is to be chosen. Part 3 has 30 questions. There are ten short oral conversations in this part. Each short conversation has three written questions about it. Following each question, there are four possible written answers, from which to choose the best answer. Part 4 is made up of 30 questions based on 10 short oral talks, each of which has three associated questions. The questions, with four possible answers each, from which the best answer is to be chosen, are all written.
The Reading section has three parts. All of the texts, questions, and possible answers are contained in the test booklet. Part 5 has 40 questions. Each question is one written sentence with a word or phrase replaced by a blank. Four possible written words or phrases are given for each blank, from which the best grammatical and semantic fit is to be chosen. Part 6 consists of 12 questions based on four written texts. Each text contains a number of sentences of which three have a word or phrase replaced by a blank. Four possible written words or phrases are provided for each blank, from which to chose the one that fits the best grammatically and semantically. Part 7 contains 48 questions in two slightly different formats. The first 28 questions consist of seven to ten single written texts followed by two to four written questions each. Each question has four possible written answers from which the best answer is to be chosen. The final 20 questions are based on four pairs of written texts, each pair of which has five associated written questions. Each question is followed by four possible written answers, from which to choose the best.
14After taking the TOEIC, examinees receive three reported, or scaled, TOEIC scores; Total, Listening, and Reading. The possible scores vary from 10 to 990, from 5 to 495, and from 5 to 495, respectively. The reported Total score is the sum of the reported Listening score and reported
14 Details concerning the format of and changes to the TOEIC discussed in this paragraph and the two preceding paragraphs are explained in pages 32 to 34 of Chapman & Newfields, “New TOEIC test premieres in Japan and Korea; all TOEIC versions are equally valid worldwide,” page 4 of Powers, Kim, & Weng, “Sample (TOEIC),” “Test Content (TOEIC),”
and pages 3 and 4 of TOEIC User Guide: Listening & Reading.
Reading score.
15This is the explanation given by ETS for reporting these three scores and not each of the seven part scores separately:
“The internal consistency score reliabilities for the seven parts of the TOEIC test have ranged from a low of 0.67 to a high of 0.87; these subpart scores are not reported to candidates because they are not sufficiently reliable for use in making decisions about candidates’ English language abilities. In compliance with testing standards, scores with reliabilities over 0.90 are considered to be adequate for reporting and usage (cf.
Standards for Educational and Psychological Testing, 1985).”16
The raw scores from the correct answers to the 100 Listening questions and from the correct answers to the 100 Reading questions are converted to the respective reported or scaled scores by a method called equating. There is no a simple linear conversion of number of correct answers to scaled scores. There are many forms of the TOEIC based on the one format. Forms, here, means the contents of the tests; their specific texts, questions, and possible answers. Each form has a different conversion scale based on the results of a large number of test takers’ performances.
Statistical analyses of these results are used to create a unique conversion scale for each form of the test that produces scores equivalent to the scores produced by all other conversion scales of the TOEIC. Through this method, ETS claims, scaled scores from various forms of the test are reporting examinees’ performances on the various forms of the test equivalently. So, according to ETS, it does not matter which form of the test an examinee takes, as their English abilities will be measured in the same way and they will receive very much the same score regardless of the form.
Test takers do not know which form of the test they sit for.
17In addition to the standard TOEIC that includes a Listening section and a Reading section, the TOEIC Speaking Test and the TOEIC Writing Test were introduced in Japan and South Korea in December of 2006 and are now available elsewhere. They are administered in one sitting, with the former taking 20 minutes and the latter taking 60 minutes.
18There is also a test similar to the
15 These scores ranges are mentioned in page 5 of Woodford and pages I-1 and II-3 of TOEIC Technical Manual.
16 This quotation is from page IV-2 of TOEIC Technical Manual.
17 Equating is explained in page 10 of Chapman (2004), “Frequently Asked Questions About the TOEIC Listening and Reading Test,” and pages II-4 to II-5 of TOEIC Technical Manual.
18 Information about the TOEIC Speaking and Writing can be found in “About the TOEIC Speaking and Writing Tests,”
“ETS Europe UK Launches new TOEIC Speaking and Writing tests May 22, 2008,” “Registration Opens in Japan for
TOEIC for examinees with lower English abilities called the TOEIC Bridge, which was first administered in Japan and South Korea in November of 2001. It contains two sections of 50 questions each. The Listening section comes first and lasts about 25 minutes, according to the length of the recording. This is followed by the Reading section, which takes 35 minutes. All questions are multiple choice with four possible answers given for most questions. Some of the Listening questions only have three possible answers to choose from.
192. What ETS Claims about the TOEIC
Though ETS has not published nearly as many studies on the results of TOEIC administrations as it has of results from some of its other tests, such as the TOEFL,
20these published studies indicate that the TOEIC is a valid and reliable test of English language proficiency. A test is said to have strong validity if measures what its makers and users claim it measures. A test is said to be highly reliable if it measures consistently across various administrations and versions of the test. ETS carried out its first validity study for the TOEIC using scores from the first administration correlated with the scores from subsequent tests taken by some of those first examinees chosen, and then retested, in the following manner:
“When score distributions were obtained for the first administration of TOEIC, 500 examinees were selected to take TOEFL. The 500 were selected on the basis of their scores on the TOEIC. One hundred examinees were selected at each of five approximate score levels: 950, 765, 580, 315, 45. A smaller group of 20 examinees from each group of 100 was selected. To these examinees a series of direct measures of language ability were administered.”
21TOEIC Speaking and Writing Tests,” “South Koreans Take First TOEIC Speaking and Writing Tests,” and TOEIC Speaking and Writing Tests Launched in the UK.
19 Information about the TOEIC Bridge can be found in “About the TOEIC Bridge” and “Sample (TOEIC Bridge).”
20 Chapman (2003) writes on page 2, “ETS has released 69 research reports into TOEFL, with an additional 17 technical reports on this exam between 1977 and 2002. However, for the TOEIC there are only three full research reports. In addition there was an initial validity study in 1982 and one technical manual.” The same details are reported in Chapman (2005). Based on a similar search, Bresnihan writes on page 18, “From the ETS TOEFL website, under TOEFL Research, on March 3, 2010, the present author was able to gain access to 197 research and technical reports and summaries and 17 data reports that could be downloaded and 1 explanation of a mapping of the TOEFL and the Common European Framework of Reference (CEFR), of which a study could be requested. From the ETS TOEIC website, under Research, on the same day, the present author was able to find 15 research reports and summaries, 8 of which were classified as TOEIC-related, and 2 publications, 1 of which led to a report, that could be downloaded. The TOEIC Technical Manual was not one of them, but it was still available online.”
21 This quotation is from page 9 of Woodford.
“The examinees who underwent the direct measures were divided into five groups for the purpose of analysis. Examinees were grouped according to their part scores on the TOEIC. For both Listening and Reading, Group I had TOEIC part scores below or equal to 100; Group II had TOEIC part scores between 100 and 205; Group III had TOEIC part scores between 205 and 300; Group IV had scores between 305 and 400;
and Group V had scores at 405 or above.”
22For those examinees who took the TOEIC and another English proficiency test as part of the just mentioned analyses concerning validity, ETS reports that the TOEIC Listening section scores and scores on another test of listening correlated “very highly--0.90,” and the TOEIC Reading section scores showed a “high degree of similarity” with scores on another reading test, “(t)he correlation between the two . . . (being) 0.79.” Also, the relationship between the TOEIC Listening section scores and scores on a direct test of speaking was reported as correlating at
“0.83 . . . (a) high degree of correlation,” and the TOEIC Reading section scores and scores on a direct test of writing “correlated 0.83,” which was considered a “high correlation.”
23In the same initial study, correlations concerning estimated reliability internal to the TOEIC itself were also reported. For the Listening section scores it was 0.916, for the Reading section scores it was 0.930, and for the Total scores it was 0.956. “These reliabilities are well within the generally accepted limits for measurement of individual achievement.” It was also mentioned that
“(t)he correlation between the sections was 0.769 . . . . This would indicate that each score provides somewhat different information about the examinee and justifies reporting separate scores.”
24Concerning validity, the TOEIC Technical Manual reports all of the above validity figures along with others from a number of additional studies. There are correlations between TOEIC Listening section scores and scores on other tests of listening and scores on tests of speaking and between TOEIC Reading section scores and scores on other tests of Reading and scores on tests of writing. All of these correlations are reported to be above 0.65, with most being above 0.75, and all are judged there to indicate strong or very strong relationships between the two measures in each
22 This quotation is on page 12 of Woodford.
23 These explanations and quotations can be found in pages 12 to 15 of Woodford.
24 These figures and quotations are on page 8 of Woodford.
case.
25Concerning reliability, the TOEIC Technical Manual does not explain what studies were used to generate the reported correlations. However, the figures are very similar to those reported in the initial study referred to just above. The estimated reliabilities of the Listening section scores are reported to be from 0.91 to 0.93. Of the Reading section scores, they are reported to be from 0.92 to 0.93. The Total scores’ estimated reliabilities are reported to vary from 0.95 to 0.96.
26Three other important measures reported in the TOEIC Technical Manual are the standard errors of measurement, the conditional standard errors of measurement, and the standard errors of difference of the reported scores for each section. These standard errors attempt to compensate for fluctuations in each test taker’s scores that might occur due to factors unrelated to the test taker’s true abilities supposedly being measured by the test. The expected possible difference between a test taker’s actual test score and her/his supposed average test score or true ability as measured by the test is the standard error of measurement. For each of the reported scores of the two sections of the TOEIC, the standard error of measurement is about +/-25 scaled points. So, a test taker’s true Listening score is expected to be between her/his reported Listening score plus 25 points and her/her reported score minus 25 points, with about 68% certainty. The situation is the same for her/his true Reading score. (Perhaps the test taker’s true Total score would be between her/his reported Total score plus 50 points and her/his reported Total score minus 50 points, with about 68% certainty, but this was not mentioned.) To find the probable range within which a test taker’s scores would fall with 95% certainty, then the standard errors of measurement would need to be almost doubled, to +/-49 scaled points for the Listening score and for the Reading score (and perhaps to +/-98 scaled points for the Total score). The conditional standard errors of measurement are more precise standard errors of measurement for each of the different scores within the whole range of scores on a given test administration. The conditional standard errors of measurement for a score are smaller the further the score is from the average of all the scores.
27The amount of difference needed between two test takers’ scores, or between two scores by the same test taker from two different sittings of the test, to show a real difference in the scores with about 68% certainty, is called the standard error of difference. For each section of the TOEIC, it is about +/-35 scaled points. (Again, perhaps for the Total score it is about +/-70 scaled points, but this was not stated.) If one wanted to be more certain, 95% certain, if a difference in scores
25 These correlations and judgments are on pages III-1 to III-4 of TOEIC Technical Manual.
26 These correlations can be found in pages IV-1 to IV-2 of TOEIC Technical Manual.
27 These figures and explanations can be found in pages IV-4 to IV-6 of TOEIC Technical Manual.
existed, then these figures would need to be nearly doubled, to +/-69 scaled points (and perhaps to +/-138 scaled points).
28Another important point made in the TOEIC Technical Manual is that “(f)or groups in which there is a great deal of homogeneity (for example, when candidates are pre-selected . . .), reliability estimates will be lower.”
29“If you have a sample of candidates who are very similar to each other, the reliability of the test within that specific homogeneous group will be quite low. . . . If there is no (or very little) variation among candidates’ test scores then, by definition, there can be no accurate estimate of reliability.”
30This would seem to be an important consideration for many colleges and universities in Japan as their students are selected, at least partially, based on their scores on English language examinations.
3. Doubts Concerning Claims by ETS about the TOEIC
Some researchers have disputed the claims made by ETS, concerning TOEIC scores and their usage, in published studies, which often use the TOEIC scores of workers in Japan participating in company-organized English language classes. Chapman pointed out a few inconsistencies in the first published study of the TOEIC. As was mentioned earlier, in that study, Woodford claimed that the correlation of 0.79 that he found between TOEIC Reading section scores and the scores on another direct test of reading showed a “high degree of similarity of performance . . . (and) provides a good indication of the examinee’s ability to read English with understanding.”
31Before this, Woodford stated that the correlation he found between the Listening and Reading sections of 0.769 “indicate(s) that each score provides somewhat different information about the examinee.”
32Chapman stated that
“(t)here is a clear inconsistency in the way Woodford is interpreting the results of the study,” of his correlations of 0.79 and 0.769, and “(i)t is difficult to see how the claim that the two tests of reading show a high similarity of performance can be supported” based on a correlation of 0.79.
33Chapman also questioned certain interpretations in another ETS study done by Wilson in 1989. In that study, correlations between the Listening section scores and scores on a standardized interview test were found to be “typically in the mid-70’s.”
34In a very labored discussion over
28 These figures and explanations are from pages IV-6 to IV-7 of TOEIC Technical Manual.
29 This quotation is on page IV-2 of TOEIC Technical Manual.
30 This quotation is from page IV-3 of TOEIC Technical Manual.
31 This figure and quotation are on page 13 of Woodford.
32 This figure and quotation are from page 8 of Woodford.
33 These quotations are on page 4 of Chapman (2006).
34 This quotation is on page 46 of Wilson (1989).
these findings, Wilson seems to be trying to urge the reader to view his findings as supporting the idea that the TOEIC Listening section scores can be used to infer English speaking ability. We find the following statements concerning the relationship between the two scores:
“a consistent pattern of concurrent correlation”
“a strong underlying functional linkage”
“examinees with relatively high (low) average levels of TOEIC-assessed ability to comprehend spoken English may be expected to perform relatively well (poorly) in the interview situation”
“the evidence that has been reviewed suggests strongly that the ability to comprehend and produce utterances in English is to some extent
"dependent," directly and functionally, upon the ability to comprehend spoken English. Accordingly, it follows logically that level of ability to use English in face-to-face conversation . . . is likely to vary relatively consistently with level of developed English-language listening comprehension”
“likely to be relatively consistent”
35Chapman interprets these finding differently and takes a different stance stating, “This report by Wilson (1989) seems to indicate that a separate speaking test and the TOEIC will provide different information about examinees. . . . (T)o test the ability . . . to speak English, employing the TOEIC test in isolation is unlikely to be the most accurate method available.”
36This is the point of view it seems one would take based on the explanation in the TOEIC Technical Manual noted earlier concerning the reporting of TOEIC scores.
37Here is a slightly more detailed explanation by a professor of educational research about the same issue:
35 In order, these five quotations are on pages 46, 47, 47, 48, and 48, respectively, of Wilson (1989).
36 This quotation is on page 76 of Chapman (2003).
37 This refers to the statement that “scores with reliabilities over 0.90 are considered to be adequate for reporting and usage”
and that those with correlations lower than this are not, which is on page IV-2 of TOEIC Technical Manual.
“The Standards for Educational and Psychological Testing provides direction for test score reporting and usage in the credentialing of persons in many occupations and professions (1999). . . . Important testing information including reliability coefficients are useful in comparing scores from these different tests, but interpretation allowances must be made for the variability of scores from different samples of examinees, administration techniques from which the reliability coefficients were obtained, the source(s) of error indicated by the reliability coefficient, the number of items on the test, and the length of time allowed for testing. Nunnally and Bernstein (1994) provided guidance in the interpretation of the reliability coefficient by stating that a value of .70 is sufficient for early stages of research, but that basic research should require test scores to have a reliability coefficient of .80 or higher. When important decisions are to be made with test scores, a reliability coefficient of .90 is the minimum with .95 or higher a desirable standard.”
38Childs questioned the internal reliability of TOEIC scores. In his study of company workers who were studying English, he estimated raw scores for the reported scores he had based on information given by ETS about one form or version of the test.
39Although this does not lead to the most accurate findings, the results are likely very close to the best that could be determined.
Using the same reliability formula as ETS, his data produced a Total score correlation coefficient of 0.57,
40far lower than that reported by ETS, which is 0.95 to 0.96.
41He also reported his findings concerning score gains over three TOEIC administrations: About one third of the subjects’ scores increased twice, about two thirds increased once and decreased once, and a few subjects’ scores decreased twice.
42In addition, he showed that there were great differences between many examinees’ estimated scores, which were based on previous scores, mean scores, and mean changes in scores, and their actual scores.
43Based on all of this, Childs concluded that “jumping around is the nature of TOEIC scores. . . . The fact is simply that TOEIC . . . is not the best gauge of
38 This quotation is from Schumacker.
39 This is explained on page 69 of Childs.
40 This figure is on page 69 of Childs.
41 These figures are on page IV-2 of TOEIC Technical Manual.
42 These figures are on page 71 of Childs.
43 This is detailed on page 70 of Childs.
individual learning. . . . The use of TOEIC for gauging individual learning is, in general, ineffective or wrong. . . . (T)est-to-test differences will display very great variability.”
44Hirai carried out research into the relationships between TOEIC Listening scores and speaking test scores, between TOEIC Reading scores and writing test scores, and between TOEIC Total scores and both speaking test scores and writing test scores. His data generated a correlation between TOEIC Listening scores and speaking test scores of 0.74.
45ETS reports such correlations to be 0.83, 0.74, and 0.75.
46The correlation Hirai found between TOEIC Reading scores and writing test scores was 0.59.
47Such correlations are reported by ETS to be 0.83.
48Correlations between TOEIC Total scores and speaking test scores were found by Hirai to be 0.78 and 0.66.
49ETS reports correlations of 0.74, 0.76, and 0.73 for such pairings.
50Hirai also reports correlations in his data between TOEIC Total scores and writing test scores of 0.66 and 0.69.
51ETS gives no such correlations in the reports referred to in the present study. So, Hirai’s data produced correlations which are generally just a little lower than those reported by ETS, except for those of 0.83 from the initial study.
However, Hirai doubted the claims made by ETS that their correlations between TOEIC Listening scores and scores on tests of speaking and between TOEIC Reading scores and scores on tests of writing were high enough to make accurate predictions about the test takers’ capabilities in the abilities not tested. “While the correlation coefficient is a general indicator of how closely two quantities relate to each other, one should be cautious about the potential pitfall of predicting the value of one quantity . . . from that of the other . . . on the basis of the correlation coefficient, unless it is extremely close to +/-1.”
52He also noted that the highest of these correlations were from early studies which “may tend to have an inherent bias toward collecting higher scores. . . . As a result, the data collected in such studies tends to be skewed toward the high end, which effectively increases the correlation coefficient.”
5344 The first two of these quoted phrases and sentences are on page 73 of Childs, and the second two are on page 74 of Childs.
45 This figure is from page 2 of Hirai (2002).
46 These figures are from page 14 of Woodford, page 40 of Wilson (1989) and page 9 of Wilson (1993) and pages I-2 and III-2 of TOEIC Technical Manual, and page 6 of Wilson (1993), respectively.
47 This figure is on page 5 of Hirai (2002).
48 This figure is on page 15 of Woodford and pages I-2 and III-4 of TOEIC Technical Manual.
49 These figures are from page 2 of Hirai (2002) and page 17 of Hirai (2009), respectively.
50 These figures are on page 40 of Wilson (1989) and page 9 of Wilson (1993) and pages I-2 and III-2 of TOEIC Technical Manual, page 6 of Wilson (1993), and page 9 of Wilson (1993), respectively.
51 These figures are on page 5 of Hirai (2002) and page 38 of Hirai (2008), respectively.
52 This quotation is on page 7 of Hirai (2002).
53 This quotation is from pages 13 and 14 of Hirai (2009).
Furthermore, Hirai followed the procedure described by Woodford of finding correlations between only specific TOEIC scores and scores on other measures,
54which was explained earlier.
He did this using both the TOEIC scores chosen by Woodford and other scores. In all cases, his correlation coefficients increased.
55He also tried finding correlations between segments of his data sets as determined by TOEIC scores and correlations on other measures. In these cases, all of his correlations decreased.
56The latter procedure, however, somewhat replicates the real-world situation in which companies and schools have groups of their employees or students, respectively, take the TOEIC. In such cases, it is probably never the case that there is anywhere near as much variation in scores on a given TOEIC IP Test administration as on the administrations used in the studies by ETS or on a public TOEIC SP Test administration. Therefore, correlations from any TOEIC IP Test administration would be lower than those reported by ETS, which means the reliability of the TOEIC scores would be weaker, too.
In a prior study, the present author investigated TOEIC IP Test scores taken six months apart by first-year university students, who were not English majors and were taking three 90-minute English classes per week during each semester, in one department at a university in Japan. What was revealed was that evidence of overall language proficiency, which would be demonstrated by consistency in scores, could not be demonstrated through correlations between those students’
TOEIC Listening scores and TOEIC Reading scores grouped in many different ways. The correlations were lower, often much lower, than would be expected to support the idea that something in common was the basis of the scores. Between Listening scores and Reading scores on the same test administrations, these correlations were all between 0.35 and 0.53, inclusive.
57In the initial study by ETS, the correlation between the Listening and Reading scores was reported to be 0.769.
58The present author also did not find as strong relationships between the Listening scores on the first and second test administrations and between the Reading scores on the first and second administrations as would be expected considering the relationships ETS studies have found between TOEIC Listening scores and other measures of Listening and between TOEIC Reading scores and other measures of Reading. They all fell in or near the lower end of what ETS reports. All of the correlations between the two Listening scores and between the two Readings scores in this author’s
54 This procedure is explained on page 12 of Woodford.
55 This procedure is detailed and the results are reported on page 18 of Hirai (2009).
56 This procedure is detailed and the results are reported on pages 3 and 4 of Hirai (2002), pages 38 and 39 of Hirai (2008), and pages 17 and 18 of Hirai (2009).
57 These figures are on pages 92, 93, 96, 121, and 123 of Bresnihan.
58 This figure is from page 8 of Woodford.
earlier study were between 0.60 and 0.72, inclusive.
59The TOEIC Technical Manual, which includes the results of the initial study, presents correlations between TOEIC Listening scores and other listening measures of 0.67 to 0.92 and correlations between TOEIC Reading scores and other reading measures of 0.73 to 0.87.
60The Listening scores and the Reading scores in each of the ten test administrations of the present author’s earlier study were also normally distributed with the means and medians never deviating by more than 5.8 points, but usually less than half that amount.
61And, the numbers of Listening scores and the numbers of Reading scores increasing and decreasing, on the second testing from the first testing for all of the scores from the ten test administrations combined, were fairly similar. Of the Listening scores, about 54% increased, 5% remained the same, and 42%
decreased. Of the Reading scores, about 53% increased, 5% were unchanged, and 43%
decreased.
62This author interpreted these two analyses along with the just mentioned correlations between the Listening scores and Reading scores on the first test sitting and the Listening scores and Reading scores on the second test sitting, respectively, to be evidence of regressions to the mean, which is commonly a result of guessing at answers to questions on a test. This was taken to be an indication that the test was likely too difficult for these students and, therefore, called into question the ability of these scores to have been reliable evaluations of these students’ English language abilities.
634. Materials, Procedures, and Purposes
The TOEIC IP Test scores used in this study were from tests taken by first-year students in one department at a university in Japan.
64The students were not English majors. They were all enrolled in three distinct mandatory English courses, each of which met for 90 minutes once a week throughout both 15-week semesters. One course emphasized reading, with some discussion; one course emphasized listening, with some speaking; and one course emphasized grammar, with some writing. There were eight sections of each course with about 25 students in each section.
Placement in sections was done primarily in student identification number order.
At the end of approximately the eleventh week of each semester, the students were required to take the TOEIC IP Test administered at the school. Without doing so, a student could not pass
59 These figures are on pages 92, 93, 98, 121, and 122 of Bresnihan.
60 These figures are on pages III-2 to III-4 of TOEIC Technical Manual.
61 These figures are from pages 56, 60, 105, 106, and 109 of Bresnihan.
62 These figures are on page 171 of Bresnihan.
63 This point is explained and elaborated on pages 86, 88, 98 to 102, 120, 124, and 216 of Bresnihan.
64 A large portion of these scores was also used by the present author in an earlier study, Bresnihan.
any of the three compulsory English courses, and each student’s TOEIC Total score was used in determining her/his final grade. (See Appendix A for details.) Between the two semesters, there was the two and a half months’ long summer vacation. So basically, between the two tests, there were 4 weeks of classes followed by 11 weeks without classes, and then another 11 weeks of classes.
Students needed to attend at least two thirds of a course’s classes in order to be eligible to pass it.
The approximately 2,400 TOEIC IP Test scores used in this study were achieved by about 1,200 students, who took the test twice a year, about 200 students per year, over a six-year period, from 2004 to 2009. Approximately half of the tests were taken before the first changes to the TOEIC were made in 2007, and about half were taken after. There were few, if any, changes in the teachers who taught the three mandatory English courses. Each teacher taught the same group(s) of students, the same section(s), for both semesters. None of the students were taught by the same teacher for two different courses.
Basic statistics were generated using Microsoft Excel 2004 for Macintosh. One-way analyses of variance were carried out using JMP 5.0 for Macintosh.
65Other statistics related to effect size were calculated on line.
66Any slight discrepancies among figures within or among tables are due to rounding.
A number of issues are reported on concerning this data. First an initial viewing of various ranges of the scores are presented and are compared with TOEIC scores from the general population, with what is possible for TOEIC test scores, and with the scores reported by ETS in its initial study. Then, comparisons are made between the average TOEIC scores achieved in this study on the first administration and the second administration, followed by similar comparisons for each individual student’s scores. Lastly, comments are made concerning the use of TOEIC scores in courses of English language study.
5. Comparisons of These Scores with the Scores of Other University Students in Japan and the Scores Used in the Initial ETS Study
Table 1 shows the average TOEIC IP (not SP) Test Total, Listening, and Reading scores achieved by all undergraduate students who sat for the test in Japan from 2004 to 2009, as well as the number of examinees. The lowest average Total score is 425 in 2004 and the highest is 439 in 2009, a spread of 15 points. The lowest average Listening score is 242 in 2004 and 2008 and the
65 The one-way analyses of variance were run for me by Michael Redfield. I am grateful for this and for his help in understanding the results of these analyses.
66 Cohen’s d and correlation coefficient figures were calculated using “Effect Size Calculators” and “Effect Size Calculators (2).”
highest is 251 in 2005, the range being 10 points. The lowest average Reading score is 181 in 2006 and the highest is 195 in 2009, a variation of 15 points.
Table 1
Average TOEIC IP Test Scores of All Undergraduate Students in Japan:
2004 to 200967
2004 2005 2006 2007 2008 2009 n=214,741 n=243,286 n=271,857 n=300,511 n=304,906 n=309,311 Total 425 435 428 431 430 439
Listening 242 251 247 245 242 244
Reading 183 184 181 186 188 195
Table 2 gives the average TOEIC IP (not SP) Test Total, Listening, and Reading scores achieved by only first-year undergraduate students who took the test in Japan from 2004 to 2009, and the numbers of test takers. The spread in average Total scores is from 387 in 2004 to 412 in 2009, 26 points. The lowest average Listening score is 222 in 2004 and the highest is 233 in 2006, a range of 12 points. The lowest average Reading score is 165 in 2004 and the highest is 184 in 2009, a variation of 20 points.
Table 2
Average TOEIC IP Test Scores of All First-Year Undergraduate Students in Japan:
2004 to 200968
2004 2005 2006 2007 2008 2009 n=91,853 n=108,636 n=132,470 n=146,901 n=148,772 n=152,937 Total 387 401 401 406 405 412
Listening 222 232 233 232 227 228
Reading 165 169 168 174 178 184
Table 3 shows the average TOEIC IP (not SP) Test Total, Listening, and Reading scores achieved by only students whose major was similar to that of the students whose scores are being used in this study and who took the test in Japan from 2004 to 2009, and the numbers of students these were. The lowest average Total score is 408 in 2007 and the highest is 433 in 2005, a
67 These figures are from page 8 of TOEIC Test Data & Analysis 2004, page 8 of TOEIC Test Data & Analysis 2005, page 8 of TOEIC Test Data & Analysis 2006, page 9 of TOEIC Test Data & Analysis 2007, page 9 of TOEIC Test Data &
Analysis 2008, and page 9 of TOEIC Test Data & Analysis 2009.
68 These figures are from page 8 of TOEIC Test Data & Analysis 2004, page 8 of TOEIC Test Data & Analysis 2005, page 8 of TOEIC Test Data & Analysis 2006, page 9 of TOEIC Test Data & Analysis 2007, page 9 of TOEIC Test Data &
Analysis 2008, and page 9 of TOEIC Test Data & Analysis 2009.
variation of 26 points. The lowest average Listening score is 230 in 2008 and the highest is 246 in 2005, a spread of 17 points. The lowest average Reading score is 177 in 2007 and the highest is 191 in 2009, a range of 15 points.
Table 3
Average TOEIC IP Test Scores of All Students in Japan Whose Major Was Similar to That of the Students Whose Scores Are Being Used in This Study:
2004 to 200969
2004 2005 2006 2007 2008 2009 n=52,891 n=56,240 n=63,138 n=60,046 n=60,953 n=61,779 Total 418 433 425 408 412 424
Listening 235 246 242 231 230 233
Reading 183 187 183 177 182 191
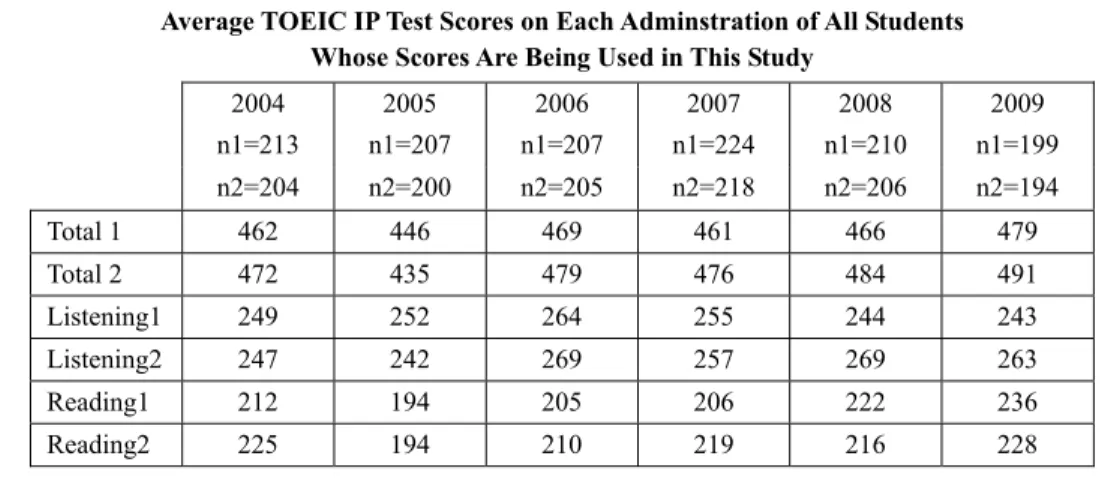
Table 4 displays the average TOEIC IP Test Total, Listening, and Reading scores on each administration of the test achieved by the students whose scores are being used in this study, and the numbers of test takers. The lowest average Total score is on the second test in 2005, 435, and the highest is on the second test in 2009, 491. They vary by 57 points. Only in 2005 is the average Total score lower on the second test than on the first, and both of the average Total scores in 2005 are noticeably lower than all others. The next lowest average Total score is 461 on the first test in 2007, varying by only 31 points from the highest. The average Listening scores are spread from 242 on the second test in 2005 to 269 on the second test in both 2006 and 2008, a 28-point
Table 4
Average TOEIC IP Test Scores on Each Adminstration of All Students Whose Scores Are Being Used in This Study
2004 2005 2006 2007 2008 2009 n1=213 n1=207 n1=207 n1=224 n1=210 n1=199 n2=204 n2=200 n2=205 n2=218 n2=206 n2=194
Total 1 462 446 469 461 466 479
Total 2 472 435 479 476 484 491
Listening1 249 252 264 255 244 243
Listening2 247 242 269 257 269 263
Reading1 212 194 205 206 222 236
Reading2 225 194 210 219 216 228
69 These figures are from page 8 of TOEIC Test Data & Analysis 2004, page 8 of TOEIC Test Data & Analysis 2005, page 8 of TOEIC Test Data & Analysis 2006, page 9 of TOEIC Test Data & Analysis 2007, page 9 of TOEIC Test Data &
Analysis 2008, and page 9 of TOEIC Test Data & Analysis 2009.
difference. The lowest average Reading score is 194 on both tests in 2005 and the highest is 236 on the first test in 2009, a range of 43 points.
Whether comparing the averages of the TOEIC IP Test scores being used in this study to those for the same years of all undergraduate students in Japan, of all first-year undergraduate students in Japan, or of all students in Japan whose major was similar to that of the students whose scores are being used in this study, the averages of the TOEIC IP Test scores being used in this study are somewhat higher than those for students throughout the whole of Japan. The two lowest average Total scores of the scores being used in this study are 435 and 446 on the second and first administrations in 2005, respectively. The next lowest average Total score is 461 on the first test in 2007 and the highest is 491 on the second test in 2009. The highest average Total score of all undergraduate students in Japan is 439 in 2009, of all first-year students in Japan is 412 in 2009, and of all students in Japan whose major is similar to that of the students whose scores are being used in this study is 433 in 2005. These are all clearly lower than the highest of the average Total scores in this study, 491. The lowest average Total score of all undergraduate students in Japan is 425 in 2004, of all first-year students in Japan is 387 in 2004, and of all students in Japan whose major is similar to that of the students whose scores are being used in this study is 408 in 2007. These are all lower than the lowest of the average Total scores in this study, 435, and much lower than lowest achieved outside of 2005, 461.
The lowest average Listening score of the scores being used in this study is 242 on the second test in 2005 and the highest is 269 on the second test in 2006 and in 2008. The lowest average Listening score of all undergraduate students in Japan is also 242 in 2004 and in 2008, of all first-year students in Japan is 222 in 2004, and of all students in Japan whose major was similar to that of the students whose scores are being used in this study is 230 in 2008. Although the first of these scores is the same as lowest of the average Listening scores in this study, 242, the latter two are noticeably lower. The highest average Listening score of all undergraduate students in Japan is 251 in 2005, of all first-year students in Japan is 244 in 2009, and of all students in Japan whose major was similar to that of the students whose scores are being used in this study is 246 in 2005.
These are all lower than the highest of the average Listening scores in this study, 269.
The lowest average Reading score of the scores being used in this study is 194 on the first
and second tests in 2005 and the highest is 236 on the first test in 2009. The lowest average
Reading score of all undergraduate students in Japan is 181 in 2006, of all first-year students in
Japan is 165 in 2006, and of all students in Japan whose major was similar to that of the students
whose scores are being used in this study is 177 in 2007. These are all lower than the lowest average Reading score in this study, 194. The highest average Reading score of all undergraduate students in Japan is 195 in 2009, of all first-year students in Japan is 184 in 2009, and of all students in Japan whose major was similar to that of the students whose scores are being used in this study is 191 in 2009. These are all far below the highest average Reading score in this study, 236.
Based on these first four tables and comparisons, it appears that the scores achieved by the students in this study are higher than those of similar students throughout Japan, on average. The lowest average Total score in this study is 435 while the highest of those in the other three categories of students from throughout Japan is 439. The highest in this study is 491. The lowest average Listening score in this study is 242 and the highest is 269. The highest of those in the other three categories is 246. The lowest average Reading score in this study is 194 while the highest of those in the other three categories is 195. The highest in this study is 236. In the initial study reported by ETS, upon which the TOEIC’s scoring system, explained earlier, is based, the average Total score was 578, the average Listening score was 290, and the average Reading scores was 288.
70These average scores are quite a bit higher than those in this study and those of undergraduate and first-year students in Japan and of students in Japan whose major is similar to those of the students whose scores are being used in this study.
The initial study also reports, for the scores being used there, that the Listening scores varied from 40 to 495, with about 68% falling between 200 and 370 and with a mean, or average, of 290, and that the Reading scores varied from 5 to 455, with about 70% between 210 and 385 and with a mean of 288. About 68% of the Total scores fell between 400 and 745, with the mean being 578, but no overall range of variation was given for the Total scores.
71It was not mentioned, but the present author assumes that these ranges of about 68% to 70% of the scores are around the respective means or medians. Tables 5 and 6 include similar information concerning the scores being used in the present study.
In Table 5, we find that the lower ends of the ranges of variation for about two thirds of the Total scores around the mean/median in this study are usually a bit lower than that from the initial study published by ETS, being between 380 and 390 as compared to 400. Two are much lower, 355 and 365 in 2005, and two are a little higher, 410 and 415 in 2009. The higher ends of the ranges of variation for about two thirds of the Total scores around the mean/median in this study are
70 These figures are on page 9 of Woodford.
71 These figures are on page 9 of Woodford.
a great deal lower than that reported in the initial study. The former are between 525 and 585 while the latter is 745.
Table 5
Ranges of Variations in Scores Being Used in This Study for Two Thirds of the Scores Surrounding the Means/Medians
Year Total1 % Total2 % Listen1 % Listen2 % Read1 % Read2 % 2004 380-555 68.1 385-565 69.1 200-290 70.9 210-295 68.6 165-265 69.0 170-280 70.1 2005 365-525 68.6 355-525 70.5 205-295 69.6 195-285 70.5 140-240 68.6 140-245 70.0 2006 390-540 68.1 385-565 69.8 215-305 68.1 215-320 67.8 140-245 69.1 160-255 68.8 2007 385-550 70.1 385-545 68.8 210-300 69.6 215-300 70.6 150-250 69.6 170-260 68.8 2008 390-530 69.0 395-575 69.4 210-290 68.6 230-315 70.3 170-270 68.6 165-275 68.4 2009 415-550 69.3 410-585 69.6 210-275 69.8 225-305 68.6 190-290 71.3 175-270 68.6
The lower ends of the ranges of variation for about two thirds of the Listening scores around the mean/median in this study are usually about the same as that in the initial study. From the present study, most of the lower ends are between 195 and 215 and the ones in 2008 and 2009 are 230 and 225, respectively, while it is 200 in the initial study. The higher ends of the ranges of variation for about two thirds of the Listening scores around the mean/median in this study are between 275 on the first test in 2009 and 320 on the second test in 2006. In the initial study, it is 370, much higher than in the present study.
The lower ends of the ranges of variation for about two thirds of the Reading scores around the mean/median in this study are usually rather lower than that in the initial study. In this study, the lower ends are between 140 and 175, except on the first test in 2009 when it is 190. It is 210 in the initial study. The higher ends of the ranges of variation for about two thirds of the Reading scores around the mean/median in this study are very much lower than that in the initial study, being between 240 on the first test in 2005 and 290 on the first test in 2009 while it is 385 in the initial study.
This data indicates that a great many of the scores being used in this study are noticeably
lower than most of those in the initial study, as determined especially by the upper limits of the
variations in scores for about the middle 68% to 71% of the students. Table 5 also shows that the
majority of the scores occur in much more restricted ranges than the scores in the initial study. In
the initial study, the lower and upper scores of about the middle two thirds of the Total scores vary
by 345 points, while the variation is between 135 and 180 points for the scores being used in this
study. For the Listening scores in the initial study, this variation is 170, but it is only 65 to 105
points for the scores being used in this study. About the middle two thirds of the initial study’s Reading scores vary by 175 points from lowest to highest, yet they vary by only 95 to 110 points for the scores being used in this study. Table 6 continues this inquiry, giving the basic statistics from the TOEIC scores of the 12 administrations being used in this study.
72Table 6
Maximums, Minimums, Means, Medians, Standard Deviations, and Number of Scores Greater Than 3 Standard Deviations from the Mean
2004: n1=213, n2=204
Total1 Total2 Listen1 Listen2 Read1 Read2
Maximum 890 695 465 375 425 335
Minimum 235 265 150 140 60 85
Mean 462 472 249 247 212 225
Median 450 470 250 245 210 225
Stdv 86.1 85.1 47.9 45.5 52.8 53.5
No.>3 Stdv 1 0 1 0 1 0
No.<3 Stdv 0 0 0 0 0 0
2005: n1=207, n2=200
Total1 Total2 Listen1 Listen2 Read1 Read2
Maximum 725 705 395 425 330 310
Minimum 210 230 145 115 55 75
Mean 446 435 252 242 194 194
Median 445 435 255 245 190 193
Stdv 84.7 85.3 46.4 46.8 51.4 51.3
No.>3 Stdv 1 1 1 2 0 0
No.<3 Stdv 0 0 0 0 0 0
2006: n1=207, n2=205
Total1 Total2 Listen1 Listen2 Read1 Read2
Maximum 675 770 380 415 335 360
Minimum 160 230 100 125 60 80
Mean 469 479 264 269 205 210
Median 480 480 265 270 210 210
Stdv 83.6 94.6 48.4 53.1 49.4 55.2
No.>3 Stdv 0 1 0 0 0 0
No.<3 Stdv 1 0 1 0 0 0
72 Visual displays in the form of bar graphs of much of this data sorted in many ways can be seen in parts II and III and appendices A to M of Bresnihan.
Table 6 cont.
Maximums, Minimums, Means, Medians, Standard Deviations, and Number of Scores Greater Than 3 Standard Deviations from the Mean
2007: n1=224, n2=218
Total1 Total2 Listen1 Listen2 Read1 Read2
Maximum 820 835 435 465 385 370
Minimum 230 280 125 115 90 95
Mean 461 476 255 257 206 219
Median 455 473 255 255 200 215
Stdv 82.0 88.1 46.8 49.5 48.9 51.2
No.>3 Stdv 2 2 2 2 1 0
No.<3 Stdv 0 0 0 0 0 0
2008: n1=210, n2=206
Total1 Total2 Listen1 Listen2 Read1 Read2
Maximum 710 735 390 390 385 385
Minimum 275 275 110 120 115 85
Mean 466 484 244 269 222 216
Median 470 483 240 270 220 215
Stdv 73.1 86.2 41.7 44.6 47.3 55.1
No.>3 Stdv 1 0 0 0 2 1
No.<3 Stdv 0 0 1 0 0 0
2009: n1=199, n2=194
Total1 Total2 Listen1 Listen2 Read1 Read2
Maximum 685 730 385 410 360 410
Minimum 280 255 125 145 95 100
Mean 479 491 243 263 236 228
Median 480 490 240 260 235 230
Stdv 79.5 88.3 41.4 45.8 51.3 55.3
No.>3 Stdv 0 0 2 1 0 1
No.<3 Stdv 0 0 1 0 0 0
Of the maximum Total scores, three are above 800, on the first test in 2004 and the two tests in 2007. Six other maximum Total scores are between 700 and 800, and three are in the upper 600s, on the second test in 2004 and first tests in 2006 and 2009. One minimum Total score is below 200, on the first test in 2006. All of the other minimum Total scores are between 200 and 300. All of the means for Total scores are between 435 and 491, inclusive. The Total scores’
mean reported in the initial study by ETS is 578. The range of those Total scores is not given.
Half of the maximum Listening scores are above 400, and half are in the upper 300s. All of
the minimum Listening scores are between 100 and 150, inclusive. The Listening scores’ means are between 242 and 269, inclusive. In the initial study, the Listening scores vary from 40 to 495, and the Listening scores’ mean is reported to be 290.
Ten of the maximum Reading scores are between 300 and 400, and two, on the first test in 2004 and the second test in 2009, are in the lower 400s. Ten of the minimum Reading scores are below 100, and two are in the lower 100s, on the first test in 2008 and the second test in 2009. The means for the Reading scores are between 194 and 236. The variation in the Reading scores reported in the initial study is from 5 to 455, and the mean is 288.
In the initial study, Woodford states, “It is quite gratifying that the (grading) scale functions as intended. Almost all of the points on the scale are utilized for both sections of the test as well as for the total score.”
73The entire range is from 5 to 495 for each of the two sections, Listening and Reading, and 10 to 990 for the Total score.
74In Table 6, it is clear that the scores being used in this study do not vary as much as those in the initial study. Scores are not found near either end of the three scales for most of this data. The only ones that are close are the highest Listening scores and the lowest Reading scores. Therefore, these scores are more restricted in their variation than are the scores in the initial study. They are from a population more homogeneous in English language abilities than the population tested in the initial study. At the end of Section 2 above, referring to information provided by ETS, it is explained that the greater the homogeneity of the group in the abilities being tested, the less reliable will be the test scores of those abilities. Also, the averages of the Listening scores are somewhat lower and the averages of the Reading scores are much lower than those in the initial study. So, the language abilities of these students as measured by the TOEIC are quite a bit lower than those of a great of the subjects as measured by the TOEIC for the initial study.
Table 6 also shows that the means and medians, or numerical mid points, of the scores are very similar in all cases for the Total, Listening, and Reading scores. Almost all are within a few points of each other. There are only two differences greater than 10 points. They are of 12 and 11 points for Total scores on the first test in 2004 and the first test in 2006, respectively. As the scales for the TOEIC scores are so wide, these small differences between the means and medians indicate that these sets of scores are distributed very close to normally, close enough to be assumed they are normally distributed for further types of statistical analysis. This means that about 68% of
73 This quotation is from page 9 of Woodford.
74 These figures are from page 5 of Woodford.