Development and Challenge of the Japan-Korea-China International
Input-Output Table
Mitsuo Yamada
†Kozo Miyagawa
‡Zaizhe Wang
††【 Abstract 】
The economic globalization has strengthened the interdependence among countries in the world. This interdependence can be analyzed by using the international input- output (IO) tables. The Institute of Developing Eco- nomics, Japan External Trade Organization (IDE-JETRO) and the Minis- try of Economics, Trade and Industry (METI) in Japan have led in the fi eld of international IO tables for a long time. In recent years, the international IO tables have gained increasing interest from the value-added trade and value chain viewpoints. The development of the World Input-Output Data- base (WIOD), and Organization for Economic Co-operation and Develop- ment’s (OECD) IO databases is well known. Moreover, Yokohama National University’s Global IO database (YNU-GIO) in Japan has also been recently
†
Faculty of Economics, Chukyo University, Aichi, JAPAN, [email protected] u.ac.jp.
‡
Faculty of Economics, Rissho University, Tokyo, JAPAN, [email protected].
††
Faculty of Economics, Rissho University, Tokyo, JAPAN, [email protected].
研究ノート
made accessible to the public.
The WIOD and YNU-GIO databases intended to cover relatively wide areas including more than 30 countries, although the sector classifi cation is not so detailed. On the other hand, METI tried to build bilateral IO tables, that is 2000/2005 Japan-US table and 2007 Japan-China table. The Japan- US tables have adopted a relatively detailed sector classifi cation with more than 170 sectors, while the Japan-China table has 77 sectors. The IDE’s Asian IO table has a moderate size with 10 regions and a relatively large sector size with 76 sectors.
We are conducting the study to construct the 2012 international IO table of Japan, South Korea, and China to analyze their interdependence, which is rapidly increasing through the foreign direct investment and international commodity trade. After reviewing the recent experiences of international IO databases, we discuss our IO table framework, characteristics of sector classifi cation, advantages and disadvantages compared to other international IO tables, and future analysis we expect to conduct.
【 Keywords 】 International input-output table, International trade structure
1. Background and Aim
The economics globalization has strengthened the interdependence among countries in the world. This interdependence can be analyzed by using the international input-output (IO) tables. The Institute of Development Eco- nomics, Japan External Trade Organization (IDE-JETRO) and the Minis- try of Economics, Trade and Industry (METI) in Japan have led in the fi eld of international IO tables for a long time.
In recent years, the international IO tables have gained increasing inter-
ests from the value-added trade and value chain perspectives. The develop-
ment of the World Input-Output Database (WIOD hereafter) and the Economic Co-operation and Development’s Inter-Country Input-Output Table (OECD-ICIOT hereafter) databases is well known. Fu rther, Yokohama National University’s Global IO (YNU-GIO hereafter) database in Japan has also been recently accessible to the public.
We conduct the study to construct the 2012 international IO table of Japan, South Korea, and China to analyze their interdependence, which is rapidly increasing through the direct investment and the international com- modity trade.
In this study, after reviewing the recent experiences of the international IO databases, we introduce our project of the 2012 Japan-China-Korea International Input-Output Table (IOT) in collaboration with the State Information Center (SIC) and the National Bureau of Statistics (NBS), China, and the Korea Institute for Industrial Economics and Trade (KIET), Korea.
2. Comparison of International IOTs
2.1 Experiences in Japan
First, we briefl y review the experiences in Japan in the fi eld of the inter-
national IOTs. METI in Japan has contributed to the construction of Inter-
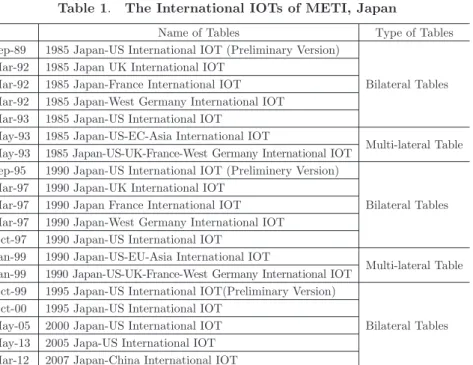
national IOTs. Table 1 shows their outcome in this fi eld. The fi rst interna-
tional IOT compiled by METI was the 1985 Japan-US International IOT
(preliminary version), which was released in 1989. Such bilateral IOTs with
the UK, France, West Germany, and the US were also created within a few
years. In 1993, they were combined as a multi-country IOT which is the
1985 Japan-US-EC-Asia International IOT. From 1995 to 1999, the 1990
bilateral IOTs for the US, the UK, France, and West Germany were com-
piled, each of which was integrated as a multi-country IOT for 1990.
After 2000, they concentrated their eff orts on the IOT between Japan and the US; the 1995 IOT was released in 2000, the 2000 IOT was released in 2005, and the 2005 IOT was released in 2013. Moreover, METI conducted another trial for developing the 2007 Japan-China International IOT with the NBS, China. This project started in 2009, and the table was released in 2012
1. This project was the fi rst trial in the sense that the International
Table 1. The International IOTs of METI, Japan
Name of Tables Type of Tables
Sep-89 1985 Japan-US International IOT (Preliminary Version)
Bilateral Tables Mar-92 1985 Japan UK International IOT
Mar-92 1985 Japan-France International IOT Mar-92 1985 Japan-West Germany International IOT Mar-93 1985 Japan-US International IOT
May-93 1985 Japan-US-EC-Asia International IOT
Multi-lateral Table May-93 1985 Japan-US-UK-France-West Germany International IOT
Sep-95 1990 Japan-US International IOT (Preliminery Version)
Bilateral Tables Mar-97 1990 Japan-UK International IOT
Mar-97 1990 Japan France International IOT Mar-97 1990 Japan-West Germany International IOT Oct-97 1990 Japan-US International IOT
Jan-99 1990 Japan-US-EU-Asia International IOT
Multi-lateral Table Jan-99 1990 Japan-US-UK-France-West Germany International IOT
Oct-99 1995 Japan-US International IOT(Preliminary Version)
Bilateral Tables Oct-00 1995 Japan-US International IOT
May-05 2000 Japan-US International IOT May-13 2005 Japa-US International IOT Mar-12 2007 Japan-China International IOT Source: METI websit
e.
1
The workshop was held in Beijing on March 2, 2012 for the fi nal project report and some application studies using the IOT. (http://www.meti.go.jp/statistics/
tyo/kokusio/nittyuu/2007nen/gaiyou.html). For related studies, see Wang,
Miyagawa, and Yamada (2016); Yamada, Wang, and Miyagawa (2016); and
Yamada (2014).
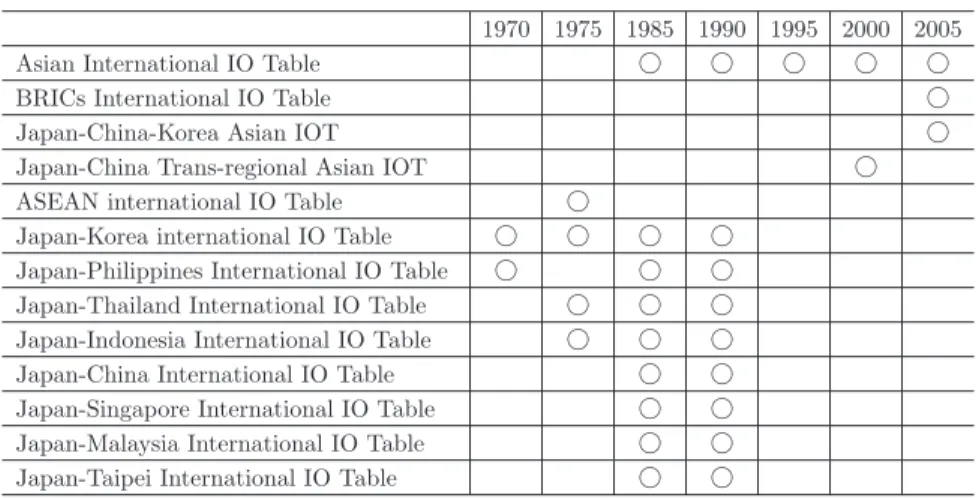
Table 2. The international IOTs of IDE-JETRO
1970 1975 1985 1990 1995 2000 2005
Asian International IO Table
〇 〇 〇 〇 〇
BRICs International IO Table
〇
Japan-China-Korea Asian IOT
〇
Japan-China Trans-regional Asian IOT
〇
ASEAN international IO Table
〇
Japan-Korea international IO Table
〇 〇 〇 〇
Japan-Philippines International IO Table〇 〇 〇
Japan-Thailand International IO Table〇 〇 〇
Japan-Indonesia International IO Table〇 〇 〇
Japan-China International IO Table
〇 〇
Japan-Singapore International IO Table
〇 〇
Japan-Malaysia International IO Table〇 〇
Japan-Taipei International IO Table
〇 〇
Source: Jetro-IDE website.
IOT was created through the cooperation between the two countries’ gov- ernments.
As the second experience in Japan, we could see the Asian International IOT series. Here, IDE-JETRO is also a great contributor in this fi eld. Table 2 shows their outcome. The Asian International IOTs have more than 20–
year history. The latest IOT is the 2005 Asian International IOT in which 10 countries and regions, namely Japan, the US, China, South Korea, Chi- nese Taipei, Singapore, Malaysia, the Philippines, Thailand, and Indonesia are included, and the transactions among 76 sectors for each country are captured. However, no IOT after 2005 has been released to the public.
2.2 Recent Trend in International IOTs
In recent years, the international IOTs have gained increasing interest
from the value-added trade and value chain perspectives. The development
of the WIOD and the OECD IO databases is well known. Further, YNU-
GIO database in Japan has also been recently open to the public access.
Table 3 shows the typical international IOT databases, which are relatively easy to access. Besides the IDE-JETRO’s Asian IOT we select three data- bases: the WIOD (Dietzenbacher et al. (2013), the OECD-ICIOT (Yamano (2016), and the YNU-GIO (Sato and Shrestha (2014).
The WIOD, OECD-ICIOT, and YNU-GIO databases intended to cover relatively wide areas including more than 30 countries, although the sector classifi cation is not so detailed. As another characteristic, the time series data are estimated, which enables to capture the trend and change of the international transaction structure.
Figure 1 shows the characteristic of the International IOTs from the viewpoint of the area coverage and number of sectors in each table. The WIOD, ICIOT-OECD, and YNU-GIO databases intended to cover relatively wide areas including more than 30 countries, although the sector classifi ca- tion is not so detailed. On the other hand, METI tried to build bilateral IO
Table 3. Typical International IOT databases, easy to access
Name of Tables Institutions Sectors Counties and
Regions Years
Asia International
IOT IDE-JETRO 76,
78 10 1990/1995/2000
/2005
YNU-GIO Yokohama
National Univ. 35 27 1997–2012
World input- output database (WIOD)
Dietzenbacher
and
et.
al. 35 40 1995–2011
Inter-Country input output table (ICIOT)
OECD 34 62 1995, 2000, 2005,
2008–2011
tables, that is, 2000/2005 Japan-US table and the 2007 Japan-China table.
The Japan-US tables have adopted relatively detailed sector classifi cation with more than 170 sectors, while the Japan-China table has 77 sectors.
The IDE’s Asian IOT has moderate size with 10 regions, and relatively large sector size comprising 76 sectors.
To build international IOTs, it has become a trend to include more coun- tries and regions which enable to investigate the international linkage among countries, for example, in terms of trade in value added (TiVA). The more countries and regions included in the IOT, the less the number of defi ned sectors, because the IOT of each country has diff erent sector defi nitions, and the common classifi cation in the international IOT tends to be incom- plete. This tendency makes the analysis, for example, intra-industry trade analysis of the electrical machinery sector, inadequate.
There might be another direction to extend international IOTs, in which the IOT is compiled with relatively large sector size although the coverage
No. of NaƟons and Regions No. of Sectors
76
35 34
10 27
IDE-AIO
YNU-GIO WIOD
40 J-US-IO
J-C-IO
2 77 174
62
Our Target
Area
ICIOT Figure 1. Comparison of the International IOTs
of regions is relatively limited. The international IOT that we intend to compile in our project belongs to this target area. A relatively large sector size allows us to investigate the industrial and trade structures in detail, impacts of lower tariff s in the framework of free trade agreements (FTAs), integrational price diff erence, and the industrial productivity.
3. Preliminary Studies for Our Project
Here, we show some activities, which were begun prior to our project.
3.1 METI’s 2012 Japan-China International IOT
METI of Japan and NBS of China cooperatively constructed the 2007 Japan-China International IOT. The project started in 2009 and the table was published in June 2012. This was the fi rst collaborative project, so both the organizations intended to build a more complete IOT in the subsequent trial including some unresolved issues.
METI conducted preliminary studies for the construction of the 2012 Japan-China IOT for three years from 2012 to 2014, during which we were able to join. The issues examined were as follows:
・ Remaining problems in constructing the 2007 IOT;
・Common classifi cation of sectors;
・ Discrepancy of international trade data between two countries; and
・ System of national accounts (SNA) related issues and others
3.2 Issues discussed in Preliminary Studies, 2012–2014 1) Common classifi cation of sectors
There were 77 sectors in the 2007 Japan-China International IOT, and
we recognized that it was necessary to increase the sector size of the 2012
Japan-China IOT. The number of sectors of 2012 China IOT is 135, and
that of 2012 Japanese updated IOT is 516×395. We compared the classifi - cations of 2012 IOTs in both countries, and examined the possibility of increasing the number of sectors up to around 90. It was possible to divide the following fi ve sectors; “26 other chemical products”, “35 nonmetallic mineral products”, “36 Steel”, “37 non-steel metals”, “39 general purpose and special purpose machinery” and “40 industrial electric equipment.”
2) Creation of the 2012 HS-IO converter for Japan and China.
To compile the international trade fl ow matrix by sector between Japan and China, we had to make a HS-IO converter table for each country, because the international trade statistics are compiled under the Harmonized System (HS) code, which is defi ned by the World Customs Organization (WCO).
Although only the fi rst six digits of the HS code are common to all coun- tries, the following digits are used depending on the situation of each coun- try. In the case of Japan, three digits follow making the code nine digits.
China has 10 digits for its HS code. Therefore, comparing the trade between Japan and China, the HS code does not completely give a one-to-one cor- respondence for each commodity. However, the trade data compiled under this code system give one criterion to evaluate the commonness of the sec- tor classifi cation in the international IOT. The HS-IO converters for each country are important because they are used in defi ning the common sector classifi cation in the international IOT.
3) International freight and insurance between Japan and China
The estimation of the international freight and insurance between Japan
and China is necessary to distinguish the trade transaction in producer price
from that of the cost, insurance, and freight (CIF) base. In compiling the
2007 Japan-China International IOT, the cost of the international freight
and insurance was estimated by using some sampling data of Japanese international transportation companies. Therefore, we have to develop method that is more appropriate for estimation.
4) Waste treatment and by-products in each country’s IOT The waste treatment and by-products might diff er in each country’s IOT, so we must confirm the situation and adjust the country’s IOTs if there were some diff erences in them.
5) Re-export and re-import data in international trade statistics Re-export and re-import data in the international trade statistics cause the trade discrepancies between two countries. China’s trade includes the re-export and re-import through Hong Kong in large portion. Moreover, it includes re-import of Chinese products from Hong Kong to China. These are confusing factors when comparing the export and import between Japan and China. Therefore, we have to consider a way to exclude them from the international trade of IOT for each country.
6) Treatment of the processing trade
The re-export and re-import in China seem to have strong relations to
the processing trade system, in which a manufacturing fi rm accepts cus-
tomer’s materials abroad for processing. In Chinese IOT, only the process-
ing fees are included as product, while the materials costs are not included
as the intermediate goods. However, in developing the international IOT,
such intermediate goods should be estimated as actual international trans-
actions. In the 2007 Japan-China IOT, such intermediate transactions were
estimated. Hence, for 2012 IOT, we should address this issue more appro-
priately.
7) Other important issues
There are several issues to examine such as service trade, imputed hous- ing rent, the defi nition of the real estate, and tourism industries.
The estimation of trade in services from the data of the international balance of payments is diff erent in each country’s IOT, which we have to declare. In addition, the SNA of each country has a diff erence in terms of the defi nition of the construction activities abroad and patent fees. There- fore, we have to examine the defi nition and scope of trade in service for Japan-China IOT.
Assuming that the same service as the rented house is provide, imputed rent of owner-occupied housing in Japan’s IOT is estimated as the evaluated value using the general market price (gross rent). However, in China’s IOT, it is calculated as a cost stacked (repair and maintenance costs, administra- tive expenses, and depreciation). Because there is such a diff erence in the domestic production of the imputed rent, it is important to address or rec- oncile the diff erence.
In China’s IOT, the activity of the real estate sector is captured as fi xed capital formation. However, Japan’s IOT records it separately into two parts:
the real estate brokerage commission (real estate ownership relocation expenses) in the real estate agencies and managers sector, and the cost for land development in the construction sector. Therefore, this diff erence has to be considered in the Japan-China IOT.
In the 2007 Japan IOT, tourism is recorded as the household consumption
expenditure on the corresponding sectors such as restaurants, hotels, trans-
portation etc. However, in the 2007 China IOT tourism expenditure of
households in the tourism sector is considered bulk, and the expenditure on
restaurants and hotels, eventually borne by household is credited to the
intermediate inputs of that sector. Consequently, the domestic production
of China’s tourism sector becomes excessive compared to Japan. Therefore,
all the tourism expenses except tourism business costs are excluded from that sector, and modifi ed to be accounted as the consumption expenses in the corresponding sector in the Japanese IOT.
In the 2012 China IOT, the tourism industry is included in “other business services” and does not appear as an independent sector. Therefore, in the 2012 Japan-China IOT, we must consider the treatment of this tourism industry in China. If this sector is to be captured independently, the domes- tic production of the tourism industry should be estimated.
3.3 Three-Country Framework
In 2015, however, METI suddenly decided not to continue with the con- struction of the 2012 Japan-China IOT mainly because of its lack of human resources. Simultaneously, METI also decided not to construct the regional Japanese IOT for the same reason. That was an unexpected decision for us.
After the METI’s decision, we decided to continue with the 2012 Japan- China International IOT project from the academic base, in collaborators with SIC and NBS of China.
KIET of South Korea intended to build a similar international IOT for South Korea and was looking for collaborators. Therefore, we extended our plan to the 2012 Japan-China-South Korea IOT with the additional coop- eration of KIET. Our new plan for 2016–2017 has been begun.
3.4 Compiling Process of International IOT
The typical compiling processes of international IOT are as follows:
1) Defi ning the common sector classifi cation for the international IOT to be compiled;
2) Adjusting each country’s IOT to suit the defi nition of the common classifi cation;
3) Estimating the import tables of ordinary trade and others;
4) Estimating the cost of international freight and insurance;
5) Compiling the trade fl ow data among Japan, China, Korea, and the ROW by sector from the international trade database;
6) Compiling the import matrix, intermediate, and fi nal products in the form of international IOT, and converting the price valuation from CIF to producer’s price;
7) Estimating the export vector to ROW;
8) Estimating the tariff vector; and
9) Reconciling the sum-value of each row and column with the total product.
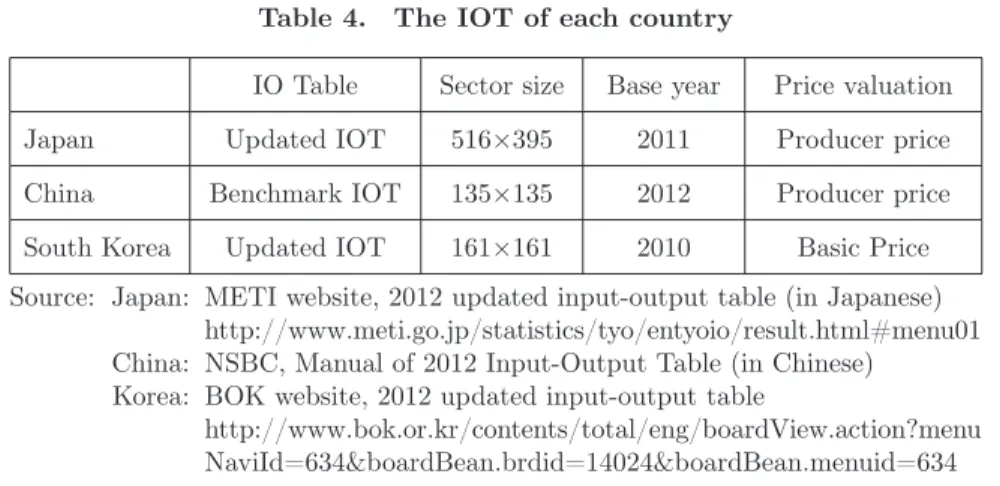
The target is 2012 Japan-China-South Korea International IOT, which is built by using the 2012 IOT for each country. Table 4 shows the IOTs of each country. For Japan, there is 516×395 updated IOT (producer price, base year 2011). China has a 135×135 benchmark table (producer price, base year 2012) and South Korea hasestimated 161×161 updated IOT (basic price, base year 2010).
Table 4. The IOT of each country
IO Table Sector size Base year Price valuation
Japan Updated IOT 516×395 2011 Producer price
China Benchmark IOT 135×135 2012 Producer price
South Korea Updated IOT 161×161 2010 Basic Price Source: Japan: METI website, 2012 updated input-output table (in Japanese) http://www.meti.go.jp/statistics/tyo/entyoio/result.html#menu01
China: NSBC, Manual of 2012 Input-Output Table (in Chinese) Korea: BOK website, 2012 updated input-output table
http://www.bok.or.kr/contents/total/eng/boardView.action?menu
NaviId=634&boardBean.brdid=14024&boardBean.menuid=634
We expect that the common sector classifi cation would have 70–150 sec- tors. For Japan-China, 70–90 sectors might be possible, whereas for Japan- Korea, a more detailed division of 100–150 sectors is expected.
Moreover, we must discuss the price valuation issue, because Japan and China’s IOTs using producer price valuation, while South Korea’s IOT is based on basic price valuation.
4. Future Plan and Remaining Issues
The ongoing research is as follows. In December 2016, we will construct the HS-IO converter, obtain the IO-ISIC converter, and fi x the common IOT classifi cation. Then, we will compile the trade matrix database among the three countries, and accordingly analyze the trade structure. In 2017, we will construct the 2012 Japan-China-Korea IOT, and analyze the inter- dependency of the economic and trade structure among the three countries.
In addition, we will analyze the eff ects of an economic partnership among them.
We expect to perform the following analyses. According to the common sector classifi cation, we will create a trade matrix focusing on Japan, China and South Korea. Using this trade matrix, we will examine and analyze the trade structure details of these three countries. Next, we will compare the published 2012 input-output tables of Japan, China, and South Korea. Then, after classifying the common sector, we will perform a comparative analysis of the national industrial structure. Connecting the trade matrix and inter- national industry input-output tables, we will compile the 2012 Korea-Japan intermediate IOT. We will also analyze the route and size of the impact of international trade among them on each domestic economy. Finally, we will empirically analyze the eff ect of an FTA using the international IOT.
The characteristics of the project we started are that, fi rstly, it involves
three countries’ cooperative activity, and secondly, it is academically based.
The goal of the project is to construct the 2012 Japan-China-Korea Inter- national IOT with more detailed sectors. This international IOT has a comparative advantage in that it is compiled after examining the defi nition of common sectors and international trade structures. Thus, it enables detailed sector analyses, although the regional coverage is limited.
【Acknowledgement】
This paper was presented at the 24
thIIOA Conference held in Seoul, Korea, July4–8, 2016. The authors are grateful for the comments and suggestion of the participants. This work was supported by Rissho University RPRA Center.
【Reference】