九州大学学術情報リポジトリ
Kyushu University Institutional Repository
レーザートムソン散乱を用いた超高周波プラズマ特 性の研究
陳, 韋廷
https://doi.org/10.15017/1398402
出版情報:Kyushu University, 2013, 博士(工学), 課程博士 バージョン:
権利関係:Fulltext available.
Study on VHF Plasma Characteristics by Laser Thomson Scattering
Weiting CHEN
Department of Applied Science for Electronics and Materials Interdisciplinary Graduate School of Engineering Sciences
Kyushu University
September, 2013
Contents
Acknowledgements Chapter 1
General Introduction
1.1 Introduction ...…….………1
1.2 Aim of this study ...………….…….………...5
1.3 Outline of the thesis ………6
References ………8
Chapter 2 VHF Plasma and Diagnostics 2.1 Overview of solar cell ………..10
2.2 Plasma diagnostic techniques ………...14
2.3 VHF plasma ………. 16
2.3.1 Electron trapping effect ………...16
2.3.2 Power absorption ……….19
2.4 Power feeding ………...19
2.5 Laser scattering ……….23
2.5.1 Laser Thomson scattering ………...23
2.5.2 Rayleigh scattering ………..29
2.5.3 Stray light ………29
2.5.4 Experimental setup of LTS system ……….32
2.6 Langmuir probe method ………...39
2.6.1 Characterization of the probe ……..………39
2.6.2 Construction of the probe ………45
2.7 Simulation ………47
2.7.1 Description of the model ……….48
References ………..51
Chapter 3 Diagnostics of VHF Argon Plasmas by Laser Thomson Scattering 3.1 Introduction ………..53
3.2 Experimental setup ………...54
3.3 Results and discussion.. ………....59
3.4 Summary ………..67
References ………..68
Chapter 4 Investigation of VHF Argon Plasma at High Pressure by Balanced Power Feeding 4.1 Introduction ………..69
4.2 Results and discussion.. ……….…...71
4.2.1 Comparison of conventional and balanced power feeding……..71 4.2.2 Comparison of results by LTS method and probe method……..79 4.2.3 Simulation………....79 4.3 Summary ………..87 References ………..88
Chapter 5 Conclusion
5.1 Summary of this study ……….89
5.2 Suggestions for the future work ………...90
Acknowledgements
This research was conducted at the Ionized Gas and Laser Research Laboratory of Kyushu University. Many people have contributed directly and indirectly to the success of my research during my stay in Japan.
First of all, I am extremely grateful to my advisor, Prof. Kiichiro Uchino for giving me the great opportunity of joining his research group, many valuable suggestions, encouragement through the course of this work, critical reading of the manuscript, and useful advices. Also I would like to express my sincere appreciation to Associate Prof.
Yukihiko Yamagata, Assistant Prof. Kentaro Tomita, and Assistant Prof. Ogiwara for their continuous guidance, active help, discussion, and encouragement during the whole investigation.
I am highly grateful to Prof. Reiji Hattori and Associate Prof. Naoji Yamamoto for serving on my thesis committee and providing constructive criticism.
Moreover, I would also like to thank Prof. Yoshinobu Kawai for his guidance and assistance in getting my graduate career. He gave me many advices on not only research but also life during my study. I would like to acknowledge Dr. Hiromu Takatsuka and Dr. Yoshiaki Takeuchi of Mitsubishi Heavy Industry for the technical support and valuable discussion during my study.
I am very grateful for the friendship of all of the members in Uchino Lab., in particular, Mr. Bolouki Nima, Mr. Koichiro Koge, Mr. Ryota Komatsu and Mr. Naoki Kimura for their technical support and discussion in this study.
Finally, I wish especially thank my parents and brother for their constant love, encouragement, understanding, and academically or financially support. This allows me to focus on the research and study. I would like to dedicate this thesis to them.
1
Chapter 1
General Introduction
1.1 Introduction
Ever since the industrial revolution, the use of fossil fuel has become indispensable in our life. The continuous emission of carbon dioxide into our atmosphere has drastically affected the earth. Results of the rising of sea level and unusual weather change have been proved to be due to global warming. Therefore, technologies with low environmental impact and zero "greenhouse gas" emissions are likely to be of increasing importance over the coming decades. Among them, solar has its advantages than others: it is free, clean, more secure, with minimal maintenance required, and produces minimal environmental impact.
Historically, crystalline silicon (c-Si) has been used as the light-absorbing semiconductor in most solar cells, even though it is a relatively poor absorber of light and requires a considerable thickness (several hundred microns) of material.
Nevertheless, it has proved convenient because it yields stable solar cells with good efficiencies (15-18%) and uses process technology developed from the huge knowledge base of microelectronics industry. The high cost of crystalline silicon wafers (they make up 40-50% of the cost of a finished module) has led the industry to look at cheaper materials to make solar cells. The selected materials are all strong light absorbers and need to be about 1 micron thickness, so materials costs must be significantly reduced.
The most common materials are amorphous silicon (a-Si), or polycrystalline materials which including microcrystalline silicon (c-Si).
2
Hydrogenated amorphous silicon (a-SiH) is usually prepared by RF discharge plasma CVD where the parallel plate type electrodes and the frequency of 13.56 MHz are conventionally used. Although in this case the increase in the deposition rate is achieved by increasing the power of the RF source, the deposition rate is at most 0.2-0.3 nm/sec. Recently, a further improvement toward faster, uniform deposition has been demanded from the industrial perspective of productivity improvements of the products.
So far, several researchers have reported the method for generating a high density plasma using frequencies higher than 13.56 MHz [1-5], i.e., the method for increasing the deposition rate by applying very high frequency (VHF) to the plasma CVD and this method has drawn attention because it can produce relatively high-quality films at a high speed. In fact, Curtins et al. [1] achieved 2 nm/sec at 70 MHz. These results were confirmed by other researchers [4-5]. However, the costs of amorphous silicon solar cell are relatively expensive compared with the crystalline silicon solar cells because of low conversion efficiency.
In order to increase the conversion efficiency, Shah et al [6] proposed a "tandem"
thin film solar cell consisting of a microcrystalline silicon solar bottom cell and an amorphous silicon top cell. Microcrystalline silicon (μc-Si:H) is an attractive low band gap absorber material for integration in thin-film solar cells [7-8]. Now the tandem thin film solar cells are very popular and the efficiency of around 11 % with the area of 1 m x 1 m was recently reported. The structure of the tandem thin film solar cell is described in Chap. 2. However, the costs of the tandem thin film solar cells are still high compared with that of the crystalline silicon solar cells. The cost of the thin film solar cells strongly depends on both the efficiency and the deposition rate. Thus, it is the most important subject in the development of silicon thin film solar cells to prepare μc-Si:H
3
with high deposition rates. Now the industry requires at least 1 nm/s as the deposition rate.
Recently, it was found [7-8] that higher deposition rate of μc-Si:H is achieved by a narrow gap discharge at high pressure, maintaining the high quality. This method is called "high pressure depletion method" and widely used. However, the mechanism has not been understood. Paschen’s law suggests that the higher the pressure becomes, the shorter the distance between the electrodes for discharge should be. As a result, discharge voltages will be greater because of larger losses of plasma to the electrodes.
As well known, the deposition rate is proportional to the electron density. Lower electron temperature is required for the fabrication of high quality thin films because the ion bombardment energy is proportional to the electron temperature. Thus, it is one of the most important subjects in the production of microcrystalline silicon solar cells to examine the characteristics of a VHF plasma at high pressure.
As already described, the plasma CVD technology using the VHF plasma provides high quality silicon thin films with a high deposition rate. However, there are few research groups to measure the characteristics of the VHF plasma at high pressure because of the difficulty of the diagnostics. Kawai et al [9] produced a VHF hydrogen plasma with a ladder shaped electrode and found that when the power source frequency is increased, the electron density ne increases and the electron temperature Te decreases:
ne~1.6 x 10 16 (m-3) and Te~2 eV at 200 MHz for 100 mTorr. In their experiments, the Langmuir probe was used to measure the plasma parameters. Yamauchi et al [10]
attempted to measure the plasma parameters of a VHF hydrogen plasma (frequency:60 MHz) with a short gap discharge (gap distance = 5-10 mm) at high pressures and showed that the electron density takes a peak value at a certain pressure and the electron
4
temperature is around 10 eV that is relatively high. Recently Nishimiya et al [11]
measured the characteristics of a VHF SiH4/H2 plasma at high pressures by a heated Langmuir probe and found out the same tendency as that of the VHF H2 plasma.
It is also one of the important subjects for the cost reduction of solar cells to produce a large area VHF plasma (> 1 m2). Takatsuka et al [12] succeeded in producing a uniform VHF SiH4/H2 plasma (frequency: 60 MHz) over 1.1 m x 1.4 m using a multi rod electrode and obtained 2.5 nm/s as the deposition rate. Schmidt et al [13] attempted the improvement of plasma uniformity using a Gaussian-lens electrode for compensating the standing wave effects for VHF plasmas in the large area reactors, where the power source frequency was up to 100 MHz. They obtained plasma uniformity of ±10 % for the argon plasma (frequency: 67.8 MHz). In this case, the uniformity was estimated from the ion saturation current of the Langmuir probe. On the other hand, there are some companies to produce a large area silicon thin film solar cells using a conventional CVD (frequency: 13.56 MHz), but their deposition rates were lower than 1 nm/s.
As already described, the characteristics of a VHF plasma have been examined with the Langmuir probe, so far. However, when the probe is inserted, the VHF plasma produced by a narrow gap discharge is seriously disturbed and may change the parameters such as the density and temperature of electrons. In addition, the probe theory is not used at high pressures because the ion mean-free path is much shorter than the sheath length [14]. Thus, it is strongly expected to develop diagnostics that do not disturb VHF discharges at high pressures. We have been trying to measure the characteristics of the VHF plasma by the laser Thomson scattering (LTS) method.
In this thesis, we have been applying LTS to various discharge plasmas. In order to
5
support the validity of the results of LTS measurements, we compared the values of the electron density and electron temperature at different plasma conditions measured by LTS and the Langmuir probe. Microcrystalline silicon is fabricated by introducing a small amount of SiH4 gas into a H2 plasma, so that the parameters of the SiH4/H2 plasma are considered to be similar to those of the H2 plasma. On the other hand, the electron density in the H2 plasma is lower than 1016 m-3, so that we have examined the characteristics of the argon plasma by LTS.
Besides the experimental study, to simulate the VHF argon plasma using the Plasma Hybrid Module (PHM) of PEGASUS software was proposed [15]. We examined the dependences of the VHF argon plasma produced by the balanced power feeding method on the applied voltage. By comparison of those results with the LTS method, we can ensure the reliability of the plasma simulation.
1.2 Aim of this study
The aim of this thesis is to study the characteristics of the VHF plasma at high pressures by LTS. First, the laser disturbance of the argon plasma is considered because it was reported [16] that the Thomson scattering signal from the xenon plasma was affected by the photo-ionization of metastable xenon atoms when LTS experiments are performed with laser power densities of > 1015 W/m2 [16]. After examining the applicability of LTS to the diagnostics of VHF argon plasmas, the values of the electron density and electron temperature measured by LTS and the Langmuir probe are compared. These results may support the validity of the results of LTS measurements.
Furthermore, the dependence of the VHF plasma parameters on the pressure and the VHF power by using the LTS method are examined, where the VHF plasma is produced by the balanced power feeding method and the conventional power feeding method.
6
Finally, the simulate of the VHF plasma using the PHM of PEGASUS software is tried. Simulation results are compared with the experimental results measured by LTS in order to confirm the reliability of the simulation.
1.3 Outline of the thesis
The thesis is divided into five chapters as briefly summarized in the following.
Chapter 1 is the introduction.
Chapter 2 includes a general introduction of the solar cell, the principle of the VHF plasma, power feeding methods, the experimental setup, and plasma diagnostic systems.
The diagnostics of the VHF plasma used in this study included the LTS method, and Langmuir probe method. Also the simulation model of the VHF plasma using the PHM of PEGASUS software is described.
Chapter 3 describes the development of the LTS method as the diagnostics of the VHF argon plasmas. The effect of the photo-ionization of metastable atoms on the Thomson scattering spectrum was examined by comparing the spectra obtained with a plano-convex lens and a cylindrical lens. By reducing the power density of the YAG laser below 1 × 10¹³ W/m2, the removal of the influence of the photo-ionization of metastable argon atoms on the Thomson scattering spectrum of the VHF argon plasma was succeeded. Therefore, these results support the validity of LTS measurements.
Chapter 4 describes the dependence of the VHF plasma parameters on the various conditions where a VHF plasma was produced by a balanced power feeding method and a conventional power feeding method. Compared with the conventional power feeding method, ne and Te by the balanced power feeding method showed the outstanding performance not only on the dependence of the pressure but also on the power. In addition, the pressure dependences of the plasma parameters at high pressure were
7
examined by LTS method and Langmuir probe method. It was found that the ne values measured by the Langmuir probe method showed the different tendency from the values measured by the LTS method at high pressure. This indicated that the Langmuir probe method was not reliable for high pressures at around 1 Torr. Besides, we simulated the VHF argon plasma using the PHM of PEGASUS software. The ne and Te values were not so much different from those measured by the LTS method. Then, it was concluded that both LTS diagnostics and the simulation can be powerful tools to study VHF plasmas.
Finally, chapter 5 includes conclusions and suggestions for future work.
8 References
[1] H. Curtins, N. Wyrsch, M. Favre and A. V. Shah, Plasma Chem. Plasma Process.
7, 267 (1987).
[2] S. Oda, J. Noda and M. Matsumura, Jpn. J. Appl. Phys. 29, 1889(1990).
[3] A. A. Howling, J.-L. Dorier , Ch. Hollenstein, U. Kroll and F. Finger, J. Vac. Sci.
& Technol. A, 10, 1080 (1992).
[4] M.Heintze, R.Zedlitz and G. H. Bauer: J. Phys.D, Appl. Phys. 26, 1781 (1993).
[5] M.Heintze and R.Zedlitz, J. Non-Cryst. Solids 198-200, 1038 (1996).
[6] A. Shah, J. Meier, E. Vallat-Sauvain, C. Droz, U. Kroll, N. Wyrsch, J. Guillet, U.
Graf, Thin Solid Films 403 –404 (2002) 179–187.
[7] M. Kondo, M. Fukawa, L. Guo and A. Matsuda, J. Non-Cryst. Solids, 266-269, 84 (2000).
[8] U. Graf, J. Meier, U. Kroll, J. Bailat, C. Droz, E. Vallat-Sauvain and A. Shah, Thin Solid Films, 427, 37 (2003).
[9] Y. Kawai, M. Yoshioka, T. Yamane, Y. Takeuchi, M. Murata, Surface & Coating Technology, 116-119, 662 (1999).
[10] Y. Yamauchi, Y. Takeuchi, H. Takatsuka, H. Yamashita, H. Muta, Y. Kawai, Contrib. Plasma Phys., 48, 326 (2008).
[11] T. Nishimiya, T. Yamane, S. Nakao, Y. Takeuchi, Y. Yamauchi, H. Takatsuka, H.
Muta, K. Uchino, Y. Kawai, Surface & Coating Technology, 205, S 411 (2011).
[12] H. Takatsuka, M. Noda, Y. Yonekura, Y. Takeuchi, Y. Yamauchi, Solar Energy, 77, 951 (2004).
[13] H. Schmidt, L. Sansonnens, A. A. Howling, Ch. Hollenstein, M. Elyaakoubi, J. P.
M. Schmitt, J. Appl. Phys., 95, 4559 (2004).
9
[14] T. E. Sheridan and J. Goree, Phys. Fluids B 3, 4, 326 (2008).
[15] PEGASUS Software Inc., http://www.psinc.co.jp/english/index.html.
[16] N. Yamamoto, K. Tomita, K. Sugita, T. Kurita, H. Nakashima, and K. Uchino, Rev.
Sci. Instrum., 83, 073106 (2012).
10
Chapter 2
VHF Plasma and Diagnostics
2.1 Overview of solar cell
Sterling and Swann [1] were the first to publish the formation of films of ”silicon from silane” in a radio frequency glow discharge in 1965. The amorphous layers showed an extremely high resistivity. In 1969, Chittick et al. [2] prepared amorphous silicon in the same manner and found that it had better photoconductive properties than that made by the traditional techniques, evaporation and sputtering. Their papers also contain the first report on the possibility of doping the material substitutionally. In the same years, also the first low temperature microcrystalline silicon layers were deposited on glass substrates by Veprek and Marecek who used hydrogen plasma and a chemical transport method at 600C in 1968. Until 1974, Lewis et al. [3] showed that the electronic defect density in amorphous germanium prepared by sputtering could be reduced by adding hydrogen to the plasma. Next year, Triska et al. [4] showed by means of an evolution experiment that also amorphous silicon deposited by glow discharge from pure silane did contain hydrogen. Thus electronic grade amorphous silicon is in fact an alloy of silicon and hydrogen, and was since then called hydrogenated amorphous silicon (a-Si:H). Compared to a-Si:H that absorbs light from 300 nm to 750 nm, c-Si:H absorbs light coming from a wider spectral range, extending up from 300 nm to 1100 nm. Furthermore, the c-Si:H solar cell is reported to be largely stable against light induced degradation [5].
Many solar cell researches have concentrated on increasing the efficiency and reducing the cost, thus making solar cells commercially viable. The solar cell efficiency
11
is defined as the ratio of the electrical output of a solar cell to the incident energy in the form of sunlight. One possibility for reducing cost significantly is the development of thin film solar cell technologies. Most photovoltaic solar technologies rely on semiconductor grade crystalline silicon wafers, which are expensive to produce compared with energy from fossil fuel source. In order to reduce high materials cost, thin film technologies are developed.
The conversion efficiency of thin film solar cell is lower than other kinds of solar cell, such as CIS, CIGS, etc. So, it is very important to research how to develop higher conversion efficiency, leading to the cost reduction of the silicon thin film solar cells.
As already describe in Chap. 1, the "tandem" thin film solar cell that Shah et al [6]
proposed is one of the promising candidates for the cost reduction of the silicon thin film solar cells. Therefore, the optical combination of these two materials takes advantage of larger part of the solar spectrum and the conversion efficiency of the incident light into electricity can be consequently improved. A combination of a- Si solar cell and c-Si solar cell is called double junction solar cell or tandem solar cell. It has been reported in some researches and references [7-8].
The typical tandem solar cell is shown in the Fig. 2.3. Compare with single junction solar cell, the top cell (amorphous silicon p-i-n) combined to the structure.
Producing a tandem cell is not an easy task, largely due to the thin properties of the materials and the difficulties putting up the current between the layers. These cells are much more difficult to produce because the electrical characteristics of each layer have to be carefully matched. In particular, the photocurrent generated in each layer needs to be matched; otherwise electrons will be absorbed between layers. In the case of those following problem, theoretically, the optical combination of these two materials takes
12
advantage absorption of larger part of the solar spectrum and the conversion efficiency of the incident light into electricity can be consequently improved.
13
Fig. 2.3 The typical tandem solar cell.
14 2.2 Plasma diagnostic techniques
The diagnostics of the plasma properties are crucial for understanding physical and chemical processes which take place in the plasma processing. Plasma diagnostics is an extensive branch of plasma science and lots of mechanisms are required to discuss it in details. There are several techniques to analyze electron properties of the plasmas. Each method has its particular advantages and disadvantages. Some of the techniques are mentioned below.
The Langmuir probe method can be used to investigate the characteristics of VHF plasmas, such as the electron density ne and the electron temperature Te, and electron energy distribution function (EEDF). A Langmuir probe is one of the most frequently used and useful diagnostic tool in plasma physics due to its simplicity of the design, fabrication and easy to move. It provides the information regarding various plasma parameters, rather than volume averaged results which are obtained by other techniques such as microwave interferometry. Details of Langmuir probe method are explained in Sec. 2.6.
Microwave interferometry is a well-established diagnostic technique which is used to measure both the time averaged and time dependent electron line density [9-11]. If a microwave signal is passed through an auxiliary reference path and nulled against that of the signal through a measurement path when a plasma is absent, the effect of striking a plasma within the measurement path is to cause a phase shift in the output signal. This phase shift is proportional to the integrated line density of electrons. Compared to the Langmuir probe, it is a non-invasive technique. The theory behind its operation is not complicated and subject to less misinterpretation. This technique measures the line average electron density and the radial and the axial distribution of the electron density
15
should be known in order to infer the localized electron density. And the information of the EEDF is not obtained from the technique.
In this thesis, we focus on the active diagnostics such as laser scattering. Laser scattering such as laser Thomson scattering (LTS) and Rayleigh scattering, can provide a substantial amount of accurate information about plasma parameters such as electron density, electron temperature, and EEDF. LTS is a very attractive technique to measure the plasma parameters and to verify results measured from other diagnostic techniques, because it is relatively non-intrusive, the interpretation of the measured results is straightforward and assumptions on the plasma parameters are in principle not necessary. Also, those parameters are obtained as local values with high spatial and temporal resolutions. We describe about LTS in Sec. 2.5.
16 2.3 VHF plasma
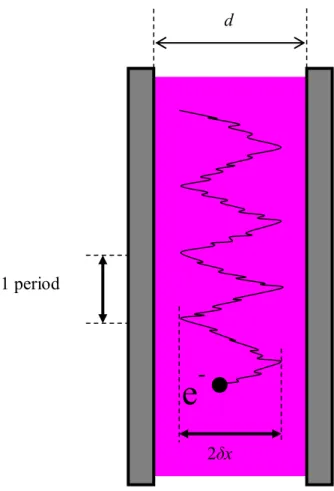
2.3.1 Electron trapping effect
A VHF plasma is a kind of non-thermal plasmas which are produced at pressures 10 Torr. In the VHF plasma, electrons are heated up to a temperature of several eV, while ions and neutral particles remain at low temperatures which are close to the temperature of the chamber wall. This non-equilibrium feature is suitable for the plasma processing. The VHF plasma is characterized by electron trapping, that is, discharge frequency should satisfy the following condition:
fpi << f < fpe (2.1) Here f is the discharge frequency, and fpi and fpe is the plasma frequency of ions and electrons, respectively. In addition, the electron displacement δx should be shorter than a spacing gap between discharge electrodes for ω<<υm [12]:
x=𝑚𝑞𝐸0
𝑒𝜔𝑣𝑚 << 𝑑2 (2.2) Here d is a spacing gap between discharge electrodes, ω and υm is the angular frequency of VHF power source and electron collision frequency, respectively, and q, me and E0 is electron charge, electron mass and the amplitude of the VHF electric field. As shown in Fig. 2.4, electron trapping effect provides better confinement of electrons and as a result the electron density becomes high. Thus, the electron density is considered to peak at a certain condition where electron trapping is most effective. The Eq. (2.2) indicates that E0 and υm are important parameters in a VHF plasma, that is, the VHF power and pressure are key parameters in the VHF plasma characteristics. When the VHF power is increased, the amplitude of the electron oscillation in the VHF electric field E0 increases and as a result the condition for electron trapping, δx << d/2, is not valid. Therefore, to
17
increase υm by increasing the pressure is required for VHF plasma discharges at high powers.
18
Fig. 2.4 Schematic diagram of electron trapping effect.
e -
1 period
2δx d
19 2.3.2 Power absorption
We can estimate the mean power density Pabs of the discharge supplied by the electric fields E0 using the diffusion-controlled model [12-13]. The mean power density absorbed by the electrons Pabs is written as follows [12-13]:
2 2
2 0 2
2
m m e
abs
m
E
P nq
(2.3)where ω and υm is the angular frequency of VHF power source and electron collision frequency, respectively. Here q, me and E0 is electron charge, electron mass and the amplitude of the electron oscillation in the VHF electric field. Although the plasma energy should be determined by solving the power balance equation, the mean power density calculated from Eq. (2.3) is considered to reflect the measured [(3/2) neκTe]. In this experiment, /2=60 MHz, m/2~ 17 GHz at 1 Torr, that is, <<m, so that Pabs
should decrease in proportional tom-1 as shown in Eq. (2.4).
m e
abs
m
E P nq
2
2 0
2 (2.4)2.4 Power feeding
In the most experiments, a coaxial cable is used to feed VHF power to the power electrode of the parallel plate electrodes, so called conventional power feeding method.
In the conventional power feeding method, one electrode is connected to the power supply through the matching box (M.B.), and another electrode is connected to the ground as shown in the Fig. 2.5. This type of a power feeding system has been applied in many studies. However, abnormal discharges happen between the power feeding cable and the chamber wall in the VHF range. To avoid such abnormal discharges, Nishimiya [14] has developed a new power feeding method, so called balanced power
20
feeding (BPF) method. As shown in Fig. 2.6, a balanced power feeding method is to use a power divider with the output of 180°, which providing two parallel Leher wires that are commercially used for TV antenna. This method shows how to feed VHF powers to the electrode by the balanced power feeding method.
Figure 2.7 and Figure 2.8 show the images of the VHF argon plasma by a conventional power feeding method and a balanced power feeding method, respectively.
As seen in Fig. 2.7, the plasma is produced not only between the electrodes but also the area around the right wall. On the other hand, the plasma is mainly produced in the region between the two electrodes when we use the balanced power feeding method.
This performance is explaining obviously of the advantage of the balanced power feeding method.
21
Fig. 2.5 Schematic of the conventional power feeding method.
Fig. 2.6 Schematic of the BPF method.
VHF M.B.
V plasma
22
Fig. 2.7 Image of the VHF argon plasma by the conventional power feeding method.
Fig. 2.8 Image of the VHF argon plasma by the balanced power feeding method.
23 2.5 Laser scattering
2.5.1 Laser Thomson scattering
LTS is the scattering of electromagnetic radiation by free charge particles. When an electromagnetic wave is incident on a charged particle, the electric and magnetic components of the wave exert a Lorentz force on the particle, setting it into motion.
Since the wave is periodic in time, so is the motion of the particle. Thus, the particle is accelerated and consequently emits electromagnetic radiation. More exactly, energy is absorbed from the incident wave by the particle and re-emitted as an electromagnetic radiation.
If we consider a linearly polarized, monochromatic, plane wave incident on a particle carrying a charge q, the electric component of the wave is written as
E⃗⃗ = e⃗ E0𝑒𝑖(𝑘∙⃗⃗⃗ 𝑟 −𝜔𝑡) (2.5) where E0 is the peak amplitude of the electric field, 𝑒 is the polarization vector, and 𝑘⃗
is the wave vector (of course, 𝑒 ∙ k⃗ = 0 ). The particle is assumed to undergo small amplitude oscillations about an equilibrium position which coincides with the origin of the coordinate system. Furthermore, the particle's velocity is assumed to remain sub-relativistic, which enables us to neglect the magnetic component of the Lorentz force. The equation of motion of the charged particle is given as
𝑓′⃗⃗⃗ = 𝑞𝐸⃗ = 𝑚𝑆 (2.6) where m is the mass of the particle. 𝑆 is its displacement from the origin. A charged particle that is accelerated radiates energy. When the particle velocity v is much smaller than the speed of light c, the radiated energy per unit time 𝐼𝑎𝑆 is given by
𝐼𝑎𝑆 = 𝑞2
6𝜋𝜀0𝑐3𝑣2 (2.7) This type of radiation from a charged particle is called Thomson scattering.
24
The electron acceleration occurs in the direction of the electric field of the incident radiation, and so the scattered light has a characteristic direction of polarization. The relationship between the incident and scattered waves is shown in Fig. 2.9, for the case of linearly polarized incident light. The angle between the incident wavevector ki, and the detected scattered wavevector ks, is called a scattering angle and denoted by . The differential cross section for Thomson scattering 𝜎(𝜆𝑖, 𝜃) is independent of the wavelength of the incident light i. The value of 𝜎(𝜆𝑖, 𝜃) for incident radiation with polarization direction is given by
σ(𝜃) = 𝑟02(1 − 𝑠𝑖𝑛2𝜃𝑐𝑜𝑠2()) (2.8) In this expression, r0 is the classical electron radius, given by
𝑟0 =4𝜋𝜀𝑒2
0𝑚𝑒𝑐2= 2.82 × 10⁻¹⁵𝑚 (2.9) The distribution of scattered radiation has an apple-shape, as shown in Fig. 2.9. One point to note is that there is no radiation in the direction of Ei.
For the case when the incident radiation is polarized, the cross section can be obtained by integrating Eq. (2.8) over and becomes
σ(𝜃) =𝑟02(1+𝑐𝑜𝑠2 2𝜃) (2.10) The total Thomson scattering cross section 𝜎𝑇ℎ is given by
𝜎𝑇ℎ = ∫ 𝜎(𝜃)𝑑Ω =83𝜋𝑟02 = 6.65 × 10⁻²⁹ 𝑚2 (2.11)
25
Fig. 2.9 The directional distribution of the Thomson scattered light intensity for the case of linearly polarized incident light with an electric field Ei.
26
As describe above, we consider the interaction of an electromagnetic wave with a plasma when the laser incident to the plasma. The wavelength of the scattered radiation reaches the detector is Doppler-shifted because the radiating charge is moving rapidly regarding to both the laser and the detector. The wavelength of the Doppler-shifted scattered light will be a function of the velocity component of the charge along the differential scattering wave vector, k, which is defined as the vector difference between the wave vector of the scattered light, ks, and the wave vector of the incident laser beams, ki, as shown in Fig. 2.9.
In the non-relativistic case, the velocity of the scattered particle can be assumed that the scattered radiation has approximately the same wavelength as the incident radiation and the absolute k value can be expressed as follow
|𝑘| = |𝑘𝑠 − 𝑘𝑖| = 2|𝑘𝑖| sin (𝜃
2) =4𝜋
𝑖 sin (𝜃
2) (2.12) The differential scattering wave vector and the Debye length, D, are the two important parameters govern the shape of the Thomson scattering spectrum, as given by the scattering parameter, , is expressed as follows
= |𝑘|1𝐷 = 𝑖
sin(𝜃2){ 𝑛𝑒𝑒2
4𝜋𝑘𝐵𝑇𝑒}
1
2 (2.13)
where i is the wavelength of the incident laser radiation. Eq. (2.13) indicates is affected by the laser wavelength, the electron temperature, the electron density, and the scattering angle. If the scattering is occurring over a distance that is smaller than the Debye length ( ≪ 1), the wave affects individual charges independently, producing incoherent scattering. Conversely, if the wavelength associated with the scattering wave vector k is comparable to or greater than the Debye length, so that 1, the incident wave interacts with the shielded charges, causing them to undergo group motion and
27
producing called coherent scattering. Two scattering regions produce very different spectra, so the value of in a particular experiment should be considered when the data are interpreted. In this study, our experimental condition meets incoherent scattering.
When Thomson scattering is in the incoherent scattering condition, the wavelength of the Doppler-shifted scattered light will be a function of the velocity component of the charge. The frequency of the scattered light, s, may differ from the frequency of the incident light because of two subsequent Doppler shifts by the scattering particle. If the particle moves at a velocity, , the wavelength of the laser light, , the incident light is scattered. The resulting frequency shift of the scattered waves us written as
= 𝜔𝑠− 𝜔𝑖 = 𝑘 ∙ (2.14) The Doppler shift of the scattered radiation, , is expressed as follows
∆= 2sin (2𝜃) ∙𝑐𝑖 (2.15) For a Maxwellian EEDF, the electron velocity distribution function is given by
f(𝑣)𝑑𝑣 = ( 𝑚𝑒
2𝜋𝑘𝐵𝑇𝑒)
1
2exp (− 𝑚𝑒𝑣2
2𝑘𝐵𝑇𝑒) 𝑑𝑣 (2.16) By using Eq. (2.15) and Eq. (2.16), the dynamic form factor for Maxwellian EEDF can written as
S(, 𝜃)𝑑() = ( 𝑚𝑒
2𝜋𝑘𝐵𝑇𝑒)
1 2( 𝑐
2𝑖sin(𝜃2)) exp {−𝑚𝑒𝑣2
2𝑘𝐵𝑇𝑒( 𝑐
2𝑖sin(𝜃2))
2
} 𝑑() (2.17) Define the half width of the spectrum
𝑇ℎ = 2𝑖sin(
𝜃 2)
𝑐 √2𝑘𝐵𝑚𝑇𝑒𝑙𝑛2
𝑒 (2.18) Using Eq. (2.18) yields Eq. (2.17) to be
S(, 𝜃)𝑑() = (ln2𝜋 )
1 2 1
𝑇ℎexp {−ln2 (
𝑇ℎ)2} 𝑑() (2.19)
28
From Eq. (2.19), the Thomson scattered spectrum is Gaussian in shape if the EEDF is Maxwellian. Th is the half width at half maximum of the Gaussian spectrum and the electron temperature related to the width is given by
𝑇𝑒 = 𝑐2𝑚𝑒
8𝑘𝐵ln2[𝑠𝑖𝑛2(𝜃2)](𝑇ℎ
𝑖 ) (2.20) The total Thomson scattering intensity is directly proportional to the electron density.
Therefore, ne can be determined from the measured spectrum if the absolute sensitivity of the detection system is accurately calibrated. In practice, this calibration is easily done by measuring the Rayleigh scattered intensity when the discharge chamber is filled with gas without a plasma. In the situation, the scattered signal intensities Ip (electron density from a plasma) and Ig (electron density from a known gas) are given by
𝐼𝑃 = 𝑛𝑒𝜎𝑇𝑃𝑓𝑠 (2.21) 𝐼𝑔 = 𝑛0𝜎𝑅𝑔𝑓𝑠 (2.22) where T and R are the differential cross sections of the Thomson scattering and Rayleigh scattering, respectively. p and g are the spectral width of the scattered spectra from the plasma and the gas, and fs is a function of the laser energy and efficiency of the detection system. The electron density is given by
𝑛𝑒 = 𝑛0𝐼𝑃𝑅𝑔
𝐼𝑔𝑇𝑃 (2.23) The spectral widths of the measured spectra are convolutions of the true scattered spectra and the instrument function of the spectrometer used to measure the spectra. However, the actual Rayleigh width is extremely small; the width of the measured gas spectrum is simply the width of the instrument function of the spectrometer.
29 2.5.2 Rayleigh scattering
The scattered spectrum which is measured from a plasma usually contains a Rayleigh scattered component, as well as the Thomson scattered component. Rayleigh scattering occurs by scattering of the laser light by electrons bound in neutral and ionic particles. When the density of neutral particles is much larger than that of ions, which is generally the case for glow discharge plasmas, a measurement of the Rayleigh scattered signal yields the density of neutral panicles in the discharge. The measurement system has to be calibrated, but this is already necessary for the Thomson scattering measurement and so does not involve an additional measurement.
2.5.3 Stray light
This is the radiation from the laser source that reaches the detector by different ways rather than scattering from the plasmas. In practice, the Thomson signal is overlapped by both the Rayleigh scattering signal and the stray light signal. Because the Thomson scattering cross section is very small, it is very important to minimize this stray light, in order to be able to measure Thomson spectra.
The stray light is conveniently expressed in terms of the pressure of gas that gives a comparable signal level due to Rayleigh scattering. The knowledge of the ratio of the Thomson to Rayleigh cross sections permits the stray light level to be expressed in terms of the number density of free electrons that would give a scattered light signal of the same intensity. This ratio is
𝜎𝑒
𝜎𝑅 = ( 𝑒4
𝑚𝑒2𝑐2) (𝜆4
4𝜋2)(𝑛−1)𝑁2 2 (2.24) where N is the number density of molecules and n is the refractive index of the gas at a pressure of 1 atom, and is the wavelength of the light undergoing scattering.
The windows through which the laser beam enters and leaves the plasma vessel
30
scatter more light than the plasma itself. It is therefore important that these windows be invisible from the detectors. To achieve this, the windows are mounted at the ends of entrance and exit tubes furnished with suitable stops and baffles. After the exit window, a light dump is arranged whose purpose is to absorb the laser beam once it has traversed the plasma. To avoid seeing stray light that undergoes several unpredictable reflections and scatterings on the walls of the plasma vessel, it is desirable that the detector should look into a black hole. For that purpose, a viewing dump, consisting of a blackened cone, is placed inside the vacuum system in a port opposite the detection window, as shown in Fig.
2.10.
The remaining stray light is discriminated from Thomson scattering by the dispersing element of the detecting system, because the stray light as well as Rayleigh scattering are distinguished from scattered by the fact that the latter two are concentrated at the laser wavelength, whereas the scattered light is Doppler-broadened.
31
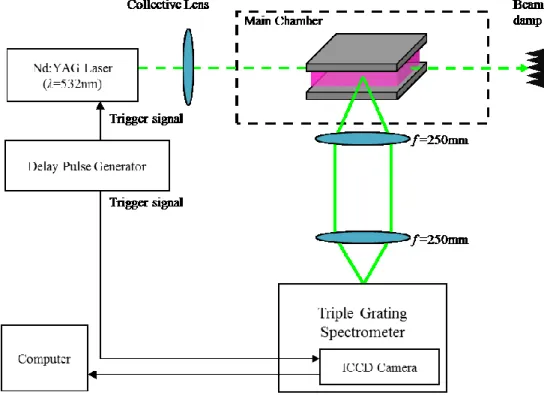
Fig. 2.10 Schematic diagram of the laser Thomson scattering system.
32 2.5.4 Experimental setup of LTS system
A schematic diagram of the LTS system is shown in Fig. 2.10. The main chamber (diameter 200 mm, length 400 mm) was specifically designed for LTS measurements.
The chamber was equipped with baffles, two Brewster windows, a beam dump, and a triple grating spectrometer (TGS). This TGS made it possible to detect the Thomson scattering spectrum at 1 nm away from the laser wavelength without the problem of stray light. Finally, the scattered light signals passing through the TGS were detected by an ICCD camera (Princeton Instruments, PI-MAX III). The quantum efficiency of the camera was ~50 % at λ= 532 nm. The photon counting method was applied to enable reliable measurements of small scattered signals.
As mentioned previously, the LTS technique was first applied to high temperature, high density fusion plasma (ne > 1019 m-3). For this kind of plasmas, one laser shot is usually used to get Thomson scattering spectrum because the number of Thomson scattered photons is large enough and there no contribution from Rayleigh scattering. If the same technique is used in lower density glow discharge plasma, such as electron cyclotron resonance (ECR) discharge, inductively coupled resonance plasma (ICP) discharge, and capacitive coupled plasma (CCP) discharge, there is a limit to the number of Thomson scattered photons which can be detected beside the presence of Rayleigh scattered photons. This limitation can be overcome some extent by accumulating data for a large number of laser shots. If this technique is applied to low density plasma (ne ~ 1015 m-3), which is applied in this study, then Thomson scattering spectrum could not be separated from Rayleigh scattering spectrum and stray light.
The main difficulties of designing an LTS system for low density plasmas are a small intensity of detected Thomson signals and the small separation of the scattered
33
spectra from a Rayleigh signal and a stray light signal.
Regarding the first difficulty of small scattered signals, the total number of photoelectrons Npe is given by
𝑁𝑝𝑒 = (𝐸ℎ𝐿) 𝑛𝑒∆𝐿𝜎𝑇(𝜃)∆ (2.25) where EL is the laser intensity, h is the Planck’s constant, is the laser frequency, ne is the electron density, L is the scattering volume, T is the Thomson scattering cross section, is the transmission of the detection system, and is the detection solid angle. If the second harmonic of a YAG laser (wavelength of 532 nm, laser energy of 300 mJ, repetition rate of 10Hz, and pulse duration of 10ns) is used and EL/h = 8.1 ×
1017 photons, L = 10 mm, T = 8 × 10-30 m2/sr, is around 0.17 due to the transmission of the gratings and lenses, = 0.08 sr (focal lens of 250 mm, diameter of 80 mm), we get Npe = 8.8 × 10⁻¹⁶ ne, which is a small number. For example, Npe = 0.2 p-e for a plasma having electron density ne = 1015 m-3.
In order to overcome the difficulty of the small LTS photons, an accumulation of the measured data for a large number of laser pulses and the using of a photon counting system are indispensable. Also, a careful design of the detection optics is required, together with increasing the scattering volume and the detection solid angle.
To overcome the other difficulty problem of the stray light, Brewster windows, the baffles, a beam dump, a viewing dump, and a triple grating spectrometer (TGS) are used.
A special TGS which was equipped with a notch filter for eliminating Rayleigh scattering and stray light, and thereby providing a dispersed LTS spectrum with Rayleigh and stray light highly suppressed. The TGS contains a narrowed entrance slit, three gratings, mirrors, and lenses. The first imaging element illuminates the grating by
34
the incident light and second imaging element is used to focus the dispersed light to the exit plane. Due to the non-idealities of the optics and the finite width of the entrance slit, the relationship between the spatial position in the exit plane and wavelength is not sharp. If a perfectly monochromatic light illuminates the entrance slit of a spectrometer, the spectrum is recorded in the exit plane has a certain width. The shape of this spectrum is called instrumental function of the spectrometer, and its half width at half maximum (HWHM) is called the instrumental half width.
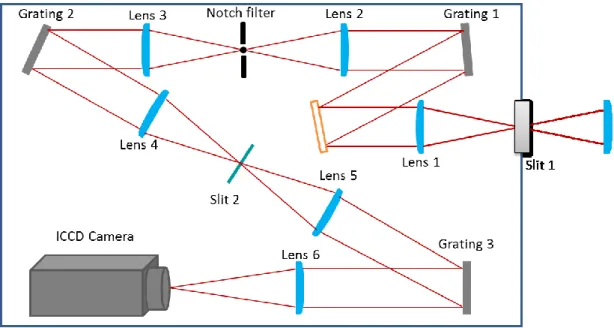
Figure 2.11 shows a schematic diagram of the TGS. It was mainly composed of three Shimazu holographic grating (Grating 1, 2, and 3) (60mm × 60mm with 1200 groves /mm, and blazed at 500 nm) and they were adjusted so that their center wavelength is 532 nm. Six anti-reflection-coated achromatic doublet lenses (Lens 1-6) having high transmission of about 99.4, were used as imaging elements. Lens 1, Lens 3, and Lens 5 were used to illuminate Grating 1, Grating 2, and Grating 3 with collimated parallel light, respectively. On the other hand, Lens 2, Lens 4, and Lens 6 were used to focus the light onto the Notch filter, the central slit (Slit 2), and the photo-cathode of the ICCD camera, respectively.
The grooves of the grating are perpendicular to the plane of the paper shown in Fig. 2.12. The light strikes the grating at an incident angle, i to the grating normal, is the diffracted angle. When defining integer m as the diffraction order and d as groove spacing, maximum constructive interference is found to occur under the condition
𝑑(sin 𝑖 ± cos 𝜃) = 𝑚 (2.26) From Eq. (2.26), it is obvious that if parallel rays carrying multiple wavelength components fall on the grating, each wavelength within the same order will have a distinctive value of determined by the grating equation. Consequently, a
35
polychromatic light is spatially dispersed. The dispersion of a grating spectrometer determines its ability to separate wavelengths. The inverse linear dispersion of a spectrometer can be found by calculating the change in wavelength with respect to change in distance x along its focal plane.
𝑥 = 𝑑 cos
𝑓𝑚 (2.27) where d, , and f are the grating groove spacing, diffraction angle, and effective system focal length, respectively.
In the spectrometer used in this study, the grating constant m = 1200 groves/mm, focal length of the first lens (Lens 1), and angles of incidence and reflection of the grating 1 are 5 and 35, respectively. The focal length of lens 2 is 250 mm, which yields, combined with the mentioned parameters, an inverse dispersion of 2.7 nm/mm from the first grating 1. The light within = 0.68 nm from the laser wavelength was blocked since the width of the Rayleigh block was 0.5 mm.
From Fig. 2.11, it can be seen that Grating 1 dispersed the incident light (Stray light, Rayleigh scattering, plasma emission, and Thomson scattering) and Lens 2 focused the dispersed spectrum onto the notch filter (0.5 mm wide vertical strip) which in turn blocked the central part of the spectrum (stray light and Rayleigh scattering).
Grating 2 recombined the rest of the spectrum (Plasma emission and Thomson scattering), which was then focused by Lens 4 onto Slit 2. Combining above optic elements with the third parts (Grating 3, Lens 5, and Lens 6) yielded dispersion of the Thomson scattering signal with a high rejection for detection by ICCD camera (Princeton Instruments, PI-MAX III).
The notch filter width determined the rejection factor; a broader width results in a higher rejection with a wider profile. Therefore, the width must be at least the same
36
width with the entrance slit (Slit 1). The stray light originated from the gratings where it scattered the Rayleigh light when it dispersed or recombined the incident light. The scattered light was suppressed by Slit 2. The instrumental half width (∆𝜆𝐼ℎ) of the TGS depends on the entrance slit width, the focal length of Lens 5 and Lens 6, and the inverse dispersion (R nm/mm) of Grating 3, where
∆𝜆𝐼ℎ= 1
4𝑆 ×𝑓6
𝑓5× 𝑅 (2.28) The TGS in this thesis is designed specific for the LTS system for measuring VHF argon plasmas, where the electron density is estimated to the order of 1016 m-3.
37
Fig. 2.11 Schematic diagram of TGS.
38
Fig. 2.12 Reflections from the grating surface.
39 2.6 Langmuir probe method
The Langmuir probe is the simplest method to measure the plasma parameters. The most extensive use of the Langmuir probe is in the industry such as silicon thin film solar cells and semiconductors, where non-thermal plasmas are used for deposition and etching. Recently there is a tendency to produce plasma at high pressures to obtain high rates of deposition and etching. These partially ionized plasmas require special techniques in probe construction and theory.
2.6.1 Characterization of the probe [15]
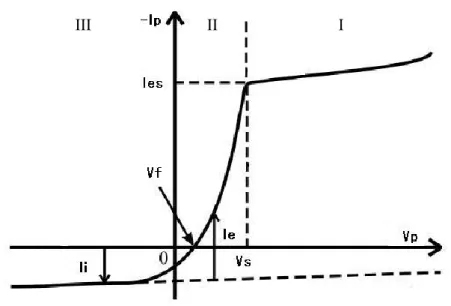
When the potential applied to the probe Vp is much larger than the space potential Vs (Vp >> Vs), an electron current Ie is collected. Here, the probe current is negative.
When Vp << Vs, an ion current Ii is collected. I-V curves are plotted as shown in Fig.
2.13.
As shown in Fig. 2.13, it can be divided into three main parts; ion saturation region (part III), transition region (part II), and electron saturation region (part I). The space potential (Vs) is near the bended point of the curve. At the part III (ion saturation region), where all the electrons are repelled, the ion saturation current (Isat) is obtained. The Floating Potential (Vf), is where the ion and electron currents are equal, and the net current is zero. In the part II, the ion current is negligible, and the electrons are partially repelled by the negative potential Vp−Vs. In a Maxwellian plasma, the current increases exponentially in this part. When Vp reaches Vs, all of the electrons is collected. In the part I, Ie grows only slowly because of the expansion of the sheath. From I - V curve, the electron density ne, electron temperature Te, and plasma potential Vs can be determined.
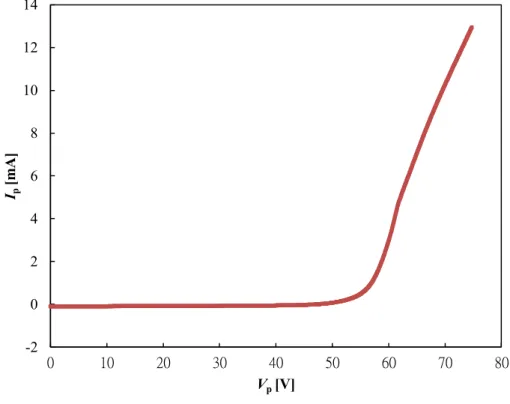
Figure 2.14 shows a typical I-V curve measured in this experiment. Argon gas was used here and the gas pressure and the VHF power were 100 mTorr and 20 W,
40
respectively. The dc bias voltage is varied from -80 V to +80 V while the DC current flowing to the probe measured. From Fig. 2.14, it can obtain much information what we introduced in above. From those, the plasma parameters, such as Te and ne can be estimated. The detailed procedure for calculating Te and ne are explained in the next paragraph.
41
Fig. 2.13 Schematic of the I-V curve obtained by the probe method.
III II I
42
Fig. 2.14 A typical I-V curve measured in this experiment.
-2 0 2 4 6 8 10 12 14
0 10 20 30 40 50 60 70 80
Ip [mA]
Vp [V]
43 I. Transition region
When the I-V curve is plotted semi-logarithmically, the exponential part should be a straight line if the electrons have a Maxwellian velocity distribution function:
𝐼𝑒 = 𝐼𝑒𝑠𝑒𝑥𝑝[𝑒(𝑉𝑝− 𝑉𝑠) 𝑘⁄ 𝐵𝑇𝑒] (2.29) where
2
1
2 4
1
m
T e S n k V
e S n
Ies e e B e
(2.30) where S being the surface area of the probe tip, kB is the Boltzmann constant, and m is the ion mass. Here, Ies is the electron saturation current, or thermal current to a surface at Vs. Eq. (2.29) shows that the slope of the (ln I) − Vp curve is exactly 1/Te and is a good measure of the electron temperature. We can obtain the electron temperature by the equation as follows.
e B e
T k
e dV
I dln
(2.31)
II. Ion saturation region
In the part III on the probe curve of Fig. 2.13, the potential is sufficiently negative with respect to the plasma potential that only ions are collected by the probe. This is ion saturation current, and the total current is
Iis eSnii 4
1 (2.32) where S is the area of the probe, ni is the ion density, and vi is the mean thermal velocity of ions that leave the plasma. Substituting the ion thermal velocity into Eq. (2.32) yields
M T e S n k Iis i B i
8 '
4
1 (2.33)
where Ti is the ion temperature in K, and M the ion mass.
44
As well known, ions do not have a Maxwell distribution. Thus, in order to obtain the ion saturation current, we have to solve the sheath equation derived from the Poisson equation. According to the sheath theory [16], the ion saturation current is expressed by
i e B P
is m
T S k en
I 0 (2.34)
Setting Eq. (2.29) and Eq. (2.34) equal yields 𝑉𝑓 = 𝑉𝑠 −𝑘𝐵𝑇𝑒
2𝑒 ln (2𝑀
𝜋𝑚) (2.35) The potential difference (Vs-Vf ) is called the wall potential that corresponds to the ion bombardment energy. The theoretical value is αp = exp (−1/2) = 0.61. We can estimate the electron density obtained from the ion saturation current by Eq. (2.36).
𝑛𝑖[m−3] = 𝑛𝑒[m−3] = 2.56 × 10¹⁷×𝐼𝑆[cm𝑖𝑠[mA]√𝑚2 𝑖[kg]
]√𝑇𝑒[eV] (2.36) III. Electron saturation region
Since the probe in electron saturation collects all electrons incident on the plasma-sheath boundary, the total electron current collected by the probe is given as
es
e e B e e
e
e I
m T S k en S
en I
I
2
1
8 4
1 4
1
(2.37) Where S is the surface area of the probe, ne is the electron density, e is the mean thermal velocity of the electrons, and me is the electron mass.
From Eq. (2.37), the electron density can be estimated from the electron saturation current.
2
1
2
e B
e es
e k T
m eS
n I (2.38)