Fertility of Immigrant Women in Japan*
An Analysis by Own-children Method based on the Micro-data from the Population Census of Japan
National Institute of Population and Social Security Research, Tokyo, Japan Yu Korekawa 1. Low Fertility of Immigrant Women in Japan
It has been pointed out that immigrant women’s fertility is higher than that of the native women in many developed countries and that such a high fertility raises a receiving country’s fertility to a certain degree, although their high fertility approaches to the level of the native women with a passage of the time since migration(e.g. Goldstein et al. 2009: 679-82, Sobotka 2008). This is because fertility of their country of origin is generally higher than that of a receiving country, and they keep that high fertility even after they settle into a host country, where native women’s s fertility is usually kept low.
Contrary to these findings, it has often been revealed that immigrant women’s fertility is lower than that of the Japanese women (e.g. Korekawa 2013, Yamauchi 2010, Kojima 2007). Actually, a fertility of many Asian countries, which are sending migrants to Japan, is generally lower than those of the South American and African countries, which are sending migrants to the U.S. and Europe, although it is still higher than that of the Japanese women. It implies that Japanese experience on immigrant women’s fertility is different from those of other developed countries.
In the backdrop of such low fertility, several studies have pointed out that a need for sending remittance to their family in their country of origin, and a large age gap between their Japanese husband reduces their fertility. However those findings are limited to those on international marriages with Japanese men, not those on immigrant couples, whose number is now increasing.
Moreover those studies are not based on any theoretical perspective to forecast a future trend of their fertility, such as a social adaptation perspective, which assesses effect from longer residency in a host country, a different trajectory depending on a marriage type they are involved, and short-term disruption effect on their fertility soon after their international migration.
Thereby, the present study aims to clarify why immigrant women’s fertility in Japan is lower than that of the native women, based on the social adaptation perspective with own-children method that is applied to the micro-data from the Japanese population census conducted in 2010. It also reveals a demographic impact of immigrants’ inflow to Japanese society, which has been under low-fertility for several decades since 1980’s and has been instead experiencing an increase of immigrant inflow.
* This paper contains results from “Comprehensive Study on Population Dynamics, Household Formation and Population Projection in Population Declining (Grants-in-Aid for Scientific Research)”. The use of the micro-data from the population census is permitted by the Statistics Bureau of Japan based on the Article 33 of the Statistics Act. The use of the micro-data from the vital statistics is permitted by the Ministry of Health, Labour and Welfare based on the Article 32 of the Statistics Act.
厚生労働科学研究費補助金政策科学総合研究事業(政策科学推進研究事業)
「人口減少期に対応した人口・世帯の動向分析と次世代将来推計システムに関する総合的研究」
平成28年度総括研究報告書(研究代表者 石井太)(2017.3)
2. Previous studies 2-1. Disruption Effect
Typical effect from international migration on fertility is disruption effect and that of interrelation of events (Milewski 2009: 21). These are explaining a sharp decline of immigrant women’s fertility due to uncertainty for future soon before/after international migration, or a rapid upsurge of fertility owing to having an approximate factor of giving a birth such as family formation, or family reunion soon after their international migration. In addition, they are known to be cohort effect rather than period one, which is hard to be analyzed by a cross-sectional analysis (Parrado 2011).
Previous studies on “a classical country of immigration” such as the United States., Canada and Australia have found disruption effect, whereas other country’s cases, for instance Swedish case shows only an upsurge of their fertility after migration. It is also revealed that any of those effects appear in approximately five years after migration. In more detail, disruption effect is stronger among higher parities than among lower parities, and effect of interrelation of events is stronger among lower parity other way around. Moreover, interrelation of events, which is also known as a
“catch-up” effect of fertility, can be seen more frequent among lower birth order (Milewski 2009:
134-6, Milewski 2010: 303, Andersson 2004: 771, Parrado 2011: 1073, Vila and Martin 2007: 373).
2-2. Social Adaptation
Above mentioned effects are short-term ones, whereas social adaptation in a host country and socialization in a country of origin are important to explain middle- to long-term effect of international migration on fertility. These are called social adaptation effect and socialization effect respectively. In this regard, social adaptation theory also assumes that immigrant women’s fertility will eventually approach to the level of native women along with economic rationality, and limitations of institutional settings of a host society. Otherwise, they keep their original high fertility under constant effect of socialization affected in their country of origin1.
Many previous researches have pointed out such a convergence to that of natives within several generations. Especially, the case of the U.S., Canada and Australia show that immigrant women’s fertility is in between that of the first generation and that of the native women, or at a level that is relatively close to that of their country of origin (Mileswki 2010: 300). On the other hand, European cases emphasize the importance of “mode of incorporation” (Portes and Zhou 1993), depending on into which country a migrant will settle. For instance, Andersson (2004: 770) found that fertility of immigrant women in Sweden converges to the level of the natives in 5 years after migration, partially owing to Swedish social settings for child rearing.
2-3. Selection/Compositional Effect
Finally, selection and compositional effects are known to explain a gap of aggregated fertility between immigrant and the native women by their compositional difference of socio-economic characteristics. Selection effect focuses on selection of migrant in their country of origin, arguing that a person who migrates tends to already have a life style of a developed society even before
migration, and have lower fertility than other people in their country of origin. Whereas, a theory focusing on compositional difference of socio-economic characteristics assesses that immigrant women’s lower socio-economic status on average reduces their fertility to lower level than that of native women (Milewski 2009: 28-32).
2-4. Previous Studies in Japan
In Japan, there are a few studies on immigrant women’s fertility. For instance, Mori (2001) and Lee (1998) estimates aggregated immigrant women’s fertility in Japan. Kim (1971) and Kim (1977) analyzed a trend of fertility of ethnic-Korean women in Japan after 1945. Imai (2011), Katsuno &
Hayashi (1990), Kojima (2007), and Hara (1994, 96) focused on fertility of spouses of the Japanese men. Yamauchi (2010) also compared immigrant women’s fertility in Japan and those in European countries based on child-women-ratio-analysis. Finally, Korekawa (2013) clarified the relationship between aggregated immigrant women’s fertility in Japan and the change of immigrants’ visa composition.
These studies found that 1) an immigrant women’s fertility differs depending on their country of origin, 2) the their contribution to total birth in Japan is becoming larger (Lee 1998), 3) compared to the immigrant women in Europe, immigrant women’s fertility in Japan is lower, mainly due to low fertility among married immigrant women (Yamauchi 2010), 4) there is a close relationship between number of the international couples and number of children born to those couples (Katsuno
& Hayashi 1990, Hara et al. 1994, 1996), 5) fertility of international couples is lower than that of Japanese couples (Kojima 2007, Imai 2011), 6) fertility of ethnic-Korean is close to the that of Japanese women (Kim 1971, Kim 1977), 7) immigrant women’s fertility differs greatly even among different immigrant sub-groups, and there is possibility of its rising with a passage of time since migration (Korekawa 2013a, b).
3. Hypothesis and Research Questions
In light of these studies, the present study assumes hypotheses below. Firstly, based on the social adaptation theory, immigrant women’s fertility will converge to the level of Japanese women with longer residency in Japan. Otherwise, there are two possibilities, the first one is that immigrant women will keep their high fertility which is socialized in their country of origin, or their fertility will be reduced, due to constant disruption effect without enough social adaptation effect. In addition, we have to be cautious to effect from interrelation of events, which can raise their fertility rapidly soon after migration
Source: made by author Figure 1 Concept on Immigrant Women’s Fertility
To prove these hypotheses, the present study sets these four research questions to answer. The first question is whether aggregated fertility of immigrant women in Japan is higher than that of natives, as is the case in other developed countries. Secondly, is there effect from interrelation of events soon after migration, and how large it is. Thirdly, to prove effect of social adaptation, the present study examines difference of fertility between immigrant and Japanese women by each couple type separately, and asks whether the gap decreases with passage of time since migration.
Finally, socialization effect is examined by comparing estimated fertility of immigrant and Japanese women.
4. Data and Methods
4-1. Utilization of Micro-Data of the Japanese Population Census
To examine immigrant women’s fertility, it is desirable to use panel-data such as German Socio-Economic Panel (GSOEP) (Milewski 2009: 69-70), although it takes time to generate such longitudinal data, and it is particularly hard for new destination countries such as Japan.
Then, the present study utilizes the micro-data from the Japanese population census2, because it includes basic information to examine abovementioned hypotheses and research questions. The cases are limited to foreign citizens, and 10% of total Japanese citizens in general households. The present study also supplementary uses the micro-data from the vital statistics, because the population census does not include some important information such as a number of children ever born, and duration of marriage and so on.
The study also focuses on major and important new-comer immigrant groups, such as Chinese, Philippine, Thai, and Brazilian women, who are aged 15-49 years old at the time of their giving a birth. Chinese women are typical high skilled labor immigrants who form their family within the
-5 -4 -3 -2 -1 0 1 2 3 4 5 6 7 8 9 10
Fertility
Time Elapsed from Migration (year) disruption
effect(-)
Interrelation of Events
Assimilation Effect(+/-)
Fertility in the C/O
Fertility of Natives Compositional
Effects
(+/-)
same ethnic group. Philippine and Thai women are typical marriage migrants as spouses of Japanese men. Brazilian women are mainly Japanese Brazilians, so called return migrants, who migrate to Japan with other family members, and who are employed as unskilled manufacturing workers.
4-2. Own-Children Method
The study utilizes own-children method (Grabil and Cho 1965, Cho et al. 1986), because it is the best way other than a life-course approach with panel-data. This method regards each record of micro-data from the population census as a delayed vital registration, and reproduces individual’s past fertility history for up to last 10 years. It also reproduces an age specific and total fertility rate in the past. In this regards, many previous researches focus on fertilities of last 4 years or so, in terms of credibility of the estimation. In particular, a number of cohabitating 0-year-old children indicates fertility of the past 1 year (Vila and Martin 2007, Stephen and Bean 1992, Dubuc 2009, Goldstein and Goldstein 1981, Ford 1990).
In more detail, the present study utilizes the following methods to specify own-children, based on the studies of East West Center of Hawaii University, and the actual application of this method to the Japanese population census (Nihon Tokei Kyokai 1990). It specifies own-children based on information on a relationship to a household head and age difference between them. Prospective own-children should be 0 to 4 years old, and their relationships to a household head should be either a child, a ground-child, a sibling, other relative, other household member of a household head, or a household head him/herself. A mother is also specified by the same way. As a result, almost all mother-child relationships are specified, and a few own-children are specified by number of potential own-children dividing by a number of potential mothers, if there are more than 2 potential mothers in the same household.
By those specified mother-child relationship, the study further estimates mid-year population of mothers and number of live-births in that year3, to respectively calculates age specific fertility rate and total fertility rate.
4-3. Interrelation of Events
The study also compares TFRs in the past 1 year (TFR0)and that in the past 2-4years (TFR1-4) based on the estimated TFRs4. In more detail, combined with information of residence place in 5 years ago, TFR0 indicates fertility between 0.5-1.5 years since migration, and TFR1-4 indicates that between -3.5 to 0.5 years since migration5. Then, we can compute a TFR ratio by this formula below to show a change of fertility across migration (Goldstein and Goldstein 1981)6.
, ,/ ,
,: Ratio of TFRs in the past 5 years
,: TFR of nationality i in average duration or residency from 0.5 to 1.5 years
,: TFR of nationality i in average duration or residency from -3.5 to 0.5 years 4-4. Multivariate Analysis
In addition to it, the study estimates difference of individual women’s fertility depending on their marriage type, duration of residency and so on, by a multivariate analysis below.
∙
∙ ⋯ 1
: Probability of giving a birth in the past 1 year : Constant term
: Dummy variable of being a foreign citizen : Dummy variable of being married
: Dummy variable of being a spouse of a Japanese man (only for immigrant women) : Dummy variable for longer than 5 years of residency in Japan (only for immigrant women) : Control variables (age, age-squared, a cross-term with being a foreign citizen and age-squared, marital status, school enrollment, age difference from their husband and its squared, husband’s educational attainment, residing prefecture, population density, population size of residing municipality)
Dependent variable is probit-transformed probability of giving a birth in the past 1 year. The present study assumes that women intend to give an appropriate number of births in their lifetime7, thus explanatory variables showing difference of fertility between immigrant and Japanese women represent difference of lifetime fertility.
is a dummy variable of being foreign citizen, which is separately set for Chinese, Phillipine, Thai, and Brazilian women, and a reference case is Japanese woman. is a dummy variable of being married, whose reference case is single at the time of survey. is a dummy variable of being an immigrant spouse of a Japanese man, whose reference case is an immigrant spouse of an immigrant man. is a dummy variable for being an immigrant who has lived in Japan for longer than 5 years, whose reference case is an immigrant who has stayed in Japan for shorter than 5 years.
To sum up, the model consists of effects of being a foreign citizen, and its cross-term with marital status, and marriage type (homogamy/heterogamy), in other words, it aims to estimate difference of fertility among married women, depending on their type of marriage, and crossed-terms between those marital statuses and duration residency further indicate size of social adaptation effect.
Finally, X’ is vector of control variables consisting of age, squared age, a crossed-term between foreign citizenship and squared age8, marital status, husband’s educational attainment9, residing prefecture, population density, residing municipality, and school enrolment10.
5. Immigrant Women in Japan
The number of immigrant women in Japan has increased since 1990’s to the early 2000’s, many
of whom came from Asian countries as marriage migrants. Some of them came to Japan via recruiting company for foreign brides, and were sent to rural areas where a number of young women was decreasing. Some other immigrant women came to Japan as entertainers, many of whom were working in a sex industry and met and got married to Japanese men afterward (e.g. Takeda 2011).
These episodes mean that acceptance of immigrant women into Japan began in the form of globalization of reproductive work as Sassen pointed out (Sassen 1988).
Indeed, a number of international marriages between immigrant and Japanese men increased in 1990’s to early 2000’s, when such migratory process had been a major migratory process in those days. In particular, Chinese, Philippine, and Thai women have been occupying around 70% of total foreign brides so far. However it has decreased since 2006 due to tightening of issuance of partner visa (Takeda 2011, Fujimoto 2013).
Source: Ministry of Health, Labour, and Welfare (2015) Figure 2 A Number of International Marriages between Japanese men and Immigrant Women
In more detail, there are also differences of migratory processes even among immigrant women.
For instance, a marriage rate of immigrant women are generally higher than that of the Japanese women, although they are classified into several patterns depending on marriage rates and international marriage rates; there are a combination of a low marriage rate and a low international marriage rate (Chinese women), that of a high marriage rate and a low international marriage rate (Brazilian women), and that of both a high marriage and an international marriage rate (Thai and Filipina women), reflecting different migratory processes of those immigrant women.
For instance, many Chinese women are coming to Japan as international students at the beginning, and meet and get married to an immigrant/Japanese man afterwards, and Filipina and
0 5,000 10,000 15,000 20,000 25,000 30,000 35,000 40,000
1965 1971 1973 1975 1977 1979 1981 1983 1985 1987 1989 1991 1993 1995 1997 1999 2001 2003 2005 2007 2009 2011 2013
A Number of Cases / Yeary
Year Husband-JP, Wife- Immigrant Wife-
Chinese/Philippine/Thai
Thai women are coming to Japan as a foreign bride from the beginning. Brazilian women are mostly Japanese Brazilians, who come to Japan with other family members, which is exemplified in high marriage rate and low international marriage rate.
Table 1 Marriage Rates of Women aged 15-49 Years Old and the Proportions of Spouses of Japanese Men among Married Women in 2010
Marriage Rate
The Proportions of Spouses of Japanese Men among Married
Women
Chinese 56.3% 57.7%
Philippine 78.7% 89.3%
Thai 76.1% 93.3%
Brazilian 66.1% 11.6%
Japanese 50.9% -
Source: tabulated from the population census of Japan
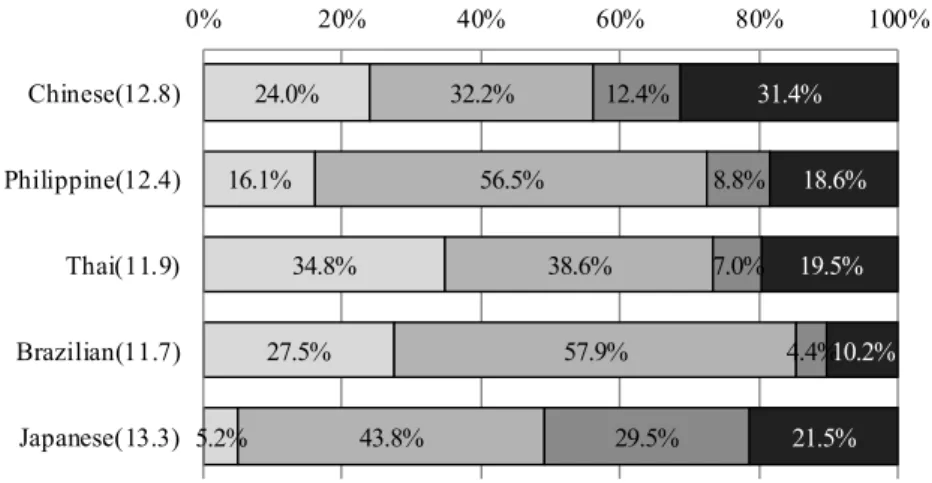
Moreover, distribution of immigrant women’s educational attainment show that on average they are less educated than Japanese women, and immigrant women’s educational attainments are polarized into low and high strata. For instance, 31.4% of Chinese women have a higher than B.A.
degree, which is larger proportion than that of Japanese women. Other immigrant women show smaller proportion of B.A. holder than that of Japanese women. On the other hand, people holding lower than a junior high school diploma, which is 5.2% among Japanese women but 16 to 35%
among immigrant women, show that many immigrant women are very low-educated. Further, in terms of education in years, Japanese women show 13.3 years in education on average, yet it is 12.8 years for Chinese women, 12.4 years for Philippine women, 11.9 years for Thai women and 11.7 years for Brazilian women, all of which are shorter than that of the Japanese women.
Source: tabulated from the population census of Japanc Note: Figures in the blankets next to nationality means average year of education
Figure 3 The Composition of Educational Attainments of Women Aged 15-49 Years Old by Nationalities
6. Immigrant Women’s Fertility
6-1. Estimations by Own-Children Method
Total fertility rates estimated by own-children method are 1.31 for Japanese women11, 0.87 for Chinese women, 1.46 for Philippine women, 1.04 for Thai women, and 1.27 for Brazilian women, and only Philippine women show a higher TFR than that of Japanese women. Amongst them, Chinese women’s TFR is so low, showing only lower than 1, despite the fact that TFRs of their country of origin is 1.7. In this regard, other TFRs of immigrant women are also lower than those in their country of origin; for instance it is 3.2 for Philippine women, 1.4 for Thai women, and 1.8 for Brazilian women. These findings reveal that immigrant women’s fertilities are lower than those in their country of origins, as has been revealed in the previous studies.
Table 2 TFRs Estimated by the Own-Children Method (2010) TFRs in Japan TFRs in a Country of Origin
Chinese 0.87 1.7
Philippine 1.46 3.2
Thai 1.04 1.4
Brazilian 1.27 1.8
Japanese 1.31 -
Source: tabulated from the population census of Japan
Age specific fertility rates show that Philippine and Brazilian women experience higher fertility in their teen and early 20’s, which is a main driver of their high fertility in Japan. Whereas, fertilities of Chinese and Thai women peak around 30 years old, and their fertility on average lower than that
24.0%
16.1%
34.8%
27.5%
5.2%
32.2%
56.5%
38.6%
57.9%
43.8%
12.4%
8.8%
7.0%
4.4%
29.5%
31.4%
18.6%
19.5%
10.2%
21.5%
0% 20% 40% 60% 80% 100%
Chinese(12.8) Philippine(12.4) Thai(11.9) Brazilian(11.7) Japanese(13.3)
less than junior high school high school junior college university
of Japanese women for whole age categories.
To sum up, we can articulate that aggregated TFRs are lower than that of Japanese women, as has not been revealed in the U.S. and European studies.
Source: tabulated from the population census of Japan Figure 4 Age Specific Fertility Rate by Nationality (2010)
6-2. Analysis on Interrelation of Events
Yet, above mentioned aggregated TFRs compound a change of fertility due to international migration, thus it is not appropriate to compare them with TFR of Japanese women directly. Then, we are going to examine effect of interrelation of events below.
The present study looks into ,, which is a ratio of TFR of nationality i whose average duration or residency from 0.5 to 1.5 years ( , ) to TFR of nationality i whose average duration or residency from -3.5 to 0.5 years ( ,).
0.00 0.02 0.04 0.06 0.08 0.10 0.12
15 17 19 21 23 25 27 29 31 33 35 37 39 41 43 45 47 49
ASFR
Age of Mother
Chinese Japanese Philippine
Thai Brazilian
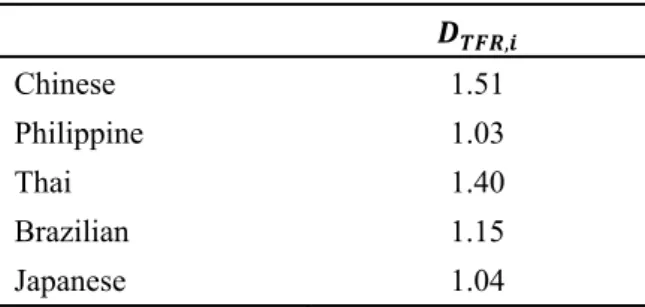
Table 3 TFR Ratio in the Last 5 Years (2010, shorter than 5 years of residency)
,
Chinese 1.51
Philippine 1.03
Thai 1.40
Brazilian 1.15
Japanese 1.04
Source: tabulated from the population census of Japan
As a result, this ratio is 1.51 for Chinese women, 1.40 for Thai women, and 1.15 for Brazilian women, all of which are much higher than one, indicating that they have experienced an upsurge of fertility, possibly owing to effect of interrelation of events soon after their migration. Only Philippine women showed 1.03, which is only slightly higher one, but their ratio is relatively higher than that after five years since migration, which is 0.76 (in Table 4), implying that they are experiencing effect of interrelation of events earlier than the last one year.
Next question is whether such upsurge of fertility soon after migration is only seen during that short period. To answer to this question, we are going to check these three questions. The first one is, is it also seen after a passage of time since migration? The second, is it just a one-shot event only around 2010? The third, is it also seen even among Japanese women?
The present study checked these TFR ratios between short-term and long-term stayers in 2010, and found that such an upsurge is only confirmed among short-term stayers, implying that it is due to catch-up effect soon after migration.
Table 4 TFR Ratio in the Last 5 Years (2010, longer than 5 years of residency)
,
Chinese 0.97
Philippine 0.76
Thai 0.85
Brazilian 0.87
Source: tabulated from the population census of Japan
The next point we should check is whether this upsurge is not only limited to immigrant women, but also to Japanese women. Regarding this point, the TFR ratio of Japanese women is just 1.04, implying that they have not experienced such an upsurge during the same period.
Thirdly, we should check whether this phenomenon is only seen around 2010. Then, the present study found that the ratios of 2000 were 1.81 for Chinese women, 1.55 for Philippine women, 1.24 for Thai women, and 1.45 for Brazilian women, any of which are much higher than one, meaning
that these upsurges are not limited to 2010 cohort, but an universal phenomenon confirmed among immigrant women soon after migration.
Table 5 TFR Ratio in the Last 5 Years (2000, shorter than 5 years of residency)
,
Chinese 1.81
Philippine 1.55
Thai 1.24
Brazilian 1.45
Source: tabulated from the population census of Japan
To conclude, immigrant women experience an upsurge of fertility soon after migration, which will decreased with a passage of time.
6-2. Determinants of Immigrant Women’s Fertility
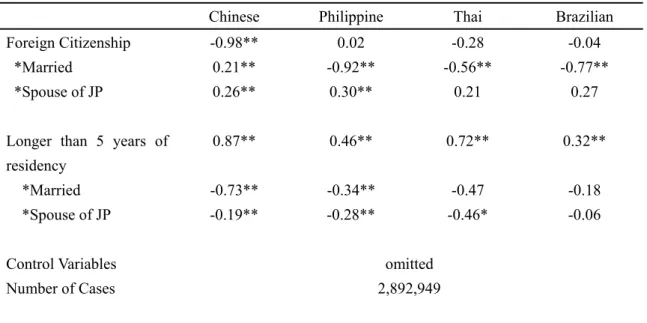
Table 6 Results on Multivariate Analysis
Chinese Philippine Thai Brazilian
Foreign Citizenship -0.98** 0.02 -0.28 -0.04
*Married 0.21** -0.92** -0.56** -0.77**
*Spouse of JP 0.26** 0.30** 0.21 0.27
Longer than 5 years of residency
0.87** 0.46** 0.72** 0.32**
*Married -0.73** -0.34** -0.47 -0.18
*Spouse of JP -0.19** -0.28** -0.46* -0.06
Control Variables omitted
Number of Cases 2,892,949
Source: estimated by author
Results of multivariate analysis showed determinants of immigrant women’s fertility. Firstly, results on foreign citizenship revealed that only Chinese women showed a negative value, and other immigrant women showed a statistically insignificant result, indicating that only Chinese women, whose fertility in their country of origin is 1.7 have lower fertility than Japanese women on average, and other immigrant women’s fertilities cannot be summarized into a single mean. These findings also clarified that there is no uniform socialization effect on their fertility.
A coefficient of being married is 1.72 (omitted in the table 6), but its crossed-terms with foreign citizenship are 0.21 for Chinese women, -0.92 for Philippine women, -0.56 for Thai women, and -0.77 for Brazilian women, indicating that their fertility gap between married and unmarried women tends to be smaller among immigrant women than Japanese women, although married immigrant women have higher fertility than unmarried immigrant women. Yet, this does not mean there are many out-of-wedlock births among immigrant women, because this is partially due to very low fertility of unmarried Japanese women, not due to high fertility of unmarried immigrant women.
Regarding a marriage type, results on having a Japanese husband showed a statistically significant positive effect on their fertility among Chinese and Philippine women, whereas Thai and Brazilian women do not show any fertility difference between a spouse of a Japanese and that of immigrant man.
Results on duration of residency showed 0.90 for Chinese women, 0.44 for Philippine women, 0.66 for Thai women, and 0.30 for Brazilian women, indicating that longer duration of residency raise their fertility, as the social adaptation theory assumes.
In more detail, results on duration of residency are more varied depending on their marriage types. For instance, married Chinese and Philippine women have smaller effect of longer duration of residency, being compared to unmarried women. Moreover, additional effect of being a spouse of a Japanese man are -0.19 for Chinese women, -0.28 for Philippine women, and -0.46 for Thai women, implying that being a spouse of a Japanese man further reduces effect of longer duration of residency.
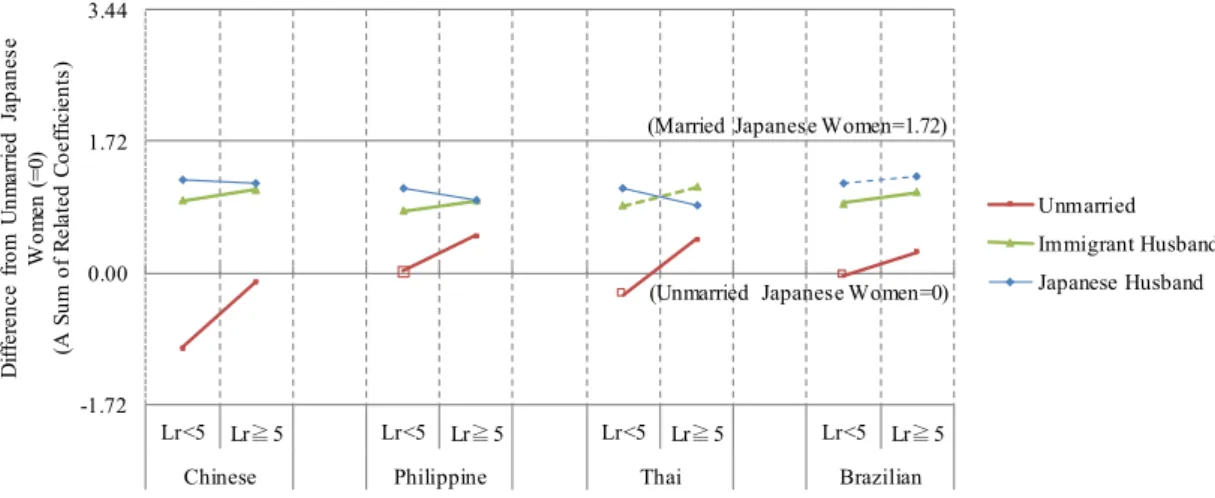
To make these results simpler, the present study also aggregated those above mentioned results and showed model fertility of each category of immigrant, being compared to that of Japanese women. According to the results, except Chinese women, we found that there is no statistical difference of fertility between immigrant and Japanese women among unmarried women, and also found that their fertility will rise higher than that of Japanese women with passage of time.
However, married immigrant women, who are supposed to be a main driver of giving births, showed lower level of fertility than that of Japanese women, even after longer duration of residency.
In particular, a spouse of an immigrant man showed lower fertility than that of a spouse of a Japanese man, regardless of their duration of residency12. Moreover, except among Brazilian women, fertility of a spouse of a Japanese man even decreased after longer duration of residency, contradicting to the fact assumed by the social adaptation theory. Their lowness of fertility is emphasized by these trial estimations showing that immigrant women’s fertility is kept lower than that of Japanese women, even though effect of social adaptation is doubled (Figure 6).
Source: estimated by author Note 1: A sum of related coefficients, which are statistically significant.
Note 2: A white marker and a dotted line indicates a result that is statistically insignificant in comparison with a reference category.
Figure 5 A Difference of Fertility between Immigrant and Japanese Women
Source: estimated by author Note 1: A sum of related coefficients, which are statistically significant.
Note 2: A white marker and a dotted line indicates a result that is statistically insignificant in comparison with a reference category.
Figure 6 A Difference of Fertility between Immigrant and Japanese Women (in the case of doubled social adaptation effect)
6-3. Simulated TFRs of Immigrant Women
The present study also implemented a micro simulation based on the multivariate analysis. The simulation basically assumes distributions of all the covariate in the model are the same as those of Japanese cases in the sample, except covariates which are relevant to being an immigrant. There are
-1.72 0.00 1.72 3.44
Lr<5 Lr≧5 Lr<5 Lr≧5 Lr<5 Lr≧5 Lr<5 Lr≧5
Chinese Philippine Thai Brazilian
Difference from Unmarried Japanese Women (=0) (A Sum of Related Coefficients)
Unmarried Immigrant Husband Japanese Husband (Married Japanese Women=1.72)
(Unmarried Japanese Women=0)
-1.72 0.00 1.72 3.44
Lr<5 Lr≧5 Lr<5 Lr≧5 Lr<5 Lr≧5 Lr<5 Lr≧5
Chinese Philippine Thai Brazilian
Difference from Unmarried Japanese Women (=0) (A Sum of Related Coefficients)
Unmarried Immigrant Husband Japanese Husband (Married Japanese Women=1.72)
(Unmarried Japanese Women=0)
four scenarios: the first one assumes all marriages are within immigrants (homogamy) and their duration of residency is shorter than 5 years. The second one assumes all marriages are between immigrant women and Japanese men (heterogamay), and their duration of residency is also shorter than 5 years. Thirdly, all marriages are supposed to be within immigrant women and men (homogamy) and their duration of residency is longer than 5 years. Finally the fourth one assumes all marriages are between immigrant women and Japanese men (heterogamy), and their duration of residency is longer than 5 years.
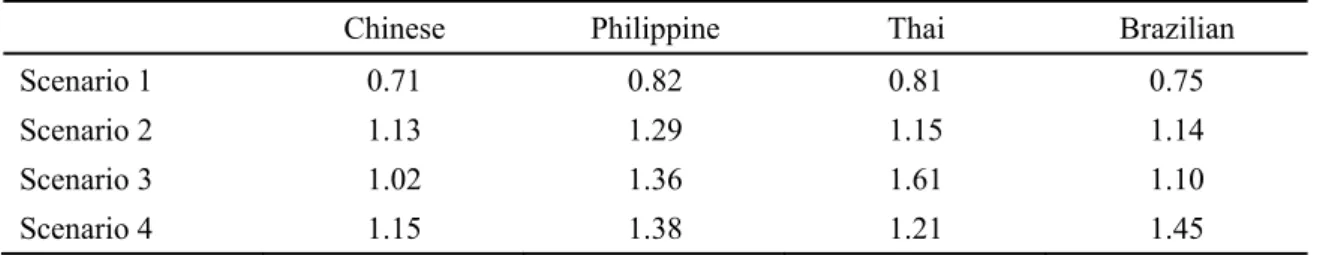
As a result, all the results in the case of shorter duration of residency showed lower TFRs than that of Japanese women However, Philippine women in scenario 3, and 4 showed 1.36 and 1.38, Thai women in scenario 3 showed 1.61, and Brazilian women in scenario 4 showed 1.45 respectively, which are higher than that of Japanese women, 1.37, reflecting their younger age pattern of high fertility.
Table 7 Definitions of Scenarios
Nationality Marriage Type Duration of Residency Scenario 1
Chinese/Philippine /Thai/Brazil
Homogamy Longer than 5 years
Scenario 2 Heterogamy Shorter than 5 years
Scenario 3 Homogamy Longer than 5 years
Scenario 4 Heterogamy Shorter than 5 years
Note: distribution of marriage age is the same as that of Japanese women.
Source: made by author
Table 8 Estimated TFRs
Chinese Philippine Thai Brazilian
Scenario 1 0.71 0.82 0.81 0.75
Scenario 2 1.13 1.29 1.15 1.14
Scenario 3 1.02 1.36 1.61 1.10
Scenario 4 1.15 1.38 1.21 1.45
Note: the estimated TFR for Japanese women is 1.37.
Source: estimated by author
To sum up, we can conclude that immigrant women’s fertilities are generally lower than that of Japanese women, even after separating several effects stemming from their ethnicity, and being an immigrant.
Note: “SCN” is an abbreviation of scenario.
Source: estimated by author Figure 7 Estimated TFRs by Nationality
7. Discussions: Backgrounds of Their Low Fertility
The present study concludes that immigrant women’s fertility is generally lower than that of Japanese women. Young unmarried immigrant women only show slightly higher fertility, which although is just a reflection of low level of out of wedlock births among Japanese women, in other word, which does not necessarily mean high fertility among young immigrant women.
On the other hand, low fertility among married immigrant women is mostly due to insufficient social adaptation effect despite their longer duration of residency. The question is why their fertility does not rise even after longer duration of residency.
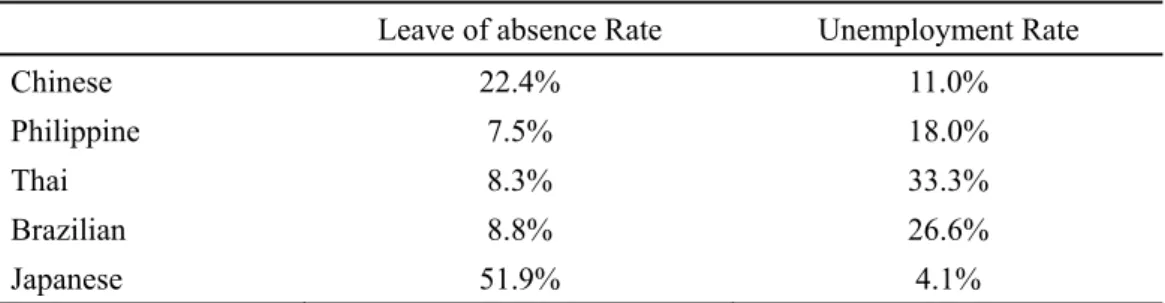
The fist possible answer to the question is a severe environment of child rearing for immigrant women. For instance, a utilization rate of leave of absence among married women with a 0-year-old baby in the labor force indicates that 51.9% of Japanese women are on leave of absence13, but only 22.4% of Chinese women who are married to immigrant men, 7.5% of Philippine women, 8.3% of Thai women, and 8.8% of Brazilian women are on the leave. Whereas, unemployment rates of these women showed that 4.1% of Japanese women are unemployed, but 11.0% of Chinese women, 18.0%
of Philippine women, 33.3% of Thai women, and 26.6% of Brazilian women are unemployed, which seem to compensate low utilization rates of leave of absence with a little baby. Further, these low utilization rates are partially due to their unstable employment status which does not necessarily fully guarantee such benefits14. To sum up, these findings revealed that immigrant couples are facing
0.00 0.02 0.04 0.06 0.08 0.10 0.12
15 17 19 21 23 25 27 29 31 33 35 37 39 41 43 45 47 49
ASFR
Age
Japanese Philippine (SCN3) Philippine (SCN4) Thai (SCN3) Brazilian(SCN4)
a severe environment to have and raise babies in Japan15, which causes their low fertility.
Table 9 Leave of Absence and Unemployment Rate of Women Who has at least One Younger than 1-Year-Old Baby
Leave of absence Rate Unemployment Rate
Chinese 22.4% 11.0%
Philippine 7.5% 18.0%
Thai 8.3% 33.3%
Brazilian 8.8% 26.6%
Japanese 51.9% 4.1%
Note: Leave of absence rate is to all the women in the labor force
Source: tabulated from the population census of Japan
Next question is why fertility of immigrant women who are married to Japanese men is lower than that of Japanese women. A possible answer to this question is their negative effect of longer duration of residency. Indeed, in previous studies of other countries instability of an international couple is pointed out as one of the reasons of low fertility of immigrant women (Yang and Schoonheim 2010: 121, Kim 2008, Maffiolii et al. 2012, Kim et al. 2008)16. This may be also true of Japanese case.
To prove this instability hypothesis, the present study estimated divorce rates for immigrant women by using the micro data from the vital statistics with the same method as that of Raymo, Iwasawa and Bunpass (2005), and found that contrary to that 22.4% of Japanese couples are to be divorced in 18 years after their marriage, 39.4% of Chinese women who are married to Japanese men are to be divorced in 18 years, 44.2% of Philippine women, 33.2% of Thai women who both are married to Japanese men are to be divorced in 18 years from their marriage. Brazilian women who are married to Japanese men only show almost the same level of divorce rate, partially reflecting the fact that their Japanese husbands might be naturalized Japanese Brazilian men.
Anyway, other than Brazilian women, immigrant women’s accumulated divorce rates are so high, especially during first five years, that this implies that their marriage relationship would be unstable in 5 years after their marriage. Moreover, relatively low divorce rate of Brazilian women who are married to Japanese men explains why they do not show negative effect of longer duration of residency.
Source: tabulated from the micro-data of the vital statistics Figure 8 Hazard Rate for Divorce by Couple Types
To conclude, immigrant women’s fertility is generally lower than that of Japanese women partially due to disruption effect caused by international migration in short term, and their fertility is in the course of recovery promoted by social adaptation effect to Japanese society in the middle term, which although is insufficient to attain its original level, except among young unmarried immigrant women. A main reason of their low fertility even after longer duration of residency is a severe social environment for child rearing in Japanese society, and an unstable marriage relationship among international couples.
Further, these finding revealed that social adaptation theory is not applicable to the Japanese case, due to insufficient adaptation effect among immigrant women. It means that additional inflow of immigrant women into Japanese society will not necessarily raise its fertility, moreover it will possibly decrease it in other way around, as are not cases of other developed countries.
1 Minority effect (Goldscheider and Uhlenberg 1969) is also effect that is seen on average among immigrant groups. This effect indicates that immigrants are experiencing decline of fertility due to social pressure and uncertainty as being minorities. The present study however only takes the social adaptation effect as a hypothesis, as the minority effect is hard to discern from the other effects as being a member of an immigrant group, for instance effect of their subculture, or effect of their socialization in their country of origin.
2 Coverage of the population census of Japan for foreign citizens is estimated 70 – 80%, based on other statistics on registered foreign citizens in Japan (Ishikawa 2005).
3 The 21st completed life table of Japan is used to estimate their survival rates.
0.00%
1.00%
2.00%
3.00%
4.00%
5.00%
6.00%
7.00%
8.00%
9.00%
0 1 2 3 4 5 6 7 8 9 10 11 12 13 14 15 16 17 18
Hazard for Divorce
Duration of Marriage (year)
JP couple Chinese Wife-JP Husband
Philippine wife -JP Husband
Thai Wife-JP Husband
Brazilian Wife-JP Husband
4 These TFRs are neither a period-type nor a cohort-type one, but a time-cohort type, which needs caution to compare it with a conventional period-type, or a cohort-type TFR.
5 In the case of timing of giving births, an average elapsed time from migration is respectively 1.5 to 2.5 years, -2.5 to 1.5 years.
6 Only aggregated-level analysis was implemented in the present study, due to the limitation of explanatory covariates, which are observed only at the time of survey, although an individual-level analysis was also considered as the same in the analysis of the social assimilation.
7 It is known that cohort fertility is stable during one’s lifetime depending on their socio-economic characteristics, although there has not been any major theory explaining its actual level. Thereby the model can discern difference of their cohort fertility as a difference of probability of giving a birth in the last 1 year between women depending on their socio-economic characteristics including ethnicity.
8 It is included to estimate difference of timing of giving a birth between different foreign citizenships.
9 Categories of educational attainments are lower than junior high school, high school, junior college, and higher than university. Any of them includes current students at each educational attainment.
10 Information on immigrant women’s educational attainment is not included in the model, because its effect on their fertility is represented in other socio-economic characteristics.
11 TFR calculated from the vital statistics is 1.39 in 2010 for Japanese women, which is slightly higher than one estimated by the own-children method.
12 A dummy variable of being a spouse of a Japanese man indicates the difference of fertility among married immigrant women depending on their husband’s nationality. This covariate is statistically significant only among Chinese and Philippine women, whereas they are showing positive values but not statistically significant for other two nationalities.
13 It is almost the same as the one obtained from the 14th National Fertility Survey conducted by National Institute of Population and Social Security Research in 2011 (IPSS 2012: 48), which is 54.7% among mothers who have at least one 1-year-old baby during 2005-9.
14 22.7 % of Japanese women who have at least one younger-than-1-year-old baby are employed as fixed-term contracted workers, whose working benefits are scarce, whereas the proportion of fixed-term contracted workers is 33.4% for Chinese, 78.3% for Philippines, 57.1% for Thai, and 62.8% for Brazilian women.
15 The rate of leave of absence of immigrant women who are married to Japanese men is 24.7% for Chinese, 9.5% for Philippines, 17.3% for Thai and 27.3% for Brazilian women, which are significantly lower than those among immigrant women who are married to immigrant men, reflecting the fact that a social environment for child rearing for immigrant women who are married to Japanese men might be better than those for immigrant women who are married to immigrant men.
16 There is a few studies on fertility of international couple in the U.S. and Europe, which is partly due to the fact that marriages among immigrants are mostly those among immigrants in those countries.
References
Andersson, G. 2004 “Childbearing after Migration: Fertility Patterns of Foreign-born Women in Sweden,” International Migration Review, 38(2), pp.747-75.
Cho. L. J., Retherford, R. D. & Choe. M. K. 1986 The Own-Children Method of Fertility Estimation, East-West Center Book, East-West Center, Hawaii University.
Cornelius, W. A. T. Tsuda, P. L. Martin, & J. F. Hollifield 2004 Controlling Immigration A Global Perspective, Second edition, Stanford University Press.
Dubuc, S. 2009 “Application of the Own-Children Method for Estimating Fertility by Ethnic and Religious Groups in the UK,” Journal of Population Research, 26, pp.207-25.
Ford, K. 1990 “Duration of Residence in the United States and the Fertility of U.S. Immigrants,”
International Migration Review, 24(1), pp.34-68.
Fujimoto, N. 2013 “Gisokekkon no Jirei kara Jinshintorihiki no Grayzone wo Kensho Suru”, Ritsumeikan Kokusai Chiiki Kenkyu, Vol.37, pp.175-181. (J)
Goldsheider and Uhlenberg 1969 “Minority Group Status and Fertility,” The American Journal of Sociology, 74(4), pp.361-372.
Goldstein, J. et al. 2009 “The End of “Lowest-Low” Fertility?” Population and Development Review, 35(4), pp.663-99.
Goldstein, S. & A. Goldstein 1981 “The Impact of Migration on Fertility: an ‘Own Children’ Analysis for Thailand,” Population Studies, 35(2), pp.265-84.
Grabill, W. H. & L. J. Cho 1965 “Methodology for the Measurement of Current Fertility From Population Data on Young Children,” Demography, 2, pp.50-73.
Hara, T., T. Ueki & M. Murakami, 1994, “Estimate of the Number of International Children in Japan, Based on Trends in Intermarriage”, International Journal of Japanese Sociology, 3, pp.29-43.
Hara, T. 1996 “Kokusaikekkon to Kokusaiji no Shushodoukou”, Kazokushakaigakukenkyu, Vol.8,pp.67-79. (J)
Iami, H. 2011 “Kokusaikekkon no Fufu no Shushoryoku – Nihonjin Dansei to Gaikokujin Jyosei no Kumiawase no Bunseki”, Keikakugyosei, Vol.34(4), pp.41-8. (J)
Ishikawa, Y. 2005 “Gaikokujin Kankei no Nitoukei no Hikaku”, The Journal of Population Studies”
Vol.37, pp.83-94. (J)
Katsuno, M. & Hayasi K. 1990 “Wagakuni ni Okeru Gaikokujin no Shussan –Sonosuii to Shoraiyosoku”, Shusankiigaku, pp.1792-32. (J)
Kim 1971 “Zainichi Chosenjin no Jinkougakutekikenkyu”, Minzokueisei, Vol.37(4), pp.131-57.(J) Kim 1977 “Zainichi Kankokujin no Saikin 10 Nenkan ni Okeru Jinkougakutekisuii”, Minzokueissei,
43(3,4),pp.91-102.(J)
Kim, Doo-sub 2008 “Status of Foreign Wife and Fertility: A Comparative Analysis of Korean and Taiwanese Data,” In Kim, Doo-Sub eds. Cross Border Marriage, Process and Dynamics, pp. 287- 319, The Institute of Population and Aging Research, Hanyang University.
Kim et al. 2012 “Mate Selection Pattern and Fertility Differentials among Marriage Immigrants in Korea,” In Kim, Doo-Sub eds. Cross Border Marriage: Global Trends and Diversity. pp.235-277,
Korea Institute for Health and Social Affairs (KIHASA).
Kojima , H. 2007 “Kokusaikekkonfufu no Kazokukeisei Kodou – Nihon to Taiwan no Hikakubunseki”, Keizaigakuronso, Vol.47(3,4). Pp.175-96. (J)
National Institute of Population and Social Security Research 2012a Heisei 22nen Dai14kai Shussho Doko Kihonchosa (Kekkon to Shussan ni Kansuru Zenkokuchosa Daiichi Hokokucho, National Institute of Population and Social Security Research. (J)
―――― 2012b Nihon no Shorai Jinko Sukei – Heisei 23(2011) – 72(2060)Nen, National Institute of Population and Social Security Research. (J)
―――― 2013 Nihon no Shorai Suikei Jinko – Heisei 24 Nen Ichigatsu Suikei no Kaisetsu Oyobi Sanko Suikei, National Institute of Population and Social Security Research. (J)
Korekawa, Y. 2013a “Nihon Ni Okeru Gaikokujin no Ijyu Katei ga Sono Shushoritsu ni Oyobosu Eikyo ni Tsuite”, Japanese Sociological Review, Vol.(64(1), pp.109-27. (J)
―――― 2013b “Nihon ni Okeru Gaikokujin Jyosei no Shushoryoku – Kokuseichosa Micro-data ni Yoru Bunseki”, Jinkomondaikenkyu, Vol.69(4), pp.86-102, National Institute of Population and Social Security Research. (J)
Ministry of Health, Labour and Welfare 2012 Dai 21kai Seimeihyo (Kanzen Seimeihyo),
http://www.mhlw.go.jp/toukei/saikin/hw/life/21th/index.html(the last accessed day was March 21st, 2013). (J)
Lee, S. 1998 Zainiti Gaikokujin no Boshihoken – Nihon ni Ikiru Sekaino Haha to Ko, Igakushoin.
Maffiolim et al. “Transnational Couples in Italy: Characteristics of Partners and Fertility Behavior,”
In Kim, Doo-Sub eds. Cross Border Marriage: Global Trends and Diversity. pp.279-319, Korea Institute for Health and Social Affairs (KIHASA).
Milewski, N. 2009 Fertility of Immigrants, A Two-Generational Approach in Germany, Springer.
―――― 2010 “Immigrant Fertility in West Germany: Is There a Socialization Effect in Transitions to Second and Third Births? European Journal of Population, 26,pp. 297-323.
Mori, H. 2001 “Waga Kuni ni Okeru Gaikokujin no Kokusekibetsu Shushoritsu ni Tsuite”, Occasional Paper, Hosei University, Vol.7, pp.1-18. (J)
Nihon Tokei Kyokai 1990 Dokyojiho ni Yoru Nihon no Shushohendo no Keisoku to Bunseki – Showa 60 Nen Kokusei Chosa Monograph Series No.4, Nihontokeikyokai. (J)
OECD 2015 International Migration Outlook 2015, OECD Publishing
Parrado, E. A. 2011 “How High is Hispanic/Mexican Fertility in the Unites States? Immigration and Tempo Considerations,” Demography, 48, pp.1059-80.
Portes, A. and Zhou, M. 1993. The New Second Generation: Segmented Assimilation and Its Variants.
The Annals of the American Academy of Political and Social Science 530, pp.74-96.
Raymo, J. Miho Iwasawa, Larry Bumpass 2005 “Nihon ni Okeru Rikon no Genjyo, Kekkon Cohort Betsu no Susei to Kyoikusuijyunbetsu Kakusa”, Jinkomondaikenkyu, Vol.61(3), pp.50-67, National Institute of Population and Social Security Research. (J)
Sobotka T. 2008 “The rising importance of imigrants for childbearing in Europe”, Demographic Research, Vol.19(9), pp.225-248.
Stephen, E. H. and F. D. Bean 1992 “Assimilation, disruption, and the fertility of Mexican-Origin women in the Unites States,” International Migration Review, 26(1), pp.67-88.
Takeda S. 2011 Murano Kokusaikekkon Saiko Kekkonijyujyosei to Noson no Shakihenyo, Mecon. (J) United Nations, Department of Economic and Social Affairs, Population Division 2014 World
Population Prospects The 2012 Revision, Methodology of the United Nations Population Estimates and Projections, Working Paper No, ESA/P/WP. 235.
Vila M. R. and T. C. Martín 2007 “Childbearing Patterns of Foreign Women in a New Immigration Country: The Case of Spain,” Population (English Edition), 62(3), pp.351-79, INED.
Yamauchi, M. 2010 “Kinnen no Nihon ni Okeru Gaikokujin Jyosei no Shushosu to Shushoritsu”, Jinkomondaikenkyu, Vol.66(4), pp.41-59.
Yang and Schoonheim 2010 “Minority Group Status and Fertility: The Case of ‘Foreign Brides’ in Taiwan,” In Yang and Lu ed. Asian Cross-border Marriage Migration, Demographic Patterns and Social Issues, pp.103-125, Amsterdam University Press.