ABSTRACT
The present paper reports an exploratory case study designed to examine the ef-fects of study abroad(SA) and of individual speech training before SA(PreTr) and after SA(PostTr) on development of fluency and English speech rhythm. The participants were two Japanese learners of English(J1, J2) enrolled in an academic program with a five-month SA. Spontaneously produced narratives (N=272 for J1, and N=264 for J2) were recorded over a period of 24 months for
J1, and 20 months for J2. Among them, 184 recordings and 139 recordings were acoustically analyzed. As fluency measures, articulation rate(AR), speech rate (SR), mean length of runs(MLoR), and pause ratio(PauseRat) were used. For
measures of English rhythm, two groups of measures were used. The first, called rhythm measures, included normalized pairwise variability of vowels in duration, pitch, and intensity(nPVI-V-D/P/I) and variation coefficient of duration, pitch, and intensity(VarcoV-D/P/I). The latter, called stress-related measures, mea-sured the acoustic difference between stressed and unstressed syllables in con-tent words in terms of duration, pitch, and intensity(STCN-D/P/I), and between stressed syllables in content words and monosyllabic function words in terms of duration, pitch, and intensity(STFN-D/P/I). The pitch and intensity range mea-sures(RNG-P/I) were also included in the analyses. The results found that J1 and J2 differed in the way fluency and English speech rhythm developed during Pre/PostTr and SA. In J1, although most fluency measures and the rhythm/ stress-related measures in pitch and intensity significantly improved through PreTr, the fluency and the stress-related measures in duration hardly improved during SA. These measures, however, showed substantial improvement after SA (i.e., PostTr). J2 also showed significant improvements in most of the fluency and
An exploratory case study on development of fluency
and English speech rhythm through individual speech
training and a study abroad program.
rhythm/stress-related measures through PreTr, achieving a more advanced level than J1, especially in terms of fluency and the stress-related measures in dura-tion. In contrast to J1, however, J2 showed the largest rate of improvement dur-ing the latter half of SA in most measures. These finddur-ings suggested that the level of fluency and of the ability to control duration at the entry of SA might be related to the timing and/or magnitude of improvement during SA. It is also sug-gested that development of fluency might be related to that of the ability to ma-nipulate duration in distinguishing stressed/unstressed syllables. The findings on the development of the stress-related measures indicated that, in agreement with previous research, both participants had greater difficulty learning to manipulate duration than pitch and intensity. Implications for teaching will be discussed. key words; L2 learning, speech rhythm, fluency, study abroad, stress, rhythm indices
1. Introduction 1-1. Review of literature
It is generally believed that a study abroad(SA, henceforth) program provides its participants with an optimal environment to learn a foreign language. In SA learning settings, it is possible for learners to have ample opportunities to interact with native speakers as well as nonnative speakers from other countries, in addition to the foreign language courses provided in the institution they attend. In the formal instruction settings in the environment where the target language is not spoken(FI, henceforth), it is generally difficult to have enough chances to utilize their linguistic knowledge in practical communication outside classrooms, which makes it difficult to improve especially fluency (see Pérez-Vidal, 2014, for a review of previous research on the effects of SA and FI in
various linguistic domains). On the other hand, it has been indicated that individual speech training in FI settings is able to improve fluency and phonological ability to some extent(e.g., Tsushima, 2016; Tsushima, 2018). What are the effects of SA and speech training before and after SA on development of fluency and phonological ability? The general purpose of the present study was to explore fluency and phonological development in spontaneous speech productions of two Japanese learners of English in an academic program with a five-month SA.
universal ability to perceive phonetic categories in any language they are exposed to(e.g., Eimas, Siqueland, Jusczyk, & Vigorito, 1971). It has also been demonstrated that the universal ability becomes attuned to the ambient language they acquire by the end of the first year of life(Best, McRoberts, & Sithole, 1988; Werker & Tees, 1984). More specifically, listeners of a native language develop a language-specific speech processing mechanism where they attend to acoustic cues that are critical in distinguishing and recognize phonemes and prosodic categories of the native language(e.g., Jusczyk, 1993). Thus, learning a new language requires its learners to modify the native language processing patterns to adapt to those of the target language(e.g., Holt & Lotto, 2006). Incomplete modification will result in misperception of nonnative phonemes or prosodic categories, and lead to foreign-accented speech at both segmental and prosodic level, which often remains intact or ‘fossilized’ even after a long period of L2(second language) learning(e.g., Acton, 1984).
Previous research has demonstrated that L2 learners can achieve native-like proficiency both in perception and production in natural learning settings where the target language is spoken as a primary language, especially when acquisition starts before puberty(Oyama, 1976). On the other hand, it is difficult, if not impossible, to do so in a learning environment where learners are not exposed to the target language on a daily basis(Flege, 1999). These findings suggest that, as compared with the FI settings, the SA settings may offer a favorable learning settings where learners can receive sufficient input to modify their perceptual processes, develop more native-like phonetic representations, and improve the ability to accurately produce segmental and prosodic categories of the target language.
Previous research which investigated phonological development during SA, however, has failed to find clear evidence of SA’s positive effects on development of segmental perception(Mora, 2014) and segmental production(Avello & Lara, 2014). For example, Avello and Lara(2014) examined vowel duration, quality, and voice onset time(VOT) in voiceless plosives among Catalan/Spanish adult learners of English during a three-month- or six-month period of SA. The results found no significant effect of SA on production accuracy. Nor did they find significant effects of the length of stay. However, Avello, Mora & P’erez-Vidal(2012) found significant increase in pronunciation accuracy when multiple phonological measures were used(e.g., insertions, deletions, and substitutions). These results suggested that the degree to which the effects of SA can be observed might depend on the phonological properties investigated, and that multiple measures be used
to investigate phonological development during SA.
One factor relevant to phonological development during SA may be the L2 learner’s fluency as it may influence the amount of attentional resources available for phonological encoding and execution of articulatory gestures(Kormos, 2006). Previous research has found significant effects of SA on development of fluency(Freed, 1995; Mora & Valls-Ferrer, 2012; Sagalowitz & Freed, 2004; Valls-Valls-Ferrer, 2008, 2011; Valls-Ferrer & Mora, 2014). For example, Valls-Ferrer and Mora(2014) examined development of fluency(e.g., speech rate, articulation rate, phonation-time ratio, and mean length of runs) among 27 Catalan/Spanish adult learners of English during three-month period of SA and a six-month period of FI before and after SA. The results showed that a majority of the fluency measures significantly improved during SA, while none of the measures did during FI. It was also found that the initial fluency level did not significantly affect the degree of improvement in fluency during SA. Thus, the previous research suggested that SA may provide favorable learning settings where participants can improve fluency through a great deal of opportunities to practice speaking the target language.
In order to provide further data on the effects of SA on fluency and phonological development, the present study attempted to examine longitudinal development of fluency and rhythmic properties of English in two adult Japanese leaners of English during speech training before SA(PreTr, henceforth), SA, and the training after SA(PostTr, henceforth). Previous research has shown that Japanese learners of English experience a great deal of difficulty learning to produce the rhythmic properties of English(e.g., Tsushima, 2016; Tsushima, 2018). English is generally classified as a stress-timed language while Japanese, a mora-timed language(e.g., Ladefoged, 1982). These two languages have the following differences in their phonetic/phonological properties relevant to speech rhythm. First of all, lexical stress in English is correlated with duration, pitch, and intensity, while only pitch is correlated with lexical accent in Japanese(Beckman, 1986). Second, English has reduced vowels which occur in unstressed vowels of lexical items (e.g., “lot” in “pilot”) and function words(e.g., prepositions), while Japanese does not. The
reduced vowels are generally short in duration, low in f0(fundamental frequency) and amplitude, and produced as a schwa. Due to the presence of these vowels in English, stressed and unstressed syllables typically alternate in a sentence, giving an impression of a recursive rhythm of strong and weak syllables(Mori, Hori, & Erickson, 2014). In Japanese, on the other hand, duration of successive morae tends to be equal regardless of accent status, giving an impression of repetition of morae with equal duration. Finally,
English has relatively more complex syllable structure than Japanese does. English allows for consonant clusters at the beginning and end of a syllable, while Japanese mostly restricts its structure to a simple CV syllable(Vance, 1987).
In order to quantitatively capture the differences in rhythm, a number of rhythm indices have been proposed(e.g., Grabe & Low, 2002; Ramus, Nespor, & Mehler, 1999). Among them, the present study used nPVI-V(normalized pairwise variability index for vocalic interval duration) and VarcoV(coefficient of variation of vocalic interval duration), as they have been shown to successfully differentiate not just English spoken by L2 Japanese speakers and native speakers of English, but also English spoken by L2 Japanese speakers of English with different proficiency levels(Kawase, Kim, & Davis, 2016; Tsushima, 2016, 2017, 2018). The first index, nPVI-V, indicates the degree of durational variability in pairs of neighboring vowels, normalized for speaking rate. The second, VarcoV, indicates the degree of variability among all the vowels, normalized for speaking rate. Previous research has shown that English syllables produced by Japanese learners of English are relatively equal in duration as compared with those produced by native speakers of English(Bond & Fokes, 1985; Mochizuki-Sudo & Kiritani, 1991). In addition, it has also been shown that Japanese learners of English find it difficult to learn to control the relative duration of stressed and unstressed syllables(Mori et al., 2014; Tsushima, 2016). Moreover, it has been shown that function words produced by Japanese leaners of English are generally longer than those of native speakers of English(Aoyama & Guion, 2007). As expected from these characteristics of Japanese speakers of English, it has been shown that both nPVI-V and VarcoV are significantly higher in native speakers of English than Japanese speakers of English, and that more advanced learners of English show higher values of both indices than less advanced ones(Kawase et al., 2016; Tsushima, 2016, 2017, 2018)1).
The available data on development of English rhythm during SA are sparse and remain inconclusive. Gut(2009) examined the syllable ratio(i.e., the average ratio of adjacent syllable pairs of stressed and unstressed syllables) in the speech of non-native speakers of German(N=17) and of English(N=13) before and after a 9-month SA in Germany or England or before and after a six-month course in German and English pronunciation. The results found no significant changes in the syllable ratio before and after either SA or the instruction. In the same study, however, they found significant improvement before and after both the SA and the instruction when another rhythmic measure(i.e., the percentage of reduced- or deleted-vowel syllables) was analyzed.
Valls-Ferrer(2011) examined the rhythmic properties(e.g., % V(percentage of vocalic intervals) and VarcoC(coefficient of variation of consonantal intervals)) and fluency (e.g., articulation rate, mean length of runs) among advanced learners of English who
were Catalan/Spanish or Basque/Spanish bilinguals(N=30) during a six-month FI period and three-month SA period. The results found that both fluency and rhythm significantly improved during SA only. Tsushima(2017) examined nPVI-V before and after a 5-month SA among Japanese learners of English(N=7). It was found that nPVI-V substantially increased to approximate that of the native speakers of English, but that such improvement was limited to participants with a relatively high initial proficiency level. It was also found that the degree of accentedness in terms of English rhythm, as evaluated by native speakers of English, substantially improved before and after SA. Overall, the limited available data appear to suggest the use of multiple measures in examining the development of L2 speech rhythm, and that it is important to take relevant factors such as the learners’ initial proficiency and fluency levels into consideration.
1-2. Rationale
First of all, the present study was conducted in the form of a case study where two learners’ development of English speech rhythm and of fluency was examined for a long period of time(i.e., 24 months for the first participant(J1, henceforth), and 19 months for the second participant(J2, henceforth), which included a period of PreTr(speech training before SA), SA, and PostTr(speech training after SA) for J1, and a period of PreTr and SA for J2. In a longitudinal study, it is a rule rather than exception to find individual differences in the way learners improve their L2 abilities. In the study of English rhythm and fluency, for example, the degree to which an individual learner benefits from the training and SA might differ across the participants. Regarding the ability to differentiate stressed and unstressed syllables, the ability to utilize duration, pitch, and intensity might develop differently. It was hoped that examining individual development in great details would capture developmental patterns that might be missed in the averaged data from a larger data sample.
The data analyzed in the present study were based on spontaneously produced speeches the participants recorded regularly(i.e., at least eight times a month) during PreTr, SA, and PostTr. In total, J1 and J2 made 272 and 264 recordings, respectively. Among them, 184 recordings for J1 and 156 recordings for J2 were submitted to data analyses. A spontaneous speech task(as opposed to a reading task) was used as it can
assess the ability to produce speech while engaging in online lexical retrieval/access, phonological, morphological, and syntactic encoding, as well as discourse/pragmatic processing. As discussed above, facilitation of these processes may positively affect fluency, which in turn might afford sufficient attention to phonetic aspects of speech including rhythm.
Third, the two participants received individual-based pronunciation training over and above the formal instruction(i.e., English classes) provided in the school curriculum. As described above, FI without a focus on phonetic skills is generally unable to improve the learners’ perception or production ability. In addition, it was presumed that a certain level of pronunciation skills and fluency might be necessary for the participants to improve their English speech rhythm and fluency during SA. Therefore, it was decided to provide the participants with regular pronunciation training focused on English speech rhythm. Another purpose of the individual training was to keep the participants aware of their pronunciation during both the training periods and SA. Especially the participants were encouraged to be aware of the current targets for improving their pronunciation skills. For each speech the participants made, the author made comments about how segmental or prosodic aspects of speech could be further improved.
In order to measure fluency, the present study used speech rate(SR), articulation rate(AR), mean length of runs(MLoR) as speed fluency measures, and pause frequency (PauseFreq) and pause duration rate(PauseRat) as breakdown fluency measures(Valls-Ferrer & Mora, 2014). The speed fluency measures indicate how fast the speaker can produce words(AR, SR), or how many words the speaker can produce without making a pause(MLoR). The breakdown fluency measures indicate how often the speaker makes a pause(PauseFreq), or the proportion of the total amount of pause in the total speaking time(PauseRat).
For measurements of the development of English speech rhythm, the present study used a normalized variability index for vowel duration(nPVI-V-D, henceforth) and a variation coefficient of vocalic intervals(VarcoV-D, henceforth). These two indices reflect the degree to which the speaker is able to vary the duration of vowels according to the stress status of syllables in neighboring vowels(nPVI-V-D), and among all the vowels in the entire speech(VarcoV-D). Similar pairwise variability measures were used for pitch and intensity(nPVI-V-P and NPVI-V-I, henceforth). The former is an averaged difference of f0 in a pair of neighboring vowels, normalized for a perceptual distance in terms of a mel scale. The latter is an averaged difference of dB in a pair of neighboring vowels,
which reflects a normalized perceptual distance in intensity. Finally, variability coefficients in terms of pitch and intensity were also used(VarcoV-P and VarcoV-I, respectively). These indices reflect the degree to which pitch and intensity vary according to the stress status of syllables in an entire speech. For example, the value of VarcoV-P will be relatively small when the speaker speaks mostly with a flat pitch pattern across the syllables in a sentence, as typically observed in novice Japanese learners of English. In addition to the rhythm indices, the present study used another set of measures which indicate the degree to which stressed and unstressed syllables are differentiated in terms of duration, pitch, and intensity(called stress-related measures, henceforth). The measures included an averaged difference between stressed and unstressed syllables of content words in terms of vowel duration(STCN-D, henceforth), pitch(STCN-P, henceforth), and intensity(STCN-I, henceforth), and an averaged difference between stressed syllables of content words and function words in terms of vowel duration (STFN-D, henceforth), pitch(STFN-P, henceforth), and intensity(STFN-I, henceforth).
These measures were used to delineate how each participant improved the ability to differentiate stressed and unstressed syllables in content and function words by means of duration, pitch, and intensity. The pitch range(RNG-P) and intensity range(RG-I) were also examined.
1-3. Specific research questions
Specific research questions asked in the present study were the following.
1)How did the fluency measures, the rhythm measures, and the stress-related measures change during the periods of speech training and study abroad in each participant? 2)How, if any, were the changes in the fluency measures related to those of the rhythm measures and the stress-related measures?
2. Method 2-1. Participants
The participants of the present study(J1 and J2) were two female adult learners of English enrolled at a private university in Tokyo. The university has a three-year academic program aimed at developing English abilities and cultivating global perspectives with intercultural understanding among its participants. The program provides 1) one-and-half-a-year FI in a freshman year and the former half of a sophomore
year, 2) five-month SA in Sydney in the latter half of the sophomore year, and 3) one-year FI during a junior one-year. J1 joined the research project from the end of July in the freshman year while she was taking general English communication classes, and joined the SA program at the beginning of the sophomore year. J2 joined the SA program at the beginning of the freshman year, and joined the project at the end of the first month of the program. Therefore, J2 was enrolled in the research project one semester longer than J1. At the time of writing this manuscript, J1 was still enrolled in the project, while J2 had to leave the project in the middle of the fourth month of SA due to her personal circumstances. Although her data in the last month of SA could not be obtained, it was decided to report the data as they clearly showed significant improvement in both fluency and the rhythmic properties until the time she quit the project. Both J1 and J2 were highly motivated to study English, especially to improve their speaking ability and pronunciation skills. Based on their TOEIC scores, J1’s CEFR(The Common European Framework of Reference for Languages) level2) was middle A2 at the entry into the
project, low B1 just before SA, middle B1 just after SA, and upper B1 at the end of the data acquisition period. J2’s CEFR level was low A2 at the entry into the project/ program, middle B1 just before SA, and upper B1 just after SA.
During the freshman year when J1 was not enrolled in the SA program, she took required English communication classes and elective classes focused on reading and grammar. J2 took program-specific English classes designed to develop four skills (speaking, listening, reading, and speaking), vocabulary, and grammar, in addition to the
required English communication classes. During the first semester of the sophomore year, both participants took the program-specific English conversation classes taught by native speakers of English five days a week. In these classes, the main focus was to develop the ability to carry out conversation in English, with only passing attention paid to teaching pronunciation. During SA, both participants stayed with a home-stay family where they had opportunities to have conversations in English with members of the host family. They also attended English courses at a university-affiliated foreign language center where they took classes focused on different language skills(speaking, listening, reading, writing, and grammar), although no class was solely focused on teaching pronunciation. During the first semester of the junior year, both participants took the program-specific classes in English writing and TOEIC.
2-2. Data Acquisition
As part of the participants’ tasks for the research project, they were asked to make a one-minute recording of their English narrative about their daily activities or events (called “daily recording”). They were encouraged to do so every day, but required to
complete the task at least eight times a month. J1 made a total of 272 recordings(153 in the PreTr, 60 in SA, and 59 in PostTr)3), while J2 made a total of 264 recordings(205 in
the PreTr and 59 in SA). They were asked to speak for about one minute, but the length varied from around 45 seconds to up to more than a few minutes. The participants made a recording basically at home, using their mobile phone with a high-quality microphone (Zoom IQ7). The sound file was uploaded to a server or sent to the author via email.
They occasionally made a recording during a pronunciation practice session in the author’s office, using a high-quality microphone(Audio-Technica AT4040). At an initial stage of the training period, they generally talked about basic daily activities(e.g., getting up, having breakfast, leaving home, and attending classes). When they became accustomed to talking about simple activities, they were encouraged to talk about one special event in more details with a beginning and ending. At a more advanced stage, they were asked to talk about a familiar topic(e.g., hobby, hometown, favorite place), or to present their opinion with supporting reasons about some issue.
Data acquisition from the native speakers of English(NS, henceforth) using the same format as the Japanese speakers was still in progress at the time of writing. Therefore, it was decided to use the following two sets of narrative data. The first data set(N=6), collected for the author’s previous research, was produced by NS(all males from U.S.(N=3), Canada(N=1), England(N=1), and New Zealand(N=1)) who performed a task of telling a story based on a sequence of pictures(i.e., four pictures describing a boy scout leader and children going camping). Another set was produced by NS(N=2, both female from Canada and U.S.A.) who were hosts of a podcast program called Culips ESL Podcast(https://esl.culips.com/). The portion of the recording where the speaker spoke about some event(i.e., getting late for work) or explains some idea (i.e., veganism, linking, alternative medicine) was used for the present analysis(two sets
for each speaker). The first 30 seconds of their speech data were subjected to acoustic analyses using the same criteria described below. Altogether 10 data sets were used as the NS data.
2-3. Acoustic Data Analyses
The sound files were digitized at 16 bits of resolution with a sampling rate of 44.1 kHz, low-pass filtered at 8,000 Hz, and then normalized for intensity(75 dB), using sound analysis software, Praat(Boersma & Weenink, 2014). On Praat, the sound was segmented into consonant and vowel portion by visually inspecting wave forms and wide-band spectrograms, perceptually confirming the boundaries. Standard segmentation criteria were followed as much as possible(e.g., Machač & Skarnitzl, 2009; Payne, Post, Astruc, Prieto, & Vanrell, 2012; Peterson & Lehiste, 1960). Using a Praat script, f0 and intensity (dB) were measured at the mid-point of the vowel portion. When the measurement of
pitch failed using the script, the pitch value was manually calculated through inspection of wave forms at the mid-point of the vowel portion.
In total, 12,394 vowels and 11,610 vowels were analyzed for J1 and J2 respectively, with the mean duration being 149 ms(SD=88 ms) and 163 ms(SD=99 ms), respectively. Inspection of the distribution of the vowel durations revealed that they were skewed toward a longer duration. The maximum vowel duration was 988 ms and 844 ms for J1 and J2. Disproportionately long vowels were mostly due to disfluent productions(e.g., prolonged “I” and “So”). Therefore, it was decided to exclude vowels equal to or longer than 350 ms from the analyses, which accounted for 4.0% and 5.7% of total vowels produced in J1 and J2, respectively.
2-4. Rhythm measures
As described above, the present study used a normalized pairwise variability index of vowels in duration(nPVI-V-D), pitch(nPVI-V-P), and intensity(nPVI-V-I), as well as variability coefficient in duration(VarcoV-D), pitch(VarcoV-P), and intensity (VarcoV-I). In calculation of these vowels, the last pair of vowels in each sentence was
excluded to eliminate potential influence of final lengthening and/or sentence-final pitch/intensity changes. The pairwise variability measures were calculated for a succession of CV sequences within a syntactically determined sentence without a silent period of 300 ms or longer(i.e., a pause). For nPVI-V-D, the absolute durational difference of adjacent vowels was calculated for each pair, which was divided by the mean duration of both vowels to normalize for speaking rate. Then, the normalized values for all the pairs in an entire narrative were averaged, and then multiplied by 100. For nPVI-V-P, f0 values were first transformed into mel values such that the numeric difference in mel corresponds to a perceptual difference in pitch. Then, the difference in mel between
adjacent vowels was averaged over all the pairs in an entire narrative. For nPVI-V-I, the difference in dB between adjacent vowels was averaged over all the vowel pairs in the entire narrative. For VarcoV-D, VarcoV-P, and VarcoV-I, the standard deviation of vowel durations, mel values, and dB values over the entire narrative was divided by their respective mean value.
2-5. Stress-related measures; measures of acoustic difference in duration, pitch, and intensity between stressed and unstressed vowels
Each syllable was assigned a code of 1) a stressed syllable of a content word(e.g., “fac” in factor), 2) an unstressed syllable of a content word(e.g., “tor” in factor), or 3) a syllable of a monosyllabic function word(e.g., “on”). When a word has more than two syllables, only the syllable with a primary stress was assigned a code of the stressed syllable. A monosyllabic content word(e.g., went, had) was either assigned a code of stressed or unstressed according to the prosodic structure of the phrase or sentence. Function words included monosyllabic prepositions(e.g., in), articles(e.g., the), and to- infinitives. “Be-verbs”(e.g., is, was) were also included in this category. The other categories, including pronouns(e.g., him), auxiliary verbs(e.g., can), conjunctions(e.g., if) and others were excluded from calculation of the stress-related measures.
In calculation of STCN-D(the durational difference between the stressed and unstressed vowel of content words), the mean proportion of all the unstressed vowels to all the stressed vowels in an entire narrative was calculated and multiplied by 100. For STCN-P(the pitch difference between the stressed and unstressed vowel of content words), the mean mel of all the unstressed vowels in an entire narrative was subtracted from that of the stressed vowels. For STCN-I(the intensity difference between the stressed and unstressed vowel of content words), the mean dB of all the unstressed vowels in an entire narrative was subtracted from that of the stressed vowels. The same method was used in calculation of the stress-related measures on the difference between stressed vowels of content words and function words in duration(STFN-D), pitch (STFN-P), and intensity(STFN-I henceforth).
2-6. Pitch range and intensity range
For the pitch range(RNG-P) and the intensity range(RNG-I), an absolute difference between the minimal and maximum value of mel and dB among all the vowels in a
sentence was calculated. Then, the values were averaged over all the sentences in an entire narrative.
2-7. Fluency measures
Fluency measures used in the present study followed the calculation methods used in Valls-Ferrer & Mora(2014: p. 120). Following the study, a pause was defined as a silent interval which was 300 ms or longer. In calculation of MLoR, the number of words, rather than syllables, was used.
SR(Speech Rate): total number of words produced in a given speech sample divided by the amount of total time required to produce the speech sample(including pause time) expressed in minutes.
AR(Articulation Rate): total number of words produced in a given speech sample divided by the amount of time taken to produce them(excluding pause time) expressed in minutes.
MLoR(Mean Length of Runs): the average number of words produced in utterances between pauses of 300 ms and above.
PauseFreq(Pause Frequency): total number of pauses divided by the total amount of time expressed in seconds and multiplied by 60.
PauseRat(Pause Duration Ratio): the total length of pauses divided by the total amount of time speaking time(including pause time).
2-8. Data analyses
The total period was divided into the following sub-periods. J1:
BL(Base Line): The first two months(summer vacation of the freshman year; August & September)
PreTr2: the 3rd to 5th month(the second semester of the freshman year; October, November & December)
PreTr3: the 6th to 8th month(the last month of the second semester and Spring vacation; January, February & March)
PreTr4: the 9th to 12th month(the first semester of the sophomore year; April, May, June & July)
SA1: the 13th to 14th month(the first two months of SA; August & September)
December)
PostTr1: the 18th to 20th month(the last month of the second semester and Spring vacation; January, February & March)
PostTr2: the 21st to 24th month(the first semester of the junior year; April, May, June & July)
J2:
BL(Base Line): The first two months(the first semester of the freshman year; May & June)
PreTr1: the 3rd to 5th month(the last month of the first semester and summer vacation; July, August & September)
PreTr2: the 6th to 8th month(the second semester of the freshman year; October, November & December)
PreTr3: the 9th to 11th month(the last month of the second semester and Spring vacation; January, February & March)
PreTr4: the 12th to 16th month(the first semester of the sophomore year; April, May, June & July)
SA1: the 17th to 18th month(the first two months of SA; August & September) SA2: the 19th to 20th month(the latter two months of SA; October & November) 2-9. Training sessions
J1 had a 90-minute practice session per week(except during summer, winter, and spring vacation). She had a total of 32 sessions in PreTr and 20 in PostTr. J2 had two or three sessions per week during the freshman year(except during vacations), and had one or two sessions per week during the sophomore year. J2 had a total of 80 sessions in PreTr. The training primarily used a pronunciation textbook, Clear Speech, which places emphasis on learning English rhythm(Gilbert, 2012). It encourages learners to make clear distinction between stressed and unstressed syllables by emphasizing peak vowels and de-emphasizing unstressed vowels and structure words. Over the training sessions in PreTr, the participants studied topics such as 1) the notion of syllable, 2) how to pronounce English vowels, 3) the notion of stress, 4) how to pronounce stressed/ unstressed/reduced vowels, and 5) the notion of sentence focus. Not just using the textbook, they were also engaged in a variety of production activities which included 1) reading aloud, 2) retelling a story, 3) making a short speech about a given topic, 4) producing a sentence given a key word, 5) describing pictures in a vocabulary picture
book, and 6) describing a set of toy items(e.g., cars, animals). In these activities, the participants were encouraged to pay attention to the rhythmic properties of English. In addition, they occasionally had a chance to review the recording they had recently made by inspecting the acoustic properties(e.g., duration, pitch, and intensity) of their speech on Praat software.
3. Results
3-1. Fluency measures
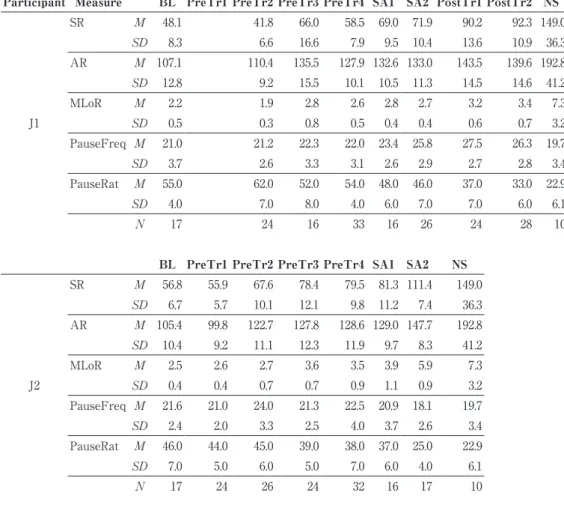
This section reports how fluency measures changed through the sub-periods of PreTr, SA, and PostTr. The focus of the analyses is to examine whether each measure increased significantly from 1) BL to PreTr4(i.e., from the beginning of the training to the end of PreTr), 2) PreTr4 to SA2(i.e., from the end of PreTr to the end of SA), and 3) SA2 to PostTr2(i.e., from the end of SA to the end of PostTr). It will also be examined whether the data of each measure are significantly different from those of NS at BL, PreTr4, SA2, and PostTr2 when necessary. Non-parametric t-tests(Mann-Whitney U tests) were used for the statistical tests. Figure 1 shows how SR(speech rate) changed
Figure 1.Mean(M) and one standard deviation(SD) of SR(Speech Rate)
averaged over narratives recorded within each of the sub-periods. J1/J2=Japanese participants.
as a function of the sub-periods in J1 and J2. SR indicates the number of words the speaker produces in a minute, including the amount of pause time. Thus, it reflects a combination of the speed of speaking(AR) and the pause ratio(PauseRat). It is shown that, in J2, SR improved substantially not just during PreTr, but also during SA. In J1, substantial improvement was observed during PreTr and PostTr, although SR improved to a lesser extent during SA.
Table 1 shows the means and the standard deviations of each measure as a function of the sub-periods in J1 and J2. Overall, all the other fluency measures, except for PauseFreq, show the same developmental pattern as SR in both J1 and J2. In J1, it is notable that some fluency measures(SR, AR, and MLoR) improved substantially between PreTr2 and PreTr3(i.e., the 3rd to 8th month). The mean difference between BL and PreTr4 was significant in SR(p<.0001), AR(p<.0001), and MLoR(p=.014), indicating that J1 became better at speaking English at a faster rate and with larger chunks of words through PreTr. During SA(between PreTr4 and SA), PauseRat, coupled with SR, showed a significant increase(p<.0001), indicating that J1 improved the ability to speak with a lesser amount of pause time through SA. AR and MLoR, however, showed only negligible changes from PreTr3 through SA2. Nevertheless, some fluency measures(SR, MLoR, and PauseRat) greatly improved in PostTr after SA, with the mean difference between SA2 and PostTr2 being significant in SR(p<.0001), MLoR(p<.0001), and PauseRat(p<.0001). This indicated that the PostTr further improved her ability to speak with longer sequences of words and with a lesser amount of pause time.
In J2, all the fluency measures, except for PauseFreq, significantly improved between BL and PreTr4(p<.0001), indicating that J2 made substantial overall improvement in the ability to speak with greater fluency through PreTr. It should be noted that all the fluency measures except PauseFreq demonstrated a substantial improvement in the latter half of the SA period(i.e., SA2), and that the rates of improvements were much higher than those of the previous sub-periods. The mean difference between PreTr4 and SA2 was significant in all these measures(p<.0001). Actually, the means of MLoR and PauseRat at SA2 were not significantly different from that of NS.
The overall results demonstrated that J1 and J2’s fluency level greatly improved through PreTr, SA, and PostTr(for J1). However, the rate of improvement across the sub-periods differed between the two participants. In J2, most of the fluency measures markedly improved in the latter period of SA. In J1, on the other hand, such considerable improvements occurred after SA. The results appear to suggest that L2 learning and
experiences during SA can have great impacts on L2 learners, but that the timing with which improvements of fluency manifest themselves may differ across individual learners. 3-2. Range measures
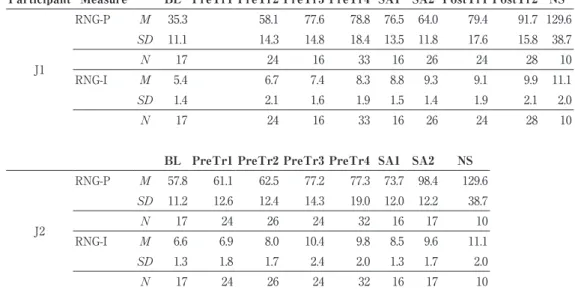
As is shown in Table 2, the pitch range(RNG-P) increased to approximate the NS mean across the sub-periods in both J1 and J2. In J1, RNG-P substantially increased between BL and PreTr3(i.e., 40 mels), but actually dropped at SA2. It substantially increased again between SA2 and PostTr2. In J2, RNG-P substantially increased between BL and PreTr3, fluctuated up to SA1, and markedly increased again at SA2. It is notable
Participant Measure BL PreTr1 PreTr2 PreTr3 PreTr4 SA1 SA2 PostTr1 PostTr2 NS
J1 SR M 48.1 41.8 66.0 58.5 69.0 71.9 90.2 92.3 149.0 SD 8.3 6.6 16.6 7.9 9.5 10.4 13.6 10.9 36.3 AR M 107.1 110.4 135.5 127.9 132.6 133.0 143.5 139.6 192.8 SD 12.8 9.2 15.5 10.1 10.5 11.3 14.5 14.6 41.2 MLoR M 2.2 1.9 2.8 2.6 2.8 2.7 3.2 3.4 7.3 SD 0.5 0.3 0.8 0.5 0.4 0.4 0.6 0.7 3.2 PauseFreq M 21.0 21.2 22.3 22.0 23.4 25.8 27.5 26.3 19.7 SD 3.7 2.6 3.3 3.1 2.6 2.9 2.7 2.8 3.4 PauseRat M 55.0 62.0 52.0 54.0 48.0 46.0 37.0 33.0 22.9 SD 4.0 7.0 8.0 4.0 6.0 7.0 7.0 6.0 6.1 N 17 24 16 33 16 26 24 28 10
BL PreTr1 PreTr2 PreTr3 PreTr4 SA1 SA2 NS
J2 SR M 56.8 55.9 67.6 78.4 79.5 81.3 111.4 149.0 SD 6.7 5.7 10.1 12.1 9.8 11.2 7.4 36.3 AR M 105.4 99.8 122.7 127.8 128.6 129.0 147.7 192.8 SD 10.4 9.2 11.1 12.3 11.9 9.7 8.3 41.2 MLoR M 2.5 2.6 2.7 3.6 3.5 3.9 5.9 7.3 SD 0.4 0.4 0.7 0.7 0.9 1.1 0.9 3.2 PauseFreq M 21.6 21.0 24.0 21.3 22.5 20.9 18.1 19.7 SD 2.4 2.0 3.3 2.5 4.0 3.7 2.6 3.4 PauseRat M 46.0 44.0 45.0 39.0 38.0 37.0 25.0 22.9 SD 7.0 5.0 6.0 5.0 7.0 6.0 4.0 6.1 N 17 24 26 24 32 16 17 10
Table 1.Mean(M) and one standard deviation(SD) of fluency measures averaged over
narratives recorded within each sub-period. J1/J2=Japanese participants; NS=native speakers of English; SR=speech rate; AR=articulation rate; MLoR=mean length of runs; PauseFreq=pause frequency; PauseRat; pause ratio.
that the timing of substantive increase in RNG-P approximately corresponded to that of the fluency measures in both J1 and J2, described in 3-1 above. The results indicated that as the participants improved the fluency in speaking English, they also improved the ability to use a wider range of pitch across syllables in a sentence.
It is also shown in Table 2 that the intensity range(RNG-I) also improved to approximate the NS mean across the sub-periods in both participants. In J1, RNG-I increased steadily to SA2, where the mean became not significantly different from the NS mean. The mean difference between PreTr4 and SA2 was significant(p=.001), indicating that, unlike RNG-P, RNG-I improved during SA. In J2, RNG-I increased up to PreTr3, where the mean became not significantly different from the NS mean. In sum, J1 improved the ability to use a range of intensity comparable to that of NS through PreTr and SA, while J2 achieved the NS level during PreTr(i.e., PreTr3).
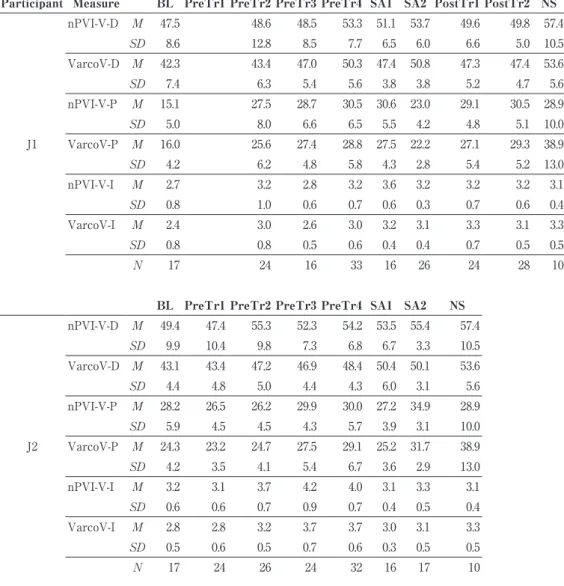
3-3. Rhythm measures
As is shown in Table 3, the normalized pairwise variability of duration(nPVI-V-D) and the variation coefficient of vowel duration(VarcoV) in J1 was relatively low at BL, with the mean significantly different from the NS mean(p<.015 for nPVI-V-D and
Participant Measure BL PreTr1 PreTr2 PreTr3 PreTr4 SA1 SA2 PostTr1 PostTr2 NS
J1 RNG-P M 35.3 58.1 77.6 78.8 76.5 64.0 79.4 91.7 129.6 SD 11.1 14.3 14.8 18.4 13.5 11.8 17.6 15.8 38.7 N 17 24 16 33 16 26 24 28 10 RNG-I M 5.4 6.7 7.4 8.3 8.8 9.3 9.1 9.9 11.1 SD 1.4 2.1 1.6 1.9 1.5 1.4 1.9 2.1 2.0 N 17 24 16 33 16 26 24 28 10
BL PreTr1 PreTr2 PreTr3 PreTr4 SA1 SA2 NS
J2 RNG-P M 57.8 61.1 62.5 77.2 77.3 73.7 98.4 129.6 SD 11.2 12.6 12.4 14.3 19.0 12.0 12.2 38.7 N 17 24 26 24 32 16 17 10 RNG-I M 6.6 6.9 8.0 10.4 9.8 8.5 9.6 11.1 SD 1.3 1.8 1.7 2.4 2.0 1.3 1.7 2.0 N 17 24 26 24 32 16 17 10
Table 2.Mean(M) and one standard deviation(SD) of the pitch range and intensity range
averaged over narratives recorded within each sub-period. J1/J2=Japanese participants; NS=native speakers of English; P=pitch range(in mel); RNG-I=intensity range(in dB).
p<.0001 for VarcoV-D). Further inspection of the data revealed that the values were lower at the very beginning of the training, showing that the mean nPVI-V-D and VarcoV-D of the first four recordings were 40.7 and 35.7, respectively. This finding supported the author’s impression that J1’s speech at the entry of the project was characterized by a succession of syllables with almost equal duration and flat pitch. From BL up to PreTr4, nPVI-V-D and VarcoV-D significantly increased(p<.0001) to the level where the means were not significantly different from the NS mean. During SA and PostTr, significant improvement of these measures was not observed.
In J2, nPVI-D-V was not significantly different from the NS mean at BL. Further inspection of the data did not show lower values at the very beginning of the recordings. NPVI-D-V increased to further approximate the NS mean during PreTr, with the mean difference between BL and PreTr4 being marginally significant(p=.08). Little further change was observed during SA. The mean VarcoV was significantly different from the NS mean at BL(p<.0001), and gradually increased up to SA1, where the mean became not significantly different from that of NS. The mean difference between BL and PreTr4 was significant(p<.0001), while that between PreTr4 and SA2 was not. VarcoV-D remained at the same level between SA1 and SA2.
These findings indicated the following. First, relatively low values of nPVI-D-V(i.e., up to lower 40’s) and VarcoV-D(i.e., up to lower 40’s) may indicate that the speaker’s English rhythm is characterized by a succession of syllables with almost equal length typically observed among novice Japanese learners of English. Supporting this observation, a new project in progress, designed to examine development of English rhythm production and fluency on current freshmen of the same SA program, has shown that nPVI-D-V and VarcoV-D of a less proficient group(N=5) was 39.3 and 43.3, averaged over the first five weeks of the program. Second, the present results suggested that nPVI-D-V and VarcoV-V may not be sensitive enough to measure possible further refinement of the timing control with respect to stress distinction. Although nPVI-D-V and VarcoV-V increased to the NS level by the end of PreTr, the results(to be reported below) on the degree of durational contrast between stressed and unstressed syllables(STCN-D, STFN-D) showed that these stress-related measures were far from the NS means at the end of the PreTr periods.
In J1, the normalized pairwise variability of pitch(nPVI-V-P) and the variation coefficient of pitch(VarcoV-P) were relatively low at BL, with the mean being significantly different from the NS means. The low values were consonant with the
Sub-Periods & NS
Participant Measure BL PreTr1 PreTr2 PreTr3 PreTr4 SA1 SA2 PostTr1 PostTr2 NS
J1 nPVI-V-D M 47.5 48.6 48.5 53.3 51.1 53.7 49.6 49.8 57.4 SD 8.6 12.8 8.5 7.7 6.5 6.0 6.6 5.0 10.5 VarcoV-D M 42.3 43.4 47.0 50.3 47.4 50.8 47.3 47.4 53.6 SD 7.4 6.3 5.4 5.6 3.8 3.8 5.2 4.7 5.6 nPVI-V-P M 15.1 27.5 28.7 30.5 30.6 23.0 29.1 30.5 28.9 SD 5.0 8.0 6.6 6.5 5.5 4.2 4.8 5.1 10.0 VarcoV-P M 16.0 25.6 27.4 28.8 27.5 22.2 27.1 29.3 38.9 SD 4.2 6.2 4.8 5.8 4.3 2.8 5.4 5.2 13.0 nPVI-V-I M 2.7 3.2 2.8 3.2 3.6 3.2 3.2 3.2 3.1 SD 0.8 1.0 0.6 0.7 0.6 0.3 0.7 0.6 0.4 VarcoV-I M 2.4 3.0 2.6 3.0 3.2 3.1 3.3 3.1 3.3 SD 0.8 0.8 0.5 0.6 0.4 0.4 0.7 0.5 0.5 N 17 24 16 33 16 26 24 28 10
BL PreTr1 PreTr2 PreTr3 PreTr4 SA1 SA2 NS
J2 nPVI-V-D M 49.4 47.4 55.3 52.3 54.2 53.5 55.4 57.4 SD 9.9 10.4 9.8 7.3 6.8 6.7 3.3 10.5 VarcoV-D M 43.1 43.4 47.2 46.9 48.4 50.4 50.1 53.6 SD 4.4 4.8 5.0 4.4 4.3 6.0 3.1 5.6 nPVI-V-P M 28.2 26.5 26.2 29.9 30.0 27.2 34.9 28.9 SD 5.9 4.5 4.5 4.3 5.7 3.9 3.1 10.0 VarcoV-P M 24.3 23.2 24.7 27.5 29.1 25.2 31.7 38.9 SD 4.2 3.5 4.1 5.4 6.7 3.6 2.9 13.0 nPVI-V-I M 3.2 3.1 3.7 4.2 4.0 3.1 3.3 3.1 SD 0.6 0.6 0.7 0.9 0.7 0.4 0.5 0.4 VarcoV-I M 2.8 2.8 3.2 3.7 3.7 3.0 3.1 3.3 SD 0.5 0.6 0.5 0.7 0.6 0.3 0.5 0.5 N 17 24 26 24 32 16 17 10
Table 3.Mean(M) and one standard deviation(SD) of the normalized pairwise variability
index and variability coefficient for vowels averaged over narratives recorded within each sub-period. J1/J2=Japanese participants; NS=native speakers of English; nPVI-V-D=normalized pairwise variability index of duration for vowels; nPVI-V-P=normalized pairwise variability index of pitch for vowels; nPVI-V-I=normalized pairwise variability index of intensity for vowels; VarcoV-D=variation coefficient of duration for vowels; VarcoV-P=variation coefficient of pitch(in mel) for vowels; VarcoV-I= variation coefficient of intensity(in dB) for vowels.
author’s observation about J1’s initial speeches described above, and was also in agreement with the relatively low pitch range(RNG-P) at the beginning of the PreTr (see Table 1). Both nPVI-V-P and VarcoV-P, however, increased substantially to PreTr2,
where the mean of nPVI-V-P was not significantly different from the NS mean. After this, both measures remained around the same level, except that they dropped substantially at SA2. This was consistent with the similar drop in the pitch range(RNG-P) in the same period. In J2, the mean of nPVI-V-P was not significantly different from the NS mean at BL. After BL, it fluctuated around the same level, while it further increased at SA2, with the mean difference between PreTr4 and SA2 being significant(p<.01). VarcoV-P, on the other hand, was significantly different from the NS mean at BL, and increased during the PreTr, with the mean difference between BL and PreTr4 being significant(p<.0001). It further increased at SA2, with the mean difference between PreTr4 and SA2 being significant(p<.01). In sum, J1 started at a rudimentary level in terms of the ability to vary pitch in sentences, but improved the ability in a relatively early stage of PreTr(i.e., PreTr2). J2 began with a more advanced level than J1, and continued to widen the degree of pitch variation(i.e., VarcoV-P) through the PreTr and SA.
In J1, the normalized pairwise variability of intensity(nPVI-V-I) was not significantly different from the NS mean at BL, and fluctuated around the same level throughout the sub-periods. The variation coefficient of intensity(VarcoV-I) was significantly different from the NS mean at BL(p=.003), but quickly increased by PreTr2 where a significant difference from the NS mean was not found. In J2, neither of nPVI-V-I or VarcoV-I was different from the NS mean at BL. In either J1 or J2, the intensity variability measures showed little developmental pattern through PreTr or SA.
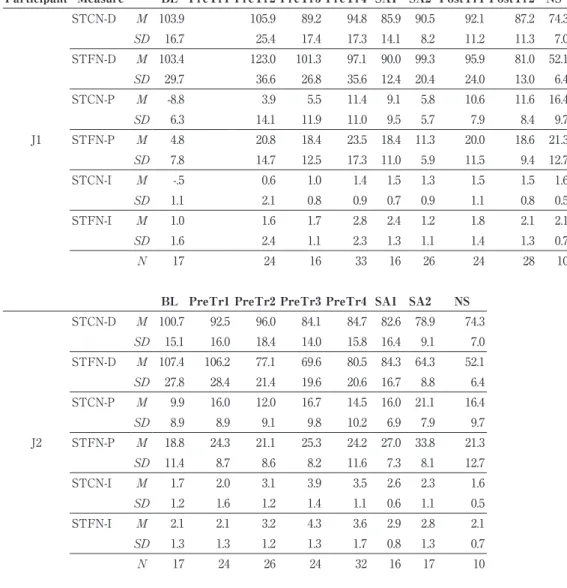
3-4. Stress-related measures
As is shown in Table 4, the durational proportion of unstressed to stressed syllables in content words(STCN-D) and that of function words to stressed syllables in content words(STFN-D) was around 100% at BL in both J1 and J2. It is shown that the duration of stressed and unstressed syllables was almost equal on the average, while the proportion was about 75% for content words and about 52% for function words in NS. The approximately equal duration of stressed and unstressed syllables is one of the characteristics of novice Japanese speakers of English, as described above.
In J1, STCN-D declined slightly through the PreTr, SA, and the PostTr, but the mean difference either between BL and PreTr4 or PreTr4 and PostF12 was not significant.
Participant Measure BL PreTr1 PreTr2 PreTr3 PreTr4 SA1 SA2 PostTr1 PostTr2 NS J1 STCN-D M 103.9 105.9 89.2 94.8 85.9 90.5 92.1 87.2 74.3 SD 16.7 25.4 17.4 17.3 14.1 8.2 11.2 11.3 7.0 STFN-D M 103.4 123.0 101.3 97.1 90.0 99.3 95.9 81.0 52.1 SD 29.7 36.6 26.8 35.6 12.4 20.4 24.0 13.0 6.4 STCN-P M -8.8 3.9 5.5 11.4 9.1 5.8 10.6 11.6 16.4 SD 6.3 14.1 11.9 11.0 9.5 5.7 7.9 8.4 9.7 STFN-P M 4.8 20.8 18.4 23.5 18.4 11.3 20.0 18.6 21.3 SD 7.8 14.7 12.5 17.3 11.0 5.9 11.5 9.4 12.7 STCN-I M -.5 0.6 1.0 1.4 1.5 1.3 1.5 1.5 1.6 SD 1.1 2.1 0.8 0.9 0.7 0.9 1.1 0.8 0.5 STFN-I M 1.0 1.6 1.7 2.8 2.4 1.2 1.8 2.1 2.1 SD 1.6 2.4 1.1 2.3 1.3 1.1 1.4 1.3 0.7 N 17 24 16 33 16 26 24 28 10
BL PreTr1 PreTr2 PreTr3 PreTr4 SA1 SA2 NS
J2 STCN-D M 100.7 92.5 96.0 84.1 84.7 82.6 78.9 74.3 SD 15.1 16.0 18.4 14.0 15.8 16.4 9.1 7.0 STFN-D M 107.4 106.2 77.1 69.6 80.5 84.3 64.3 52.1 SD 27.8 28.4 21.4 19.6 20.6 16.7 8.8 6.4 STCN-P M 9.9 16.0 12.0 16.7 14.5 16.0 21.1 16.4 SD 8.9 8.9 9.1 9.8 10.2 6.9 7.9 9.7 STFN-P M 18.8 24.3 21.1 25.3 24.2 27.0 33.8 21.3 SD 11.4 8.7 8.6 8.2 11.6 7.3 8.1 12.7 STCN-I M 1.7 2.0 3.1 3.9 3.5 2.6 2.3 1.6 SD 1.2 1.6 1.2 1.4 1.1 0.6 1.1 0.5 STFN-I M 2.1 2.1 3.2 4.3 3.6 2.9 2.8 2.1 SD 1.3 1.3 1.2 1.3 1.7 0.8 1.3 0.7 N 17 24 26 24 32 16 17 10
Table 4.Mean(M) and one standard deviation(SD) of the acoustic differences in duration,
pitch, and intensity of vowels between stressed and unstressed syllables of content words and between unstressed vowels of content words and function words, averaged over narratives recorded within each of the sub-periods. J1/J2=Japanese participants; NS=native speakers of English; STCN-D=proportion of vowel durations in unstressed to stressed syllables of content words; STCN-P=pitch difference(in mel) between unstressed to stressed vowels of content words; STCN-I=intensity difference(in dB) between unstressed to stressed vowels of content words; STFN-D=proportion of vowel durations in stressed syllables of content words to vowels in monosyllabic function words; STFN-P= pitch difference(in mel) between stressed vowels of content words and vowels in function words; STFN-I=intensity difference(in dB) between stressed vowels of content words and vowels in function words.
After a slight decrease through the PreTr and SA, STFN-D showed a substantial decrease during the PostTr, with the mean difference between SA2 and PostTr2 being significant(p<.0001). The results indicated that J1 had a great deal of difficulty modifying the vowel duration of stressed and unstressed syllables through the PreTr and SA, although she was able to significantly modify the vowel duration of function words in PostTr. In J2, both STCN-D and STFN-D significantly decreased from BL to PreTr4 (p=.001). STCN-D decreased slightly(but non-significantly) through SA, while STFN-D
substantially decreased at SA2, with the mean difference between PreTr4 and SA2 being significant(p=0.005). The results indicated that J2 was able to significantly modify the ability to control the vowel duration of stressed and unstressed syllables in content and function words through PreTr, and that the ability became further refined through SA, especially in terms of reducing the duration of function words.
STCN-P was negative in J1 at BL, showing that the averaged pitch in stressed syllables was lower than those in unstressed syllables in content words. It substantially improved up to PreTr4, where the mean was not significantly different from the NS mean. During SA and the PostTr, STCN-P stayed at the same level, except for the marked drop at SA2. STFN-P improved substantially between BL and PreTr2, where the mean was not significantly different from the NS mean. After this, it remained about the same level, while it showed a notable drop at SA2. The results indicated that J1 achieved an acceptable level of the ability to make use of pitch in differentiating stressed and unstressed syllables during PreTr, although she had much less difficulty learning to do so for function words than content words.
In J2, neither STCN-P nor STFN-P was significantly different from the NS mean at BL partly due to relatively large variability in both groups. Inspection of the data at the very beginning of the training, however, found that the mean STCN-P and STFN-P averaged over the first four recordings was relatively low(2.57 and 13.0, respectively). This showed that J2 had initial difficulty differentiating stressed and unstressed syllables by means of pitch, but that STCN-P and STFN-P quickly increased within the first few months. Both STCN-P and STFN-P increased substantially between BL and PreTr1, and further showed a marked increase at SA2, with the mean difference between PreTr4 and SA2 being significant(p=.02 for STCN-P, and p=.002 for STFN-P). The results indicated that J2 relatively quickly improved the ability to differentiate stressed and unstressed syllables by means of pitch both in content and function words.
that the averaged intensity was larger in unstressed than stressed syllables. The means of STCN-I and STFN-I were significantly different from the NS mean at BL. Both of them substantially increased during the PreTr, with the means not significantly different from the NS mean at PreTr4. It is notable that STFN-I dropped considerably at SA2, as was found for STFN-P. In J2, both STCN-P and STCN-I were at the same level as those of the NS mean. Further inspection of the data in the earliest recordings, however, revealed that the mean STCN-P and STCN-I averaged over the first four recordings was relatively low (0.68 and 1.71, respectively), showing that J2 had a certain level of initial difficulty, and
that they quickly increased within the first two months of PreTr. STCN-P and STCN-I further increased during the PreTr, with the mean difference between BL and PreTr4 being significant(p<.001). These results showed that both J1 and J2 had relatively little difficulty to improve the ability to make use of intensity in distinguishing stressed and unstressed syllables in content and function words.
It is also notable that many of J1’s stress-related measures together with rhythm measures regressed during the latter half of the SA period. One possibility for this seeming regression is that J1 might have focused on the quality of the speeches in terms of content without being able to pay sufficient attention to phonetic aspects of speech. As a matter of fact, the levels of vocabulary(based on JACET8000) and readability(based on Flesch-Kincaid readability tests)4) of the produced speeches during SA2 was the
highest among the sub-periods of PreTr and SA. This might have contributed to increasing productive vocabulary and formulaic expressions which could be accessed and retrieved with greater speed, which, in turn, might have led to significant improvement in fluency during PostTr.
4. Discussion and Conclusion 4-1. Summary of the present findings
The present study was designed to examine development of fluency and English speech rhythm among two adult Japanese learners of English(J1 and J2) during a five-month study-abroad program and speech training before and after SA. The following were the major findings of the study.
1) Fluency measures(SR, AR, MLoR, PauseFreq, PauseRat)
Most fluency measures significantly improved toward those of NS in both participants through the training and SA. The timing and rate of improvement, however, differed
between the two participants and across the fluency measures. In J2, most frequency measures considerably improved in the latter part of SA(i.e., SA2), while in J1, such across-the-board improvement occurred during PostTr.
2) Pitch range(RNG-P) and intensity range(RNG-I)
The pitch range(RNG-P) significantly improved through PreTr in both participants. As was found in the fluency measures, the substantial improvement in the subsequent sub-periods was observed during SA in J2, but PostTr in J1.
3) Rhythm measures(nPVI-V-D/P/N, VarcoV-D/P/N)
The measures on variability of vowel durations(nPVI-D, VarcoV-D) in J1 and J2 increased to approximate the NS means by the end of PreTr and SA1, respectively. Thus, significant improvements on these measures were not found afterwards. The results, however, should be interpreted with caution because they may not mean that the participants achieved the NS-level timing control of vowels before SA, as further improvement of vowel timing control was observed in differentiation of stress and unstressed vowels. The measures on variability of pitch(nPVI-P, VarcoV-P) in J1 started at a relatively low level, but reached a plateau at a relatively early stage of PreTr, with no significant improvement being observed during SA or PostTr. In J2, both measures started at a relatively high level, and remained around the similar level from BL to SA1, but further improved at SA2 where substantial improvement in fluency and pitch range took place.
4) Stress-related measures(STCN-D/P/I, STFN-D/P/I)
The proportion of unstressed to stressed syllables started at around 100% for both participants, meaning the average duration of stressed and unstressed syllables and monosyllabic function words were almost equal. In J1, STCN-D and STFN-D slightly declined during PreTr, but fluctuated around 85-100% through PreTr and SA, showing little improvement during SA. STFN-D, however, showed a significant improvement at PostTr2. In J2, STCN-D and STFN-D significantly decreased through PreTr, and the latter made a further significant decrease at SA2.
The difference between stressed and unstressed syllables in pitch(STCN-P, STFN-P) started at relatively low values in J1, but improved to the NS level by the end of PreTr for STCN-P and at PreTr2 for STFN-P. No further significant improvement was observed during SA or PostTr. In J2, both STCN-P and STFN-P achieved the NS level as early as PreTr1, but STFN-P made a significant further increase at SA2. The difference between stressed and unstressed syllables in intensity(STCN-I, STFN-I) started at
relatively low values in J1, but improved to the NS level by the end of PreTr. In J2, STCN-I and STFN were already at the NS level. No further improvement was observed during SA or PostTr in J1, and during PreTr or SA in J2.
4-2. Limitations of the present study
First of all, as a case study with two participants, the present results may not be generalizable to other learners with different English proficiencies or in other learning settings. However, the present results found some important individual differences that might not have been captured in the averaged data from a large data sample. It is believed that a combination of large-scale studies and case studies as the present study would be ideal to truly understand the process of L2 phonological learning. Second, as there is no control group who is trained but did not participate in SA, it is difficult to evaluate the true effects of SA. However, the author’s observation of another English program without SA suggests that it is difficult to expect the magnitude of improvement demonstrated by the present participants among the students who do not go to SA during the same period. Third, the data on the NS’s evaluation of the speeches are not available at present. Thus, it is not clear how the improvement in the fluency measures, rhythm measures, and stress-related measures may be related to the NS’s evaluation of comprehensibility and foreign-accentedness. Future study is certainly needed to examine this point.
4-3. Fluency measures
One of the purposes of the present study was to assess whether and how the participants’ fluency developed during PreTr, SA, and PostTr. Previous studies generally supported the conclusion that SA is more effective in improving fluency than formal instruction(FI) at home(Valls-Ferrer & Mora, 2014). This conclusion was supported by J2’s data as most of the fluency measures increased at a much faster rate during the latter half of the SA period than during PreTr(see Figure 1). Her data indicated that the fluency improved in terms of 1) the speed of speaking(SR and AR), 2) the size of the chunk of words produced(MLoR), 3) the frequency of pauses(PauseFreq), and 4) the proportion of pauses(PauseRat). As a matter of fact, the means of the latter three measures at the latter period of SA were not significantly different from the NS means. There is little doubt that this level of fluency would not have been achieved without the SA settings where she had ample opportunities to interact with NS and other
English-speaking people in her daily lives. The data on J1, on the other hand, found that such an across-the-board improvement in fluency took place in PostTr. During SA, the speed frequency measures(AR and MLoR) stayed at the same level, while the proportion of pauses(PauseRat) still remained at a rudimentary level(i.e., 48%). One possible reason for the lack of improvement during SA might be that the fluency level at the entry into SA was not sufficiently high such that the five-month study abroad period was not long enough to trigger significant improvement in fluency. It might also be possible that the gap between the input provided by very fluent speakers and her own fluency level was so large that it was difficult to make use of the rich input for improving her own fluency. This might suggest that it would be beneficial for learners with low fluency levels to receive practice specifically focused on improving fluency in the institution they attend during SA. During PostTr, however, the fluency in J2 improved comprehensively in not just SR and MLoR, but also PauseRat. Although it would not be possible to assess what would have happened to the fluency level without SA, it is plausible that the learning and experience she received during SA might have laid a foundation on which she further improved the fluency after she came back from SA.
In the present study, individual pronunciation training, in addition to FI, was conducted to ensure that a certain level of proficiency would be achieved before entry into SA. The data clearly indicated that the training was effective in improving the fluency during PreTr, given the previous findings that the fluency level failed to improve when only FI was provided before SA(Valls-Ferrer & Mora, 2014). The present data, however, indicated that it takes relatively a long period of time to improve fluency even with the individual training. In J1, for example, significant increase in fluency measures was evidenced in PreTr3, which was six to eight months after the start of the training. In J2, AR and SR started to increase at PreTr2(i.e., 6 to 8 month from the start), while MLoR and PauseRat started to improve at PreTr3(i.e., 9 to 11 months from the start). These results underscore the difficulty of improving L2 fluency in spontaneous speech under FI settings even with individual training. It is also notable that both participants experience a relatively long stretch of plateau before the next significant increase in some fluency measures. In J1, for example, SR, AR and PauseRat significantly improved at PostTr1 which was 10 months after PreTr3. In J2, it took 8 to 11 months for the next significant improvement in the fluency measures to occur before SA2. These findings suggest that improving fluency to the next level may require a great deal of input and output learning and experiences, regardless of whether they come from individual