IRUCAA@TDC : Clinical evaluation of osseointegrated implants in Tokyo Dental College Hospital (third report): long-term observation of functioning survival rate of fixtures
8
0
0
全文
(2) Bull. Tokyo dent. Coll., Vol. 44, No. 3, pp. 169⬃175, August 2003. 169. Clinical Report. CLINICAL EVALUATION OF OSSEOINTEGRATED IMPLANTS IN TOKYO DENTAL COLLEGE HOSPITAL (THIRD REPORT): LONG TERM OBSERVATION OF FUNCTIONING SURVIVAL RATE OF FIXTURES YUKO MIYASHITA, TOMOHIKO ARATAKI, TAKAO NOMURA, HIROKI SUZUKI, SYUNICHI ATSUTA, HIROMI HOTTA, ICHIRO SHIMAMURA, YASUSHI ADACHI and MASATAKA KISHI Department of Removable Partial Prosthodontics, Tokyo Dental College, 1-2-2 Masago, Mihama-ku, Chiba 261-8502, Japan. Received 24 January, 2003/Accepted for Publication 20 August, 2003. Abstract The objective of this report was to review 365 cases of Brånemark Implant Bridge including 1,444 fixtures in patients of Tokyo Dental College Chiba Hospital. The term of implantation was divided into several phases; less than 1 year, from 1 year to 3 years, from 3 years to 5 years, from 5 years to 7 years, from 7 years to 10 years, more than 10 years, and the survival rate was calculated for each phase. The removal rate of fixture after connecting the superstructure was 13% in maxillary cases and 2% in mandibular cases. The functioning survival rate in maxillary cases slightly decreased from 91% in less than 1 year to 87% after more than 10 years; however, the functioning survival rate in mandibular cases was about 99% in all periods. The removal rate of fixtures per patient was 23% in maxillary cases and 6% in mandibular ones. The average removal number of fixtures was 1.8 in maxillary cases and 1.2 in mandibular ones. The removal of the fixture occurred most frequently at less than 1 year in maxillary cases, but there was no tendency for a pattern of removal of fixture in mandibular cases. Key words:. Survival rate —Osseointegrated implant —Retrospective survey. INTRODUCTION The osseointegrated implant bridge (OIB) developed by Professor Brånemark provides excellent results in the majority of cases1–3,7). OIB was introduced to the Tokyo Dental College Hospital in 1983. From 1983 to 2000,. 1,444 fixtures were applied to maxillae and/ or mandibles in about 365 patients. Although a few fixtures had to be removed, excellent progress was observed6,8). There are some reports on the survival rate of OIB fixtures, but only a few have considered the functioning survival rate, which considers their ability to. This clinical report had been published in Japanese in Shikwa Gakuho (102: 779–786, 2002).. 169.
(3) 170. Y. MIYASHITA et al. Table 1 Total number of cases corresponding to each classification Duration. Less than 1 year. Between 1 and 3 years. Between 3 and 5 years. Between 5 and 7 years. Between 7 and 10 years. More than 10 years. Maxillary Edentulous. 25. 25. 18. 18. 17. 17. Maxillary Partially Edentulous. 69. 69. 49. 49. 13. 13. Mandibular Edentulous. 98. 98. 87. 87. 87. 87. Mandibular Partially Edentulous. 173. 173. 138. 138. 53. 53. Kind. continue to bear functional occlusal stress4,5). In this report, the functioning survival rate of fixture was discussed from the point of view of 17 years of clinical experience.. MATERIALS AND METHODS The subjects of this report were 365 adult patients who had 1,444 fixtures installed in their maxillae and/or mandibles. The kind of OIB cases in these 365 cases were 25 maxillary edentulous, 69 maxillary partially edentulous, 98 mandibular edentulous, and 173 mandibular partially edentulous. The total numbers of cases in each classification are listed in Table 1. These 365 cases were classified into 6 groups on the basis of the clinical record of the duration of the time from when the fixture was connected to superstructure until its removal: less than 1 year, between 1 year and 3 years, between 3 years and 5 years, between 5 years and 7 years, between 7 years and 10 years, and more than 10 years. The decision to remove the superstructure and/or fixtures was based on loss of its osseointegration6,8).. RESULTS 1. Removal rate of OIB fixtures In maxillary and/or mandibular, edentulous and/or partially OIB cases, there were some cases in which the fixture was removed after. the superstructure was connected. Because they had lost osseointegration, 43 of 365 fixtures in maxillary cases and 19 of 1,079 fixtures in mandibular cases were removed. 1) In the maxillary OIB cases, it was necessary to remove 14 of 158 fixtures in the edentulous cases and 20 of 207 fixtures in the partial edentulous cases in the period of less than 1 year, 1 of 148 fixtures in the edentulous cases in the period of between 1 and 3 years, and 5 of 100 fixtures in the edentulous cases and 2 of 141 cases in the partially edentulous cases in the period of between 3 and 5 years; however, only 1 of 49 fixtures was removed in edentulous cases after that (Table 2). Thus, the removal rate in maxillary OIB cases was 9.3% (34/365) in the period of less than 1 year, 0.3% (1/ 364) in the period of between 1 and 3 years, and 2.9% (7/241) in the period of between 3 and 5 years. After 7 years, it was exceedingly low. 2) In the mandibular OIB cases, it was necessary to remove 4 of 546 fixtures in the edentulous cases and 5 of 533 fixtures in the partially cases in the period of less than 1 year, 2 of 1,533 fixtures in the edentulous cases and 2 of 491 cases in the partially edentulous cases in the period of between 1 and 3 years, and 4 of 486 fixtures in the edentulous cases and 2 of 420 cases in the partially edentulous cases in the period of between 3 and 5 years; however, no fixture was removed in either group after that.
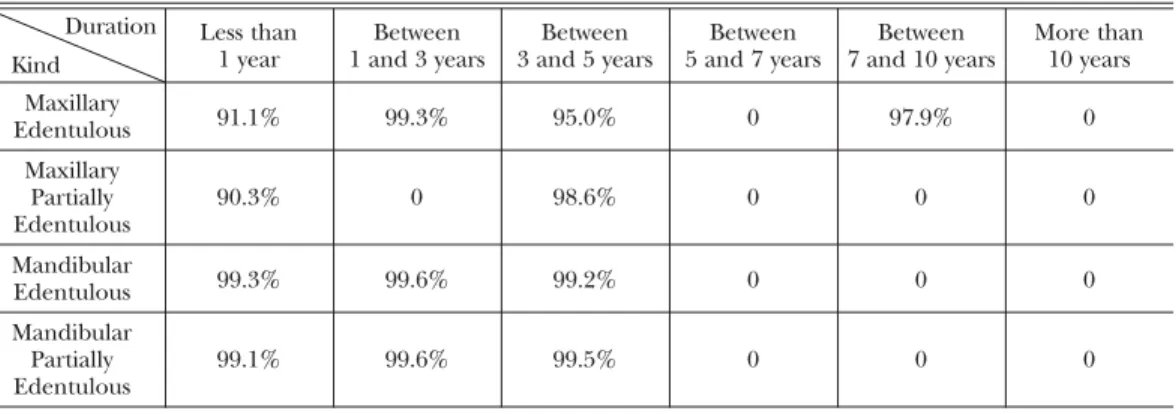
(4) 171. FUNCTIONING SURVIVAL RATE OF FIXTURES. Table 2 Removal rate of OIB fixture Duration. Less than 1 year. Between 1 and 3 years. Between 3 and 5 years. Between 5 and 7 years. Between 7 and 10 years. More than 10 years. Maxillary Edentulous. 14/158. 1/148. 5/100. 0/96. 1/49. 0/29. Maxillary Partially Edentulous. 20/207. 0/198. 2/141. 0/81. 0/44. 0/14. Mandibular Edentulous. 4/546. 2/533. 4/486. 0/448. 0/372. 0/228. Mandibular Partially Edentulous. 5/533. 2/491. 2/420. 0/300. 0/174. 0/59. Kind. Table 3 Functioning survival rate of OIB fixture in each period Duration. Less than 1 year. Between 1 and 3 years. Between 3 and 5 years. Between 5 and 7 years. Between 7 and 10 years. More than 10 years. Maxillary Edentulous. 91.1%. 99.3%. 95.0%. 0. 97.9%. 0. Maxillary Partially Edentulous. 90.3%. 0. 98.6%. 0. 0. 0. Mandibular Edentulous. 99.3%. 99.6%. 99.2%. 0. 0. 0. Mandibular Partially Edentulous. 99.1%. 99.6%. 99.5%. 0. 0. 0. Kind. (Table 2). Thus, the removal rate in mandibular OIB cases was 0.8% (9/1,079) in the period of less than 1 year, 0.4% (4/1,024) in the period of between 1 and 3 years, 0.6% (6/906) in the period of between 3 and 5 years. After that, the rate fell to zero. 2. Functioning survival rate of OIB fixtures The removal rate in maxillary OIB cases in each period was 9.3% in less than 1 year, 0.3% in between 1 and 3 years, 2.9% in between 3 and 5 years, and almost 0% after more than 7 years. The functioning survival rate in each period is the inverse ratio of the removal rate of the fixtures in each period, as shown in Table 3. We defined the functioning survival rate of OIB fixtures as the ratio of the total number of fixtures connected to superstructures to those finally remaining. The function-. ing survival rate in each period in maxillary cases was 90.7% at less than 1 year, 99.7% between 1 and 3 years, and 98.1% between 3 and 5 years. Cumulatively, the functioning survival rate in maxillary cases was 90.7% at less than 1 year, 90.4% (0.907⳯0.997) between 1 and 3 years, 88.7% (0.981⳯0.904) in between 3 and 5 years, and it remained at almost 87% after more than 10 years. Similarly, the functioning survival rate in mandibular cases was 99.2% at less than 1 year, 98.8% (0.996⳯0.992) between 1 and 3 years, 98.2% (0.994⳯0.988) in between 3 and 5 years, and it remained at 98.2% after more than 10 years. It was defined the functioning survival rate of OIB fixtures within each period as the ratio of the number of functioning fixtures at the beginning to those at the close of an observation period. The functioning survival rate of.
(5) 172. Y. MIYASHITA et al. Table 4 Functioning survival rate of OIB fixture Duration. Less than 1 year. Between 1 and 3 years. Between 3 and 5 years. Between 5 and 7 years. Between 7 and 10 years. More than 10 years. Maxillary Edentulous. 91.2%. 90.6%. 86.0%. 86.0%. 84.3%. 84.3%. Maxillary Partially Edentulous. 90.3%. 90.3%. 89.0%. 89.0%. 89.0%. 89.0%. Mandibular Edentulous. 99.3%. 98.9%. 98.1%. 98.1%. 98.1%. 98.1%. Mandibular Partially Edentulous. 99.1%. 98.7%. 98.2%. 98.2%. 98.2%. 98.2%. Kind. the OIB fixtures in the maxillary edentulous cases was 91.2% at less than 1 year, 90.6% between 1 and 3 years, 86.0% in between 3 and 7 years, and 84.3% after more than 7 years. In the maxillary partially edentulous, it was 90.3% at less than 1 year, 90.3% between 1 and 3 years, and 89.0% at more than 3 years (Table 4). The functioning survival rate of the OIB fixtures in the mandibular edentulous cases was 99.3% at less than 1 year, 98.9% between 1 and 3 years, and 98.1% at more than 3 years. In the mandibular partially edentulous cases, it was 99.1% at less than 1 year, 98.7% between 1 and 3 years, and 98.2% at more than 3 years (Table 4). 3. Frequency of cases with fixture removal 1) In the maxillary edentulous OIB cases, it was necessary to remove 7 fixtures from 25 patients within less than 1 year, 1 fixture of 25 patients in between 1 and 3 years, and 1 fixture of 18 patients in between 3 and 5 years; only 1 fixture of 17 patients was removed in between 7 and 10 years (Table 5). Thus, the frequency of removal per patient was 28.0% in less than 1 year, 4.0% between 1 and 3 years, 5.6% between 3 and 5 years, and very low very after that. In the maxillary partially edentulous OIB cases, it was necessary to remove 12 fixtures from 69 patients within less than 1 year, 0 fixtures from 69 patients in between 1 and 3 years, and 1 fixture from 49 patients in between 3 and 5 years, but no fixtures were. removed after that (Table 5). Thus, the frequency of removal per patient was 17.4% in less than 1 year, 0% in between 1 and 3 years, 2.0% in between 3 and 5 years, and 0% after that. Thus, in all the maxillary OIB cases, the frequency of removal per patient was 20.2% in less than 1 year, 1.1% in between 1 and 3 years, 3.0% in between 3 and 5 years, and almost 0% after that. 2) In the mandibular edentulous OIB cases, it was necessary to remove 4 fixtures from 98 patients in less than 1 year, 2 fixtures from 98 patients in between 1 and 3 years, and 2 fixtures from 87 patients in between 3 and 5 years, but no fixtures were removed after more that (Table 5). Thus, the frequency of removal per patient was 4.1% in less than 1 year, 2.0% in between 1 and 3 years, 2.3% in between 3 and 5 years, and 0% after that. In the mandibular partially edentulous OIB cases, it was necessary to remove 4 fixtures from 173 patients in less than 1 year, 2 fixtures from 173 patients in between 1 and 3 years, and 2 fixtures from 138 patients in between 3 and 5 years, but no fixtures were removed after that (Table 5). Thus, the frequency of removal per patient was 2.3% in less than 1 year, 1.2% in between 1 and 3 years, 1.4% in between 3 and 5 years, and 0% after that. Thus, in all the mandibular OIB cases, the frequency of removal per patient was.
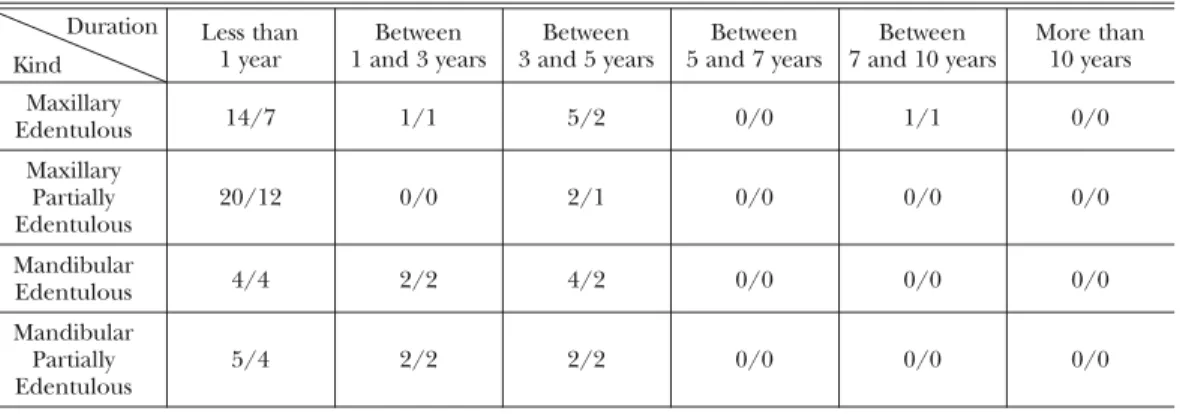
(6) 173. FUNCTIONING SURVIVAL RATE OF FIXTURES. Table 5 Frequency of cases who removed the fixture Duration. Less than 1 year. Between 1 and 3 years. Between 3 and 5 years. Between 5 and 7 years. Between 7 and 10 years. More than 10 years. Maxillary Edentulous. 7/25. 1/25. 1/18. 0/18. 1/17. 0/17. Maxillary Partially Edentulous. 12/69. 0/69. 1/49. 0/49. 0/13. 0/13. Mandibular Edentulous. 4/98. 2/98. 2/87. 0/87. 0/87. 0/87. Mandibular Partially Edentulous. 4/173. 2/173. 2/138. 0/138. 0/53. 0/53. Kind. Table 6 Numbers of fixture per patients who removed the fixture Duration. Less than 1 year. Between 1 and 3 years. Between 3 and 5 years. Between 5 and 7 years. Between 7 and 10 years. More than 10 years. Maxillary Edentulous. 14/7. 1/1. 5/2. 0/0. 1/1. 0/0. Maxillary Partially Edentulous. 20/12. 0/0. 2/1. 0/0. 0/0. 0/0. Mandibular Edentulous. 4/4. 2/2. 4/2. 0/0. 0/0. 0/0. Mandibular Partially Edentulous. 5/4. 2/2. 2/2. 0/0. 0/0. 0/0. Kind. 3.0% in less than 1 year, 1.5% in between 1 and 3 years, 1.8% in between 3 and 5 years, and 0% in more than 5 years. 4. Number of fixtures removed per patient with fixture removal 1) In the maxillary edentulous OIB cases, it was necessary to remove 14 fixtures from 7 patients in less than 1 year, 1 fixture from 1 patient in between 1 and 3 years, and 5 fixtures from 2 patients in between 3 and 5 years; only 1 fixture from 1 patient was removed in 7 and 10 years after that (Table 6). Thus, the removal number of fixtures per patient was 2.0 in less than 1 year, 1.0 in between 1 and 3 years, 2.5 in between 3 and 5 years. In the maxillary partially edentulous OIB cases, it was necessary to remove 20 fixtures from 12 patients in less than 1. year, 0 in between 1 and 3 years, and 2 fixtures from 1 patient in between 3 and 5 years; no fixtures were removed after that (Table 6). Thus, the removal number of fixtures per patient was 1.7 in less than 1 year, 0 in between 1 and 3 years, 0.5 in between 3 and 5 years, and 0 after that. Then, in all the maxillary OIB cases, the removal number of fixtures per patient was 1.8 in less than 1 year, 1.0 in between 1 and 3 years, and 2.3 in between 3 and 5 years. 2) In the mandibular edentulous OIB cases, it was necessary to remove 4 fixtures from 4 patients in less than 1 year, 2 fixtures from 2 patients in between 1 and 3 years, and 4 fixtures from 2 patients in between 3 and 5 years; no fixtures were removed in 7 and 10 years after that (Table 6). Thus, the removal number of fixtures per patient was 1.0 in.
(7) 174. Y. MIYASHITA et al.. less than 1 year, 1.0 in between 1 and 3 years, and 2.0 in between 3 and 5 years. In the maxillary partially edentulous OIB cases, it was necessary to remove 5 fixtures from 4 patients in less than 1 year, 2 fixtures from 2 patients in between 1 and 3 years, and 2 fixtures from 2 patients in between 3 and 5 year; no fixtures were removed after that (Table 6). Thus, the removal number of fixtures per patient was 1.3 in less than 1 year, 1.0 in between 1 and 3 years, 1.0 in between 3 and 5 years, and 0 after that. Thus, in the mandibular OIB cases, the removal number of fixture per patient was 1.1 in less than 1 year, 1.0 in between 1 and 3 years, 1.5 in between 3 and 5 years.. between 1 and 3 years, 89% in between 3 and 5 years, and it then remained at almost 87% until more than 10 years. The rate was slightly decreased in the early period compared with our second report that showed 93% in less than 1 year, 92% in between 1 year and 3 years, 92% in between 3 and 5 years, 92% in between 5 years and 7 years, and 87% in more than 7 years. However, there were no differences between the two reports in later periods in maxillary cases. The functioning survival rate in mandibular cases was 99% in less than 1 year, 99% in between 1 and 3 years, 98% in between 3 and 5 years, and it then remained at 98% until more than 10 years. This rate for all periods (98%) was slightly increased in mandibular cases, compared with that in our second report (97%).. DISCUSSION 1. Removal rate of OIB fixtures The removal rate in maxillary cases in each period was 9.3% in less than 1 year, 0.3% in between 1 and 3 years, and 2.9% in between 3 and 5 years, so the removal rate was greatest in the first year. Therefore, it appears that fixture removal rate may be concentrated in the first year in maxillary cases. In contrast, the removal rate in mandibular cases was 0.8% in the first year, 0.4% in between 1 and 3 years, 0.7% in between 3 and 5 years, so the removal rate was similar in each period. Therefore, it appears that the fixture removal rate may remain fairly constant in each period in mandibular cases. The removal rate in all periods was 11.8% in maxillary cases and 1.8% in mandibular cases; these values were increased in maxillary cases and decreased in mandibular cases compared with those in our second report, which recorded 9.6% in maxillary cases and 3.1% in mandibular cases. However, the differences in the rates for both maxillary and mandibular cases were less than only 2%. 2. Functioning survival rate of OIB fixtures The functioning survival rate in maxillary cases was 91% in less than 1 year, 90% in. 3. Frequency of cases with fixture removal In the maxillary OIB cases, the frequency of removal per patient was 20% in less than 1 year, 1% in between 1 and 3 years, 3% in between 3 and 5 years, and almost 0% after more than 5 years. Therefore, the frequency of fixture removal was 1 of 5 patients in less than 1 year in maxillary cases and very low thereafter. In the mandibular OIB cases, the frequency of removal per patient was 3.0% in less than 1 year, 1.5% in between 1 and 3 years, 1.8% in between 3 and 5 years, and 0% in more than 5 years. Therefore the frequency of fixture removal per patient was 1 of 33 patients in less than 1 year in maxillary cases and very low thereafter. Thus, the number in maxillary cases in the first year was 1.5 times that in mandibular cases. 4. Number of fixtures removed per patient with fixture removal In the maxillary OIB cases, the number of fixture removals per patient was 1.8 in less than 1 year, 1.0 in between 1 and 3 years, and 2.3 in between 3 and 5 years. In the mandibular OIB cases, the number of fixture removals per patient was 1.1 in less than 1 year, 1.0 in.
(8) 175. FUNCTIONING SURVIVAL RATE OF FIXTURES. between 1 and 3 years, and 1.5 in between 3 and 5 years. Thus, the number in maxillary cases in the first year was 1.5 times that in mandibular cases.. CONCLUSION The objective of this report was to examine the functioning survival rate of OIB fixtures. The subjects were 365 patients who had 1,444 fixtures of Brånemark Implant Bridge implanted in Tokyo Dental College Chiba Hospital. The term divided into several phases; less than 1 year, between 1 year and 3 years, between 3 years and 5 years, between 5 years and 7 years, between 7 years and 10 years, and more than 10 years. The functioning survival rate was calculated in each phase. The results were as follows. 1. The removal rate of fixtures after connecting the superstructure was 13% in maxillary cases and 2% in mandible cases. There was a 6 fold difference between maxillary cases and mandibular cases. 2. The functioning survival rate in maxillary cases slightly decreased from 91% in less than 1 year to 87% in more than 10 years. However, the functioning survival rate in mandibular cases was about 99% in all periods. 3. The fixture removal rate per patient was 23% in maxillary cases and 6% in mandibular cases. There was a 4 fold difference between maxillary cases and mandibular cases. 4. The average number of fixture removals per patient was 1.8 in maxillary cases and 1.2 in mandibular cases. There was a 1.5 fold difference between maxillary cases and mandibular cases. 5. The removal of fixture occurred most frequently at less than 1 year in maxillary cases, but there was no tendency for the removal of fixture at any particular time in mandibular cases.. REFERENCES 1) Albrecksson, T., Zarb, G., Worthington, P. and Erriksson, R.A. (1986). The long term efficacy of currently used implants; A review and proposed criteria for successes. Int J Oral Maxillofacial Implant 1, 11–25. 2) Albrecksson, T. (1988). A multicenter report on osseointegrated implants. J Prosthet Dent 60, 75–84. 3) Brånemark, P-I., Hansson, B.O., Adell, R., Breine, U., Lindstrom, L., Hallen, O. and Ohman, A. (1977). Osseointegrated Implants in the Treatment of the Edentulous Jaw: Experience from a 10-year Period. Almqvist & Wiksell International, Stockholm, Sweden. 4) Ivanoff C-J., Grondahl, K., Bergstrom, C., Lekholm, U. and Brånemark P-I. (2000). Influence of bicortical or monocortical anchorage on maxillary implant stability: A 15-year retrospetive study of Brånemark system implant. Int J Oral Maxillofacial Implant 15, 103–110. 5) Lekholm, U., Gunne, J., Henry, P., Higuchi, K., Linden, U., Bergstrom, C. and Steenberghe, D. (1999). Survival of the Brånemark implant in partially edentulous jaws: A 10-year prospective multicenter study. Int J Oral Maxillofacial Implant 14, 639–645. 6) Sekine, H., Yoshida, K., Komiyama, Y., Adachi, Y., Kishi, M. and Shigematsu, T. (1993). Functioning survival rate of the osseointegrated implants (First report). Bull Tokyo dent Coll 34, 177–181. 7) Steenberghe, D. (1989). A retrospective multicenter evaluation of the survival rate of osseointegrated fixtures supporting fixed partial prostheses in the treatment of partial edentulism. J Prosthet Dent 61, 217–222. 8) Yoshida, K., Takamatsu, Y., Adachi, Y., Kishi, M., Sekine, H. and Shigematsu, T. (1996). Functioning survival rate of the fixtures and superstructure osseointegrated implants: Ten years of progress in Tokyo Dental College Hospital (Second report). Bull Tokyo dent Coll 37, 55–62. Reprint requests to: Dr. Yuko Miyashita Department of Removable Partial Prosthodontics, Tokyo Dental College, 1-2-2 Masago, Mihama-ku, Chiba 261-8502, Japan.
(9)
図


関連したドキュメント
Table 3 Multivariate analysis of variables and overall survival in 25 patients Variables HR (95% CI) P value Primary organ (other vs retro.) 1.32 0.562 Histological
Pim-3, a proto-oncogene with serine ⁄ threonine kinase activity, is aberrantly expressed in human pancreatic cancer and phosphorylates Bad to block Bad-mediated apoptosis in
Keywords: homology representation, permutation module, Andre permutations, simsun permutation, tangent and Genocchi
For staggered entry, the Cox frailty model, and in Markov renewal process/semi-Markov models (see e.g. Andersen et al., 1993, Chapters IX and X, for references on this work),
If f (x, y) satisfies the Euler-Lagrange equation (5.3) in a domain D, then the local potential functions directed by any number of additional critical isosystolic classes
В данной работе приводится алгоритм решения обратной динамической задачи сейсмики в частотной области для горизонтально-слоистой среды
Then it follows immediately from a suitable version of “Hensel’s Lemma” [cf., e.g., the argument of [4], Lemma 2.1] that S may be obtained, as the notation suggests, as the m A
Definition An embeddable tiled surface is a tiled surface which is actually achieved as the graph of singular leaves of some embedded orientable surface with closed braid
