九州大学学術情報リポジトリ
Kyushu University Institutional Repository
森林における土壌呼吸に関する生態学的研究
大橋, 瑞江
九州大学農学研究科林業学専攻
https://doi.org/10.11501/3166808
出版情報:Kyushu University, 1999, 博士(農学), 課程博士 バージョン:
権利関係:
Ecological Studies
on Forest Soil Respiration
MIZUE OHASHI 2000
Contents
Chapter 1 Introduction
1.1 Background 1.2 History 1.3 Objective
Chapter 2 Methodological study of soil respiration
2.1 Effects of carbon dioxide concentration and wind speed on soil respiration using the chamber method
2 .1.1 In traduction
2 .1.2 Measuring System 2.1.3 Methods
2.1.4 Results and Discussion
4 9 16
20
2.2 Estimation of soil respiration from fluctuation of C02 concentration, wind speed and temperature on the
soil surface in a oak (Quercus gla uca) forest • 0 27 2.2.1 Introduction
2.2.2 Methods 2.2.3 Results 2.2.4 Discussion
Chapter 3 Spatial and temporal variability in soil respiration from a forest floor
3.1 Measurement of carbon dioxide evolution from a Japanese cedar ( Crypton1eria japonica D. Don) forest floor using an
open-flow chamber method · o 46
3 .1.1 In traduction 3 .1.2 Study Area 3.1.3 Methods 3.1.4 Results 3. 1. 5 Discussion
3.2 Spatial and temporal variability of soil respiration in a Japanese cedar ( Crypton1eria japonica D .Don) forest
floor using an open-flow chamber method o o 65
2
3.2.1 In traduction 3.2.2 Study Area 3.2.3 Methods 3.2.4 Results 3.2.5 Discussion
Chapter 4 Effect of aboveground vegetation on soil respiration
4.1 Contribution of root respiration to total soil respiration in a Quercus acutissima and a Crypton1eria japonica
planting pots 81
4.1.1 Introduction 4.1.2 Methods
4.1.3 Results and Discussion
4.2 Contribution of root respiration to total soil respiration in an Japanese cedar (Crypton1eria japonica D.Don)
artificial forest 89
4.2.1 Introduction 4.2.2 Study Area 4.2.3 Methods 4.2.4 Results 4.2.5 Discussion
4.3 Changes in soil respiration following aboveground growth in red oak (Quercus acu tis sima) and Japanese cedar
(Cryptomeria japonica) forest stand · · 108 4.3.1 Introduction
4.3.2 Study Site 4.3.3 Methods 4.3.4 Results 4.3.5 Discussion
Chapter 5 Conclusion
Summary
Acknowledgements References
3
.. 129
.. 13 3 .. 138 .. 139
Chapter 1 Introduction 1.1 Background
Atmospheric carbon fixed by photosynthesis of trees partly returns to the air through their respiration. However, most carbon stored above-and below-ground woody organs and are subsequently provided to soil as litterfall. These organic carbon co1n pounds provided to the soil are stored and decomposed into C02 as a result of soil microbial respiration. Most C02 evolves from soil to air with the C02 produced by root respiration (Fig. 1-1-1). This C02 evolution from soil was described as soil respiration (Bodenat1nung) by Lundegardh (1924).
Pettenkofer (1873) measured soil respiration first as an indicator of soil microorganism activity. Waksman and Thm1ey (1928) demonstrated an increased bacterial response when soil was fertilized and early studies of soil respiration were carried out generally in order to ascertain fertility of soil in the laboratory and under agronomic conditions (Darbishire, et al., 1907; Gainey, 1919; Lundegardh, 1924;
Russell and Appleyard, 1915; Smith and Brown, 1931; Schlesinger, 1977). In the forest, soil respiration has been measured as an excellent indicator, representing the sum of soil metabolic activity, such as root system and soil microorganism, in order to estimate net primary production (IGrita and Hozumi, 1966; Kirita, 1971d; Hagihara et al., 1984; Kurser, 1989) and carbon cycling of the ecosystems (Witkamp, 1969; Kucera and Kirkham, 1971; Edwards and Sollins, 1973;
Anderson, 1978; Simona et al., 1989).
Recently, the significance of the study of soil respiration has beco1ne more relevant because of environmental problems including
4
Atrmsphere
J�
Respiratim A1at.osynthesi s
Soil
respiration
1Fcrest vegetatim >--- (.Abo.teg-cx.nd)
� - � Root svstem -
Oissdutia1 � (ed ONgrcx.nd)
Ma-ches
�iratim
Litter Deccrrpositim Lit:t.er
,
Carron storage �
Fig. 1-1-1 Carbon cycle in the forest ecosystem.
5
global change in C02 concentration in the arr. Global carbon is currently at about 750 GtC in atmosphere, 600 GtC in the world's standing biomass, and 1500 GtC in the world's soils (Fig. 1-1-2).
Atmospheric C02 concentration is increasing rapidly by about 3.4 GtC per year due to fossil fuel burning and deforestation. Consequently, elevated co.) concentration would lead to global warming (Kirschbaum, 1995; Raich and Schlesinger, 1992). The global warming may increase carbon flux from soil resulting from microbial respiration. Warming may also increase root respiration due to higher photosynthesis and more primary products (Tsuruta, 1994; Pajari, 1995). As a result, if the increase of the carbon flux resulting from stimulation of microbial respiration and root respiration exceeds carbon fixing through photosynthesis, terrestrial forest ecosystems may change from carbon sink to carbon source and the increase in C02 concentration in the air may be accelerated. Jenkinson et al. (1991) ran soil models for different temperature conditions and showed that a future tern perature increase could lead to the release of large quantities of carbon from worlds soils. On a global scale, soil respiration in terrestrial ecosystems is estimated at 50 GtC/yr and equal to or greater than the estimated global carbon terrestrial net primary production.
By comparison fossil fuel burning and deforestation add about 5 GtC/yr and 1.6 GtC/yr, respectively. Even a small change in the soil respiration flux may profoundly influence the atmospheric C02 budget (Raich and Schlesinger, 1992; Kirschbaum, 1995).
Soil respiration is also important in evaluating the capacity of forest ecosystems to fix atmospheric carbon. Carbon fixing by photosynthesis and storage in above- and below -ground is expected to contribute to decreased carbon dioxide in the air. Houghton and Woodwell (1989) warned that global warming will continue into the
6
0 • • • ••
Atmosphere 750
Fig.
1-1-2
The global carbon cycle, showing reservoirs (in GtC) and fluxes (GtC/yr) relevant to anthropogenic perturbation as an annual average over the period1980
to1989
(Houghton et al.,1995).
7
indefinite future unless we take deliberate steps, such as a massive program of reforestation, in order to slow or stop such warming. In addition, at the 3rd Conference of Parties to the United Nations Framework Convention on Climate Change in Kyoto in December 1977, the l(yoto Initiative was put forward starting that carbon storage by forestation is one means of preventing global warming. However, carbon storage capacity in forest ecosystems is regulated by the balance between carbon fixation through photosynthesis and carbon emission through respiration. Therefore, soil respiration, one of the major fluxes of carbon, is important in order to gain a clear view of the carbon storage of the ecosystems (Freijer and Bouten, 1991). However, data on amount, fluctuation and relevant factors of soil respiration is still inadequate (Haibara et al., 1993; Hanson et al., 1993).
8
1.2 History
Methodological approaches
Unfortunately, a wide variety of measurement techniques of soil respiration are utilized, making it difficult to compare results from different studies (Raich et al., 1992; Vose et al., 1995). Soil respiration has been measured using many techniques, such as the eddy correlation micrometeorological technique (Dugas, 1993; Baldocchi et al., 1997; Takeuchi, 1997), Fick's diffusion model (De Jong and Schappert, 1971; Osozawa and Hasegawa, 1995; Mariko et al., 1994;
Eguchi et al., 1997), and chamber technique (Monteith et al., 1964;
Illiita and Hozumi, 1966). However, since each technique has its own limitations (Inoue, 1986; Sparling and West, 1990; Behara et al., 1990;
Dugas, 1993; Mariko et al., 1994; Komori and Seki, 1995; Shimada et al., 1998), accumulation of soil respiration data is still imperfect.
The chamber technique is the most common and direct method to measure soil respiration and is used widely (Schlesinger, 1977; Singh and Gupta, 1979; Gupta and Singh, 1981; Inoue, 1986). There are some variations in this technique and many researchers have discussed accuracy, the mobility and simplicity of each system (Witkamp, 1966;
Kanemasu et al., 197 4; Haibara et al., 1993; Mariko et al., 1994; Bekku et al., 1995; Uchida et al., 1997).
The static C02 absorption method determines C02 quantity released from the soil using a covered chamber, by irreversibly binding C02 to NaOH or soda lime in the chamber. This system is convenient under field conditions because of its simple construction and low-price (Monteith et al., 1964; Kirita and Hozumi, 1966; Kirita, 1971a �d;
Parker et al., 1983; Buyanovsky et al., 1986; Meier et al., 1993;
RDbertson et al., 1995). However, some reports showed that the
difference in environmental factors inside and outside the chamber may influence readings (Kucera and Kirkham,
1971;
Edwards and Sollins,1973).
Nakadai et al.(1993)
reported that C02 concentration in the static chamber decreased greatly due to :irreversible binding, thus, leading to overestimation of C02 evolution. Consequently, a closed ch3lnber method, where C02 in the chamber is sampled periodically by syringes and which measured subsequently C02 concentration, was designed (Parkinson,1981;
Bekku et al.,1995).
The open-flow method calculates soil respiration from differences in C02 concentrations in the air flowing in and out of the chamber. This method is expected to have higher accuracy because environmental conditions :in the chamber can be maintained parallel to ambient conditions (Nakadai et al.,
1993;
Vase et al.,1995).
However,this method is considered to be less attractive for field measurements because it often requires bulkly equipment and an electric power supply (Kirita and Hozumi,
1966;
Haibara et al.,1993;
Bekku et al.,1995).
Inaddition, Inoue
(1986)
noted that ventilation rate through the open-flow chamber might affect readings. Gyokusen and Saito(1995)
addressedthese problems by producing a portable soil respiration measuring system which could regulate C02 concentration, and wind speed in the chamber.
The closed-dynamic method or commercial soil respirometer (e.g.
Li-Cor, Lincoln,
NE)
obtains measurements while C02 concentration in the chamber is increases due to air circulation through the system (Norman et al.,1992;
Lassard et al.,1994;
Garcia et al.,1997).
Somehave a fan in the chamber to make natural wind speed (Hanson et al.,
1993).
Therefore, this method is also expected to retain accurate readings because of the regulation of environment conditions in the chamber. However, unwieldy or expensive respirometers are difficultto operate under field conditions.
Factors affecting soil respiration
Fluctuation in soil respiration from the forest floors can result fron1 the interaction of many biological, physical and chemical factors.
Accmnulation of data on the fluctuation of soil respiration and factors that regulate that fluctuation are critical for the understanding soil respiration (Schlesinger, 1977; Reicosky and Lindstonn, 1993; l(eith et al., 1997; Striegel and Wickland, 1998).
Temporal fluctuation in soil respiration corresponds mainly to changes in two environmental factors, soil moisture and temperature, because of the sensitive response of soil microbial activities and root respiration to these factors (Buyanovsky et al., 1986; Bowden et al., 1998; Singh and Gupta, 1977; Yata, 1989). Though seasonal change in soil respiration is influenced by the two factors, nevertheless the effect of the factors varies depending on geographical location (Singh and Gupta, 1977; Ohashi et al., 1999b). The strong effect of temperature (Kirita, 1971d; Anderson, 1973; Chiba and Tsutsumi, 1967; Mathes and Schriefer, 1985; Sakai and Tsutsumi, 1987), soil moisture (Carlyle and Than, 1988; Holt et al., 1990), and both factors (Buyanovsky et al., 1986; Schlentner and Van Cleve, 1985; Pajari, 1995) have been reported.
Many studies reported that soil respiration increased exponentially (Kucera and Kirkha1n, 1971; Anderson, 1973; Hagihara et al., 1984;
Sakai a11d Tsutsumi, 1987; Simono et al., 1989) or proportionally (Gupta and Singh, 1981; Mathes and Schrifer, 1985; RDchette et al., 1991; Lessard et al., 1994) with increasing temperature.
Q10
value,calculated as the changing rate of soil respiration when the temperature increased by 10 cc (Johnson and Thronley, 1985), is a convenient index in comparing the sensitivity of soil respiration with
11
soil temperature (Sakai and Tsutsumi, 1987; Raich and Schlesinger, 1992). Recently,
Q10
values are important to predict the response of ecosystems to global warming (Thwnsend et al., 1992; Kirschbaum, 1995).Q10
values tend to be higher in cooler regions compared with warm regions (Thwnsend et al., 1992; Kirschbaum, 1995), ranging 1.8�4.1 in temperate forests (Sakai and Tsutsumi, 1987), the mean of
Q10
values for soil respiration being approximately 2.0 (Singh and Gupta, 1977; Raich and Schlesinger, 1992). Diurnal changes in soil respiration have not been investigated thoroughly because the static chamber method, which has been used widely in field measurement of soil respiration, often requires a long time (several hours) to gain a reading (Nakadai et al., 1996). Some studies reported that diurnal changes in soil respiration increased in the daytime and decreased at night, corresponding to temperature (Witkamp, 1969; Kanemasu et al.,
1974; Parker et al., 1983; Grahammer et al., 1991; Osozawa and Hasegawa, 1995; Nakadai et al., 1996). However, no clear fluctuation was observed in some forests because of the absence of significant diun1al change in environmental factors inside the forests (Kirita, 1971d; Kurser, 1989; Gyokusen and Saito, 1995). Nocturnal increases in soil respiration have also been reported (Witkamp, 1969; Edwards and Sollins., 1973; Eguchi et al., 1997) because of changes in root respiration (Eguchi et al., 1997) and of thermal convection of subsurface air to the surface (Witkamp, 1969).
Spatial variability of soil respiration is caused by many factors directly and indirectly. In addition, the relative importance of these factors appears to vary greatly depending on geographical and environmental conditions at the site. Laboratory and field experiments have shown that spatial variability of soil respiration depends on soil aeration (Yabuki and Kitaya, 1984; Liebig et al., 1995),
soil organic matter (Seto et al.,
1978;
Seneviratne and Van Holm,1998),
soil nitrogen contents (Kowalenko et al.,
1978;
Seneviratne a11d Va11 Holm,1998;
Johnson et al.,1994),
soil phosphorus nutrition (Keith et al.,1997)
and soil pH (Sparling and West,1990).
However, in naturalecosyste1ns, effects of these factors have not been fully understood and more data under natural conditions is required (Naganawa et al.,
1989;
Maggs and Hewett,
1990;
Vose et al.,1997).
In forest ecosystems, though some reports show variability of soil respiration on slopes, they were dependent on different factors. Shimada et al.(1998)
reportedhigher soil respiration at lower sites than the flux at the other sites on a slope of a Japanese cedar and cypress forest. They considered the high soil respiration to be caused by high soil organic matter. Simona et al.
(1989)
reported higher soil respiration on the upper part of the slope in a young Japa11ese cypress forest because of differences in soil moisture conditions. Hanson et al.(1993)
measured seasonal patterns of soil respiration at four topographically distinct locations in an upland oal{forest in Tennessee and observed an isolated period when valley-bottom locations had reduced soil respiration relative to other topographic locations. They reported that lower soil respiration was consistent with reduced fine root density and elevated coarse fraction percentage.
Effect of vegetation
In forest ecosystems, not only microbial respiration but also root respiration n1ay contribute a considerable amount to soil respiration (Singh and Gupta,
1977;
Behara,1990).
Therefore, changes in root biomass and root activity, depending on aboveground vegetation conditions, change root respiration rate, thereby affecting soil respiration (Gupta and Singh,1981;
Eguchi et al.,1997).
Changes in aboveground vegetation also influence the microclimate in forest13
ecosystems (Mathes and Schriefer, 1985; Bauhus and Bartsch, 1995), and soil nutrient status (Maggs and Hewett, 1990) and affect soil respiration indirectly.
Measuring or estimating root respiration is one of the key points
m understanding the drastic changes in soil respiration. Many attempts have made to estimate root respiration contribution to total soil respiration. However, each technique used to measure root respiration was shown to have limitations (Nakane et al., 1983;
Katagiri, 1988; Ohashi and Saito, 1998) due to the difficulty in separating root systems from soil. Bowden et al. (1993) estimated root contribution to total soil respiration as 33% by terminating live root activity through construction of trenches and root barriers. They also reported that nearly two thirds of soil respiration can be attributed to root activity (root respiration and decomposition of root litter).
I(awahara (1976) considered that natural root respiration may be equal to the difference between soil respiration and fallen litter in a mature red pine and oak forest, and estimated root contribution to total soil respiration to be 18"---23%. Katagiri (1988) calculated natural root respiration from the linear relationship between soil respiration and root biomass. He estimated the proportion of root respiration to total soil respiration as 20"---40% in a deciduous broad-leaved forest. Using similar methods, Behara et al. (1990) estimated the proportion of root respiration as 50.5% in tropical forests. Nakane et al. (1983) estimated the proportion of root to total soil respiration as 50 % by clear-felling of a mature red pine forest. They concluded that the proportion of root respiration to soil respiration may converge at arotmd 50 %, irrespective of the type of forest concerned, when soil organic carbon is in dynamic equilibrium in the forest ecosystem.
Many human activities, such as felling and planting, can clearly
have significant effects on the extent of soil respiration because they suddenly change volume and activity of root systems and microclimate of the ecosystems (Ewel et al., 1987; Wagai et al., 1998). Recently;
studies on effects of human activity on soil respiration has become more important because forestation is expected to decrease carbon in the air, where as it is feared that deforestation will increase carbon. Some reports suggest that clear-felling or artificial gap formation cause the diminution of root respiration, thereby decreasing soil respiration (Nakane et al., 1983; Brumme, 1995; Striegl and Wickland, 1998).
'!bland and Zak (1994) reported that the decomposition of dead roots after clear-felling offsets the decrease in soil respiration. It was also reported that soil respiration increased after clear-felling (Tulaphitak et al., 1985; Hendrickson et al., 1989; Londo et al,. 1999).
1. 3
Objective
Soil respiration from the forest floor may profoundly influence the atmospheric C02 budget and the carbon fixing capacity of the ecosystems even to a small degree because of its large flux. However, data on the amount, fluctuation and affecting factors of soil respiration is still inadequate because a wide variety of measurement techniques have had limitations, causing problems in the comparison of results.
In addition, in forest ecosystems, measurement of soil respiration has been restricted to a limited number of locations because of lack of portability of measuring systems. Therefore, in this study, a portable soil respiration measuring system which enhanced the precision of current models was established, and factors affecting soil respiration from the forest floor were investigated using the system.
The objective of chapter 1 is to study soil respiration methodologically. The chamber method, used widely for measuring soil respiration, has a significant problem namely that the difference in environmental factors, such as C02 concentration and wind speed, inside and outside the chamber may influence readings. However the effect of these environmental factors has not been investigated in detail.
Therefore, a portable soil respiration measuring system which could regulate temperature, C02 concentration, and wind speed in a chamber was developed, and the effects of C02 concentration and wind speed on soil respiration were investigated in section 1 (1.1).
Since environmental factors which affect soil respiration, such as wind speed, C02 concentration and temperature, fluctuate continuously in natural conditions, soil respiration may be affected by these environmental factors on the forest floor. However, soil
respiration has been measured in a chamber environment in many studies of soil respiration but effects of natural fluctuation of these factors were not taken into account. Therefore, diurnal fluctuation of soil respiration was estimated from natural changes in temperature, C02 concentration and wind speed on forest floor in section 2 (2.2).
The objective of chapter 2 is to investigate factors affecting tern poral and spatial fluctuation of soil respiration from the forest floor using the portable open-flow measuring system. In section 1, seasonal changes in soil respiration from a Japanese cedar forest floor were investigated in order to discover the relationships between soil respiration rates and other environmental factors such as soil temperature and soil moisture. The effect of thinning on soil respiration was also examined by com paring soil respiration in a intact section and a thinned section of a Japanese cedar forest stand.
Seasonal changes in soil surface C02 concentration, estimated from soil respiration rates, were also determined (3.1).
Soil respiration, the sum of plant root and microbial respiration, changes spatially and temporally due to many factors, such as environmental conditions and soil characteristics. Thus, soil respiration may fluctuate considerably on a slope because the complicated configuration may produce an imbalance of affecting factors on soil respiration. However, there are few studies that determine the spatial and tern poral variability of soil respiration on a forest slope due to limitations in the portability of measurement system.
In section 2, the spatial and temporal variability of soil respiration was determined on a Japanese cedar forest slope using the portable open
flow soil respiration measuring system. The sampling points were located in a grid -like pattern on the slope in order to determine the
spatial variability of soil respiration, and seasonal and diurnal change were measured at the points (3.2).
The objective of chapter 3 is to examme the effect of aboveground vegetation on soil respiration. In forest ecosystems, not only microbial respiration but also root respiration may contribute a significant proportion of soil respiration. Therefore, changes in root respiration depending on aboveground vegetation conditions would affect soil respiration. However, it is difficult to know the relationship between root respiration fluctuation and soil respiration because of technical limitations in separating root respiration from soil respiration.
The objective of section 1 is to estimate the contribution of root respiration to total soil respiration using some planting pots. It is assumed that differences in soil respiration rate from the pots before and after plant removal (shoot and root) is equal to root respiration.
Effect of shoot removal only on soil respiration was also examined ( 4.1).
In section 2, contribution of root respiration to total soil respiration in a Japanese cedar forest was estimated using the tree felling method. Soil respiration rate was compared between an undisturbed area and the center of an artificial small gap. The root respiration rate was calculated from the difference. In this study, the effect of artificial gap formation on soil respiration was also examined by estimating the soil respiration gradient from the center of the gap into the stand (4.2).
In young forests, changes in aboveground vegetation, such as planting, growing and felling, may change root respiration, thereby affecting soil respiration. Aboveground vegetation may also affect microclimate in forest ecosystems and affect soil respiration indirectly.
However, most soil respiration studies have been conducted in the
mature forest ecosystems in which soil carbon cycles are already in dynamic equilibrium. Therefore, the objective of section 3 is to examine effects of vegetation change on soil respiration. 'Ib the end, oak and Japanese cedar stands were grown for 3 years from seed and cuttage, respectively, and partially clear-felled one-and-a-half years after planting (4.3).
Chapter 2
Methodological study ofsoil
respiration2.1 Effects of carbon dioxide concentration and wind speed using the chamber method on soil respiration
2.1.1 Introduction
Soil respiration is a phenomenon which releases carbon dioxide from the soil surface into the atmosphere. It is used as an index of site productivity (Yabuki and Kitaya, 1984) or as a measure of the carbon cycle of a forest ecosystem (Nakadai et al., 1993). The chamber method is used widely for measuring soil respiration. It can be classified into two types, the open-flow system and the closed system.
The most important problem in these two systems is that the internal environments of the chambers differ greatly from that of the external environment. The prime environmental factors in the chambers affecting soil respiration are temperature (Seto et al., 1978), C02 concentration (Nakadai et al., 1993), ventilation rate (Inoue, 1986), and wind speed (Gyokusen and Saito, 1995). However the effect of these environmental factors have not been investigated in detail because the chamber method for measuring soil respiration is incomplete. In this study, a portable soil respiration measuring system which could regulate temperature, C02 concentration, and wind speed in a chamber was developed, and the effects of C02 concentration and wind speed on soil respiration were investigated.
2.1.2 The measuring system
A diagram of the measuring system is shown in Fig. 2-1-1.
This system is similar to the portable soil respiration measuring system used in the previous study (Gyokusen and Saito, 1995), except
Thermo
Fan
Respiration chamber
C02 analyzer
Regulating cock
-_-:
-il_____J
Temp.controllerI
:--�._________,
Transformer
Fig. 2-1-1 Outline of the soil respiration measuring system. Bold line shows the air flow and dotted shows the electric line.
for the addition of a regulator of wind speed and temperature. It consists of a respiration chamber, a C02 analyzer, a C02 concentration regulator, air tank, air pump, generator, and a wind speed and temperature regulator. Bold lines in Fig. 2-1-1 represent the flow of air and dotted lines, the flow of electricity. The chamber consists of a 5 mm acrylic thick cylinder 15 em in diameter and 13 em in height. A thermo cooler, to which is attached a fan (SL-5FF, Nippon Brower., Japan) is installed on top of the chamber, and, together with the temperature controller (SL-C4, Nippon Brower, Japan), regulates temperature. The fan with the current transformer (DC Power Supply, Nippon Stabilizer Industry, Japan) is used to regulate wind speed. Carbon dioxide concentration is regulated by passing the air flow through soda lime. A portable light measuring system (SPB-3, Shimadzu, Japan) is used to analyze C02.
2.1.3
Method
furmeasuring
Soil respiration was measured on the 13 October 1994 in a
28-
year-old oak
(Quercus glauca)
forest. After the Ao layer was removed, the bottom of the chamber was buried about 1 em into the ground, and air flow rate was maintained at 1.5 Irn-1. Soil respiration readings become stable five minutes after starting the system. Temperature in the chamber was maintained at20
oc which was close to the temperature outside the chamber, and the C02 concentration was increased from0
ppm to360
ppm in five gradations. Wind speed was increased from0
ms-1 to 5 ms-1 in six gradations at every C02 concentration level. Soil respiration was calculated by the following formula using C02 concentrations (ppm) flowing in and out of the chamber asCn1
and�ut
R=f{1{�ut- CJ273/A(273+ 1)
where, R (mg C02m-2hr-1) is the soil respiration,
V(
hr-1) is the air-flow rate, A (m� is the bottom area of the chamber, T(C) is the temperature of the air-flow meter, and Kis the coefficient0.00196.
2.1.4 Results and Discussion
Fig.
2-1-2
shows the relationships between the C02 concentrations in the chamber and the soil respiration rates at each wind speed. The soil respiration rate decreased with increasing C02 concentration, and it increased with increasing wind speed.Nakadai et al.
(1993)
noted that decreasing C02 concentration gave an impetus to increasing the soil respiration. They supposed that the acceleration in the soil microbial respiration rate (Koizumi et al.,1991)
to be one of the causes. Gyokusen and Saito(1995)
citedincreases in physical diffusion which depended on the CO.
concentration gradient as one cause. The soil respiration rate in this study changed in proportion to the C02 concentration. It was thought therefore, that the change in soil respiration with changing C02 concentration was brought about mainly by physical diffusion, because a curvilinear increase in the soil microbial respiration rate with decreasing C02 concentration, as reported by Koizumi et al.
(1991),
wasnot observed.
The soil respiration rate increased as the wind speed increased.
Considering both the increase in the soil respiration rate as the ventilation rate increased (Inoue,
1986)
and the change in the soil respiration rate, with or without a wind speed (Gyokusen and Saito,1995),
this result was interpreted as the C02 diffusion resistance by the ground as being reduced by wind. Inoue(1986)
noted that the soil respiration rate attained equilibrium when the ventilation rate of the chamber exceeded13
times per hour. However, in this study, the soil�
I '-
...c N I 4
E N
0 0 013
...__..
-ro (1) '-
c 2
0
(f) 0
Wind speed (ms-1): t. 4.5
A 4.0
0 3.4
• 3.2
0 2.5
• 0.0
0 1 00 200 300 400 500
C02 concentration
(ppm)
Fig. 2-1-2 Relationships between soil respiration rate and C02 concentration at each wind speed.
Regression equation: 4.5
ms·1,y = 4.82 - 0.01 06x (r = 1.00); 4.0
ms·I,y= 4.00- 0.00867 x (r= 1.00); 3.2
ms·1,y
= 2.52 - 0.00522x (r = 1.00); 2.5
ms·I,y = 0.199 -
0.000201 x (r= 0.85). Temperature in the chamber was
maintained at 20
°C.respiration rate tended to increase even under 4.5 ms-1 of wind speed, and the C02 diffusion resistance from the ground further decreased under thus faster wind speeds. In most measurements of the soil respiration rate using the chamber method, the value was affected by the wind speed. Therefore, it is difficult to measure the soil respiration rate without taking the wind speed effect into consideration. On the regression line shown in Fig. 2-1-2, points of intersection with the X axis show the C02 concentration in the chamber when the soil respiration rate is
0
mgC02 m-2hr-1. This indicates that the C02 concentration in the chamber is equal to the C02 concentration of the soil surface, because the C02 diffusion from the soil causes. C02 concentration values when the soil respiration rate is0
mgC02 m-2 hr-1 are990,
475, 482, 473, 461, and 454 ppm from the slow wind level, showing a decreasing tendency as wind speed increases. This means that if the wind speed increases, the C02 supply from the soil is delayed, and the soil surface C02 concentration decreases. However when the wind speed is0
ms-\ Gout may not be used as the C02 concentration value in the chamber because the air in the chamber was not moved and the C02 concentration in the chamber is not uniform. Soil surface C02 concentration is an important factor affecting the growth of forest floor vegetation (Bazzaz and Williams,1991).
This research demonstrated a new method of measuring soil surface C02 concentration by changing the C02 concentration in the chamber.In this study, it was confirmed that the wind speed and the C02 concentration greatly affect soil resp:iration. The chamber method is used widely to measure soil resp:iration. However wind speed in the chamber had not been considered as an important factor. In particular, in the closed system, there is almost no wind in the chamber, whereas in the open-flow system, wind speed changes owing to differences in the
measuring machines. Therefore, it is important to consider the effect of wind speed on soil respiration values when measuring soil respiration. Concerning the effects of C02 concentrations, it also has been confirmed that soil respiration is underestimated under the closed system because C02 concentration in the chamber is very small due to the C02 absorption medicine. Whereas it is overestimated in an open
flow system as the C02 concentration in the chamber is more than ambience. From these results, it can be seen that wind speed and C02 concentration must be specified clearly when soil respiration is measured by the chamber method.
2.2 Estimation of soil respiration from fluctuation of C02 concentration, wind speed and temperature on the soil surface in a oak
(Quercus gla uca)
forest2.2.1 Introduction
Temporal change in soil respiration is influenced mail1ly by two principal environmental factors, temperature and moisture (Singh and Gupta, 1977). T he strong effect of temperature (IGrita, 1971d;
Anderson, 1973; Chiba, 1975; Sakai and Tsutsumi, 1987), soil moisture (Carlyle and Than, 1988; Holt et al., 1990), and both factors combined (Schlentner and Van Cleve, 1985; Pajari, 1995) have been reported.
The effect of these two factors varies depending on geographical location and season. It is supposed that in a temperate environment like Japan, fluctuation in soil respiration is mainly influenced by soil temperature (Chiba and Tsutsumi, 1967; Seto et al., 1978; Hagihara et al., 1984; Sal{ai and Tsutsumi, 1987; Simono et al, 1989).
Soil respiration also influenced other environmental factors, such as C02 concentration and wind speed. Nakadai et al. (1993) and Gyokusen and Saito (1995) reported that soil respiration decreases with increasing C02 concentration n1 the chamber. Inoue (1986) reported an increase in soil respiration rate as the ventilation rate increased.
Deference in the soil respiration rate with and without wind speed in the chamber has been also reported (Gyokusen and Saito, 1995).
Hanson et al. (1993) and Ohashi et al. (1995) reported that under field conditions, the increase n1 wind speed stimulated C02 diffusion from the soil due to the disruption of the boundary layer over the forest floor.
Therefore, 1n natural conditions, continuous fluctuation of environmental factors, such as tern perature, C02 concentration and wind speed, on the forest floor may cause fluctuations in soil respiration.
However, in many studies of soil respiration using a chamber method, these environmental factors were often stabilized and soil respiration was measured in a stable environment without consideration of natural fluctuations of the factors.
The objective of this study was to estimate soil respiration fluctuation from natural fluctuation in temperature, C02 concentration and wind speed on a oak
(Quercus glauca)
forest floor. It had already reported that soil respiration rate decreased with increasing C02 concentration, and increased with increasing wind speed in a chamber (Ohashi et al., 1995). Here, two equations that included temperature C02 concentration and wind speed as explanatory variables were formulated from the relationship between soil respiration and each factor in order to estimate soil respiration.2.2.2 Methods
Measurement was carried out in a 28-year-old oak
(Quercus glauca)
forest in the nursery ofKyushu University, Fukuoka prefecture, south-west Japan. Masa soil, a horticultural soil, covered the study site 1 m in depth and an organic horiwn was 10 em. Undergrowth was sparse. Mean am1ual air temperature and precipitation in 1998 was 18.9 cc and 1866 mm, respectively (Fukuoka Local Meteorological Observatory, 1996).C02 concentration, wind speed and soil temperature on the furest floor Diurnal change in wind speed and soil temperature 5 em above the forest floor was measured at 10-minute intervals for a week in summer (August 30""'--'September 5, 1998), autumn (November 28""'--' December 4, 1998), winter (February 20""'--' February 23, 1999) and spring (May 18""'--'May 24, 1999), respectively. All data was recorded by
data logger (LG-C1, Log, Japan).
An electric anemometer (V-01-3, IET, Japan) was used to measure wind speed. A 30 em X 30 em wooden board 3 mm in thick was attached on a tripod 30 em in height and a hole was made on the center of the board to allow the sensor of the anemometer to pass through the hole. The tripod was fixed on the forest floor so that the point of the sensor was fixed 5 em above the floor. 'Ib avoid the sensor becoming wet, a 40 em X 40 em vinyl sheet was put on the wooden board. Soil surface temperature was measured using a thermistor thermometer (LG-C1, Log, Japan). The thermometer sensor was fixed on the soil surface and its cord was covered by a thick hose to avoid being gnawed by rats. C02 concentration was measured by an infrared gas analyzer (GMW22, Vaisala, Japan). Twenty holes, 5 mm
in diameter, were made on the side of a 30 em X 80 em X 40 em plastic case on the forest floor. Ambient air was sucked in the case by a pump and sent to the sensor of the gas analyzer in a static chamber after being dried with silica.
Relationship between soil respiration and environmental factors, C02 concentration, wind speed and temperature
Diurnal change in soil respiration and soil surface temperature was measured hourly from 7:00 to 16:00 in order to examine the relationship between soil respiration and soil surface temperature.
Measurement of diurnal change was carried out once a season on a fine day, summer (September 1, 1998), autumn (December 2, 1998), winter (February 24, 1999) and spring (May 22, 1999). Soil respiration was measured using the open-flow portable measuring system developed by this laboratory (Gyokusen and Saito, 1995; Ohashi et al., 1995). The cha1nber consists of a 3 mm acrylic thick cylinder, 10 em in diameter
and 13 em in height. Wind speed in the chamber was maintained at 1.0 ms-1 using a fan in the chamber. C02 concentration in the air flowing in and out of the chamber was measured by infrared gas analyzer (SPB-H3, Shimadzu, Japan). Air flow rate through the chamber was maintained at 1.5 lm-1. Soil respiration was measured twice; first, with C02 concentration in the chamber maintained at about zero ppm and then, without C02 regulation (C02 concentration was about 450 ppm). Soil respiration was calculated respiration when C02 concentration in the chamber was exactly 400 ppm from the straight line between the two measuring points (Ohashi et al., 1999b). Soil surface tern perature was me?-sured at the same time as soil respiration using a thermistor thermometer (SL5-FF, Chino, Japan).
Relationship between soil respiration and C02 concentration at different wind speeds was investigated in each season, summer (August 22, 1999), autumn (December 3, 1998), winter (February 23, 1999) and spring (May 22, 1999). All measurements were carried out between 11:00 to 15:00 in order to minimize the effect of diurnal change in temperature (Edwards and Sollins, 1973; Hanson et al., 1993). Soil temperature during measurement varied less than 2 oc in all seasons.
C02 concentration in the chamber increased from 0 ppm to 600 ppm in five gradations. Wind speed increased from 0 ms-1 to 5 ms-1 in six gradations at each C02 concentration level. C02 concentration in the chamber stabilized 10 minutes after change in the level and soil respiration readings was taken 5"'--'7 minutes after change in wind speed. C02 concentration was regulated by passing the air flow through soda lime (Ohashi et al., 1995). C02 concentration flowing out of the chamber was presumed to be C02 concentration in the chamber (Ohashi et al., 1995). The fan with a current transformer (DC Power Supply, NISC, Japan) was used to regulate wind speed. Relationship
30
between wind speed and voltage was measured by electric anemometer (V-01-3,
IET,
Japan) in the laboratory.2.2.3 Results
Temporal changes m C02 concentration, wind speed and soil temperature on the forest floor
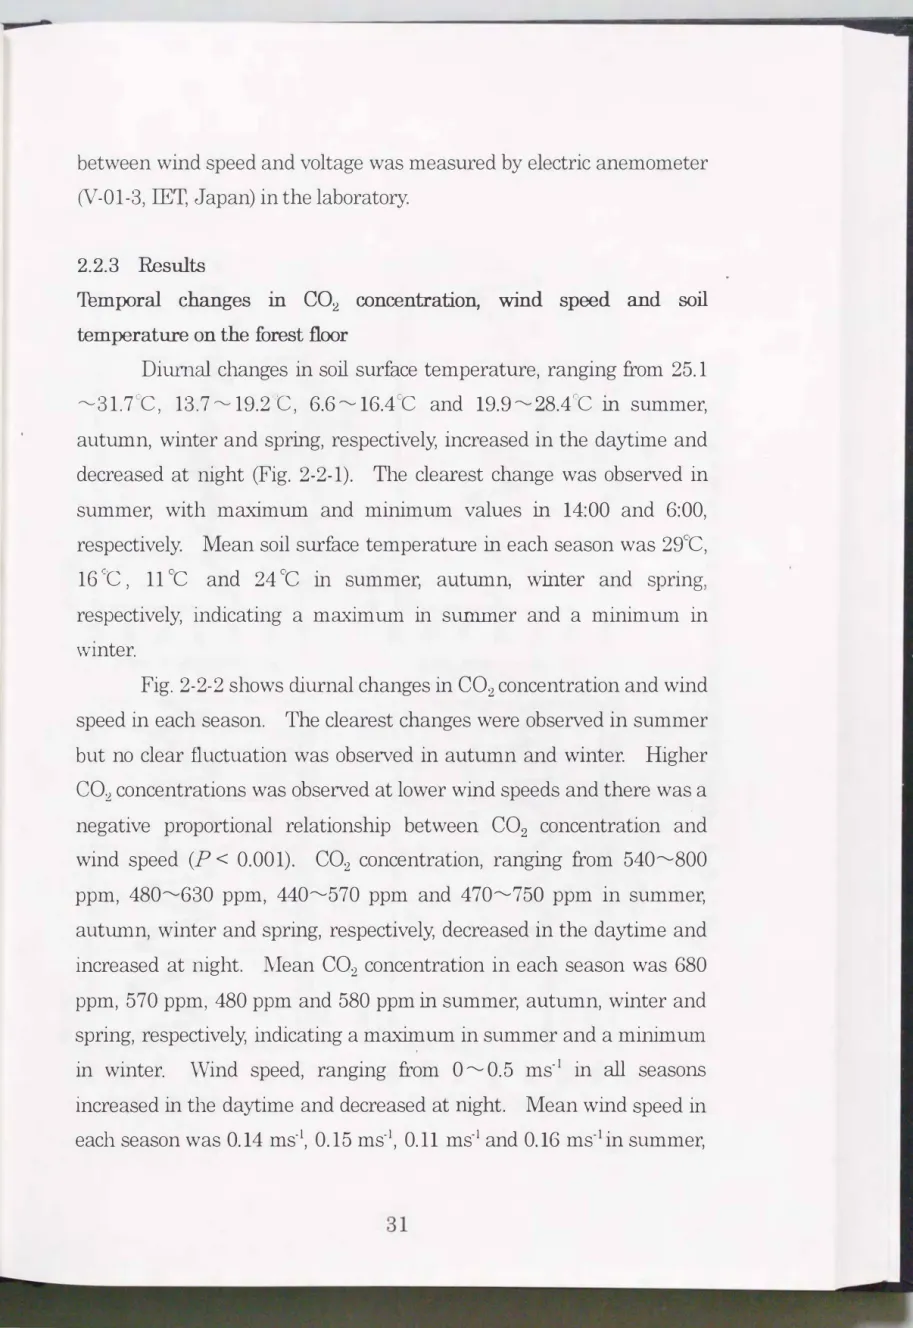
Diurnal changes in soil surface temperature, ranging from 25.1
�31.7°C , 13.7�19.2'-C, 6.6�16.4°C and 19.9�28.4°C in summer, autumn, winter and spring, respectively, increased in the daytime and decreased at night (Fig. 2-2-1
)
. The clearest change was observed in summer, with maximum and minimum values in 14:00 and 6:00, respectively. Mean soil surface temperature in each season was 29°C, 16 cC, 11 oC and 24 oC in summer, autumn, winter and spring, respectively, indicating a maximum in summer and a minimum in winter.Fig. 2-2-2 shows diurnal changes in C02 concentration and wind speed in each season. The clearest changes were observed in summer but no clear fluctuation was observed in autumn and winter. Higher C02 concentrations was observed at lower wind speeds and there was a negative proportional relationship between C02 concentration and wind speed (P < 0.001
)
. C02 concentration, ranging from 540�800 ppm, 480�630 ppm, 440�570 ppm and 470�750 ppm in summer, autumn, winter and spring, respectively, decreased in the daytime and increased at night. Mean C02 concentration in each season was 680 ppm, 570 ppm, 480 ppm and 580 ppm in summer, autumn, winter and spring, respectively, indicating a maximum in summer and a minimum in winter. Wind speed, ranging from o �o.5 ms-1 in all seasons increased in the daytime and decreased at night . Mean wind speed in each season was 0.14 ms·I, 0.15 ms-1, 0.11 ms-1 and 0.16 ms-1in summer,900
E' n. 8oo
n.
..___..
§ 700
·.;:;
.b 600 cu c (1) () § 500
()
0 400
0
300
900
E' n. 8oo
n.
..___..
§ 700 :;:;
.b 600 cu c (1) () § 500
()
0 400
0
300
Summer
8/30 8/31
Winter
9/1 9/2 9/3 9/4 9/5 Time (day)
900
E' n. 8oo
..___.. n.
§ 700
·.;:;
.b 600 cu c (1) () § 500
()
0 400
0
300
900
E' n. 8oo
3 § 700
+-'
.b 600 cu c (1)
() § 500
()
0 400
0
Autumn
11 /28 11/29 11/30 12/1 12/2 1 2/3 1 2/4
Time (day)
Spring
2/20 2/21 2/22 2/23 2/24 2/25 2/26 300
2/20 2/21 2/22 2/23 2/24 2/25 2/26
Time (day) Time (day)
Fig. 2-2-1 Daily change in soil surface temperature.
c.o c.o
900
E' 0.
3 700
c 0
·.;::;
(iJ I...
� 500
(1) (.)
c 0 (.)
N
0 0
E' 0.
300
100
900
3 700
c
·.;::; 0 (iJ I...
� 500
(1) (.)
c 0 (.) 300
0 0
100
Summer
8/30 8/31 9/1 9/2 9/3 9/4 9/5
Time (day) Winter
2/20 2/21 2/22 2/23 2/24 2/25 2/26
Time (day)
1.2
;---...
o.8 I g
'-.../
06 0 ""2 (1)
0. (/)
0. 4 "0
c
0.2 �
0
1.2
;---...
o.8 I g
'-.../
"0
0.6 �
0. (/)
0.4 "0
c
0.2 �
0
900
E' 0.
3 700
c
·.;::; 0 (iJ I...
� 500
(1) (.)
c 0
(.)
N
0 0
E' 0.
300
100
900
3 700
c
-.;::; 0 (iJ I...
� 500
(1) (.)
c 0 (.)
0 0
300
100
Autumn
11 /28 11 /29 11 /30 12/1 12/2 12/3 12/4
Time (day) Spring
5/18 5/19 5/20 5/21 5/22 5/23 5/24
Time (day)
Fig. 2-2-2 Daily change in C 02 concentration and wind speed.
1.2
;---...
o.8 g
'-.../
"0
0.6 �
0. Cll
0.4 "0
c
0.2 �
0
1.2
;---...
o.s g
'-.../
"0
0.6 �
0. Cll
0. 4 "0
c
0.2 �
0
autumn, winter and spring, respectively, indicating no clear differences.
Relationship between soil respiration rate and environmental factors, co� concentration, wind speed and soil temperature
Soil respiration rate decreased proportionally with increasing C02 concentration, and it increased with increasing wind speed (Fig. 2- 2-3). The relationship between soil respiration and C02 concentration in each season was expressed by the following equations using the gradient and intercept which includes wind speed as an explanatory variable
summer; SRc.w=- (0.04 W+ 0.48)C+ 212 W+ 456 (1J autumn; SRc.w=- (0.03 W+ 0.30)C+ 169 W+ 274 (1J winter ; SRc.w=- (0.07 W+ 0.24)C+ 122 W+ 129 (1J spring ; SRc·w=- (0.12 W+ 0.27)C+ 193 W+ 231 (1cJ where, SRc.w(mg C02m-2hr-1) is soil respiration, W(ms-1) is wind speed and C (ppm) is C02 concentration. Mean soil surface temperatures in each measurement were 30.6°C, 17.5°C, 12.4°C, 25.7°C in the summer, autumn, winter and spring, respectively.
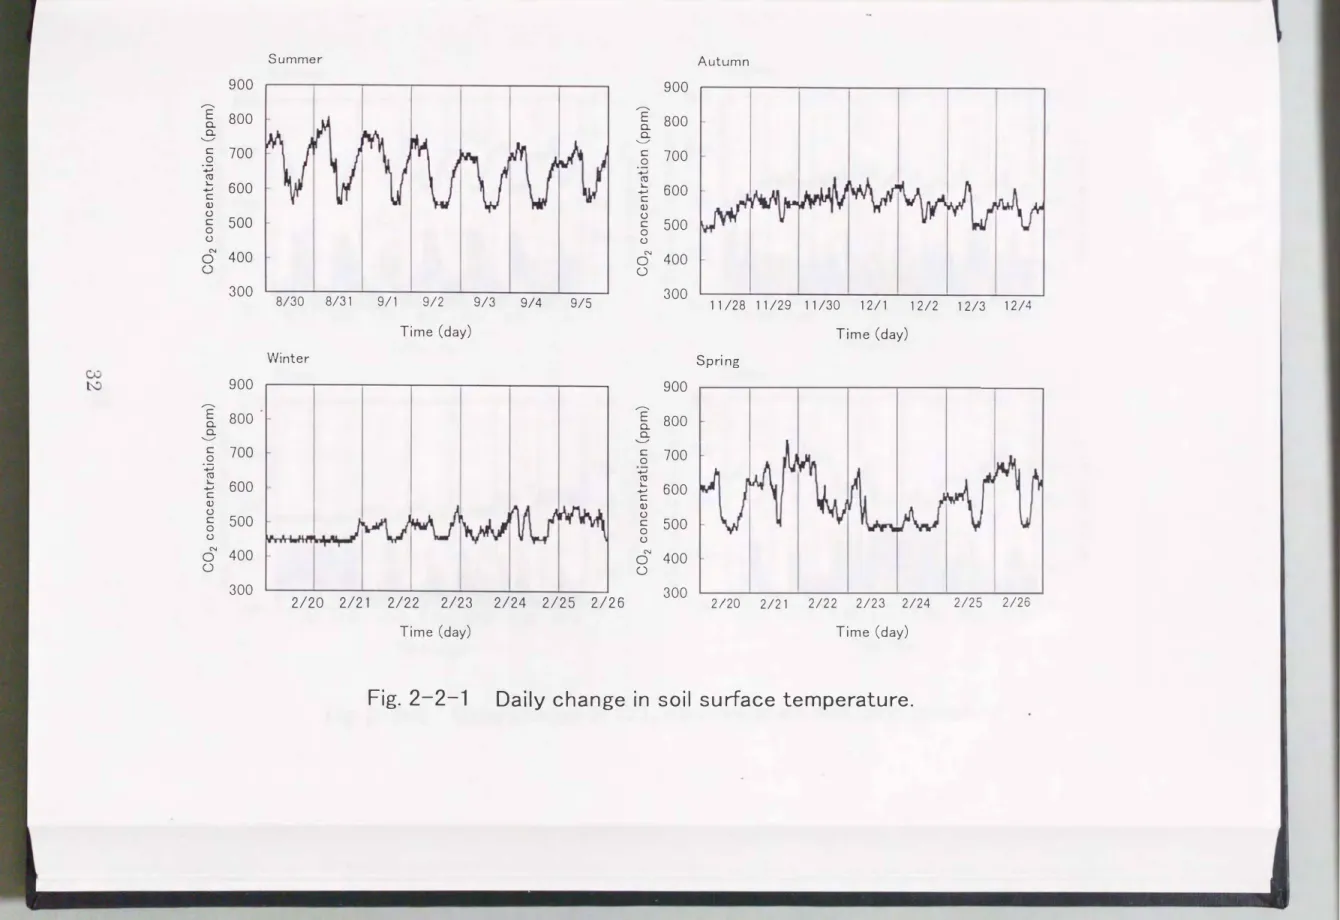
Soil respiration increased exponentially with increasing soil surface temperature (Fig. 2-2-4). The relationship between soil respiration and soil surface tern perature in each season was expressed by the following equation
summer; SRT= 11.8 exp (0.127) (2J
autumn; SRT= 21.7 exp (0.147) (2J
winter ; SRT= 21.2 exp (0.147) (2J
spring ; SRT = 8.60 exp (0.13 1) (2cJ
where, SRT (mg C02m-2hr-1) is soil respiration and TCC) is soil surface
temperature. Q10 value for each season, calculated as the rate of
change of soil respiration when temperature increased by 10
cc,was
Summer Autumn
700 I 700
.... ....
..c • Temp. 30.6°C ..c Temp. 17.5°C
';" 600 '* N I 600
E 500 D • E
c5' -o /:::,. A c5' 500
� •
0 400
�
t 0 400� �
bD f bD
�
5 /:::,. � 5
300 � 300
��
c � c /:::,. 8 g
Q 200 � .Q 200
+-' +-'
-� -�
0. 100 0. 100
(/) (/)
� 0 � 0
0 0 100 200 300 400 500 600 700 0 0 100 200 300 400 500 600 700
(f) (f)
C02 concentration (ppm) C02 concentration (ppm)
Winter Spring
700 ...
I I 700
L Temp. 12.4°C _c Temp. 25.rc
';" 600 N 600
E I
500 E
0 0 500
0 bD 400 0 bD 400 • •
5 c 300 5 300 8
�
•I i
c� �
Q 200
l
0 /:::,. g •+-'
i
·.;:; 200f
-� 0. (/) � 100 0
'
.� 0. (/) � 1000
0 0 100 200 300 400 500 600 700 0 0 100 200 300 400 500 600 700
(f) (f)
C02 concentration (ppm) C02 concentration (ppm)
Wind Speed (ms -J) •. 1.0 .A, 0.8 •. 0.7 D. 0.55 0, 0.35 �. 0.1
Fig. 2-2-3 Relationship between soil respiration and
C02
concentration at various wind speed.
Surnrner Autumn 500
c I 400
0 ....c 1...
...,
(iJ N 300
1... I
Q.. E
Cl) N
200
Q) 0
1...
0 0 b.O 100 (f) ....___, E
0
Winter 500 400
C I 1...
0 ....c 300
..., (iJ N
1... I
Q.. E 200
Cl) N
Q) 0
1...
0 100
0 b.O (f) ....___, E
0
•
-
24 27 30
Temperature (°C)
500
c I 1... 400
.2 ....c
...,
<iJN 300 -
1... I
Q.. E
Cl) 0 200
1... Q)
0
·-0 b.O 1 00
(f) ....___, E
0
33 12
Spring 500
.::--- 400 -
C I .2 �
� N 300
1... I
·o_ E
Cl) N 200 -
� 0
0 � 100 (f)-5
�----�---�----� 0
6 9 12 15 20
Temperature (°C)
•
15 18
Temperature (°C)
22 24 26
Temperature (°C)
Fig. 2-2-4 Relationships between soil respiration and soil surface temperature.
21
28
3.0, 4.1
and3.7
in the summer, autumn and winter, and sprmg, respectively.Since each equation of
(la-d)
was made under stable temperature condition, the following equations, which include temperature, C02 concentration and wind speed as explanatory variables was formulated from the combination of(2a-c0
and(la-d)
using the mean soil surface temperatures in each measurement of(la-cU·
summer ;
SR
=(SRc. wl S�.J
xSRr
=
(211 W- 0.05 WC- 0.44C+ 435)
exp(0.11 T- 3.5) (3J
autumn;
SR
=(SRc.wl SR17.J
XSRr
=
(169 W- 0.03 WC- 0.30C+ 274)
exp(0.14T- 2.5) (3J
winter ;
SR
=(SRc. wl S�2.J
xSRr
=
(122 W- 0.07 WC- 0.24C+ 130)
exp(0.14T- 1.7) (3J
sprmg ;
SR
=(SRc. wl SR;.5.7)
xSRr
=
(193 W- 0.12 WC- 0.27 C+ 231)
exp(0.13T- 3.3) (3c0
Soil respiration was also expressed by the following equations using non-linear multiple regression analysis.
summer; Ln
(SR)
=0.446 W- 0.0012C+ 0.111
T+ 2.67 (4J
autumn; Ln
(SR)
=0.356 W- 0.0012C+ 0.065
T+ 4.55 (4J
winter ; Ln
(SR)
=0.664 W- 0.0020C+ 0.211
T+ 2.28 (4J
spring ; Ln
(SR)
=0.526 W- 0.0012C+ 0.143
T+ 1.80 (4c0
Values estimated from
(3a-c0
equations and from (4a
-cU
equations were compared with soil respiration readings measured hourly from7:00
to16:00
under high (about450
ppm) and low(0
ppm) C02 concentrations in the chamber. As a result, all values estimated from the two equations are in good agreement with measured values(r> 0.8,
P <
0.001)
(Fig.2-2-5).
Subsequently, the equations were used toestimate diurnal changes in natural soil respiration from the fluctuation of temperature, C02 concentration and wind speed on the
37
Summer
800
C I
.<2 l: �';"
600
•!
.... 0c5 400
� 1 200 0 5
Winter
800
C I ._g (1J N _c
600 -�'E""400
� 0 - 0
� 1 200
0 5
10 15
Time(hour)
10 15
Time(hour) 0 Mesurements
20
Autumn
800
.2 '.2 � (1J N
600 - -�'E""400
� 0
� 1 200 0
Spring
800
C '
._g ro N _2
600 -�'E""400
e o
� 1 200 0 5
20 5
!:::.. Estimates ( 3a-d )
10 15
Time(hour)
10 15
Time(hour) 0 Estimates (4a-d)


![[報文]酸性沈着が森林土壌にもたらす影響 -土壌養分過剰と根圏環境診断-](data:image/gif;base64,R0lGODlhAQABAIAAAP///wAAACH5BAEAAAAALAAAAAABAAEAAAICRAEAOw==)