九州大学学術情報リポジトリ
Kyushu University Institutional Repository
森林における土壌呼吸に関する生態学的研究
大橋, 瑞江
九州大学農学研究科林業学専攻
https://doi.org/10.11501/3166808
出版情報:Kyushu University, 1999, 博士(農学), 課程博士 バージョン:
権利関係:
Chapter 4 Effect of aboveground vegetation on soil respiration
4.1
Contribution of root respiration
to total soilrespiration
in aQuercus acutissima and a Cryptomeriajaponica planting pots
4.1.1
Introduction
Most atmospheric carbon fixed by photosynthesis of green plants is provided to soil as litterfall. The organic carbon in soil is decomposed into C02 by soil microbial respiration and returned to the air again with C02 from root respiration. All C02 evolution from soil is commonly called soil respiration and regarded as an important factor in
the carbon cycling of forest ecosystems. Since soil respiration mainly
results from root and microbial respiration, it is important in order to separate the two respiration to examine soil respiration fluctuation (Katagiri, 1988; Nakane et al., 1996). Root contribution to total soil respiration has been estimated from the difference between soil respiration and fallen litter (Kawahara, 1976), from the linear relationship between soil respiration and root biomass (Katagiri, 1988;
Behara et al., 1990), and by comparing soil respiration between an undisturbed area and a clear-felled area (Kawahara, 1976; Nal{ane et al., 1983; Nal{ane et al., 1996). Although a wide variety of techniques used to estimate root contribution has been developed, each technique is limited (Nakane et al., 1983; Katagiri, 1988; Ohashi and Saito, 1998).
One reason may be the difficulty in separating root systems from soil because root system expand without any restriction in soil under field conditions.
Therefore, the objective of this study is to estimate the
planting pots in which the expansion of root systems is restricted. In this study, it is assumed that differences in soil respiration rate before and after plant (shoot and root) removal was equal to root respiration.
Effect of shoot removal only on soil respiration was also examined.
4.1.2 Methods
Measurements were carried out from July to September
1996
in the nursery of Kyushu university, Fukuoka prefecture, south-west Japan. 'I\vo unglazed pots,6
liter in volume, planted with an oneyear-old
Quercus acutisslina
(30
em in height) and an one-year-oldCryptomeria japomca (50
em in height), respectively, were used for measurements. The first measurement was conducted when each potwas intact (shoot+root+soil). The second measurement was conducted
just after the shoot was cut at the base (root+soil). The last measurement was conducted
10
days after the root was removed (soil).Watering was carried out
12
hour before each measurement.Soil respiration and soil temperature was measured hourly from
18:00
to6:00
for two consecutive nights under field conditions in each of the 3 measurements. An10
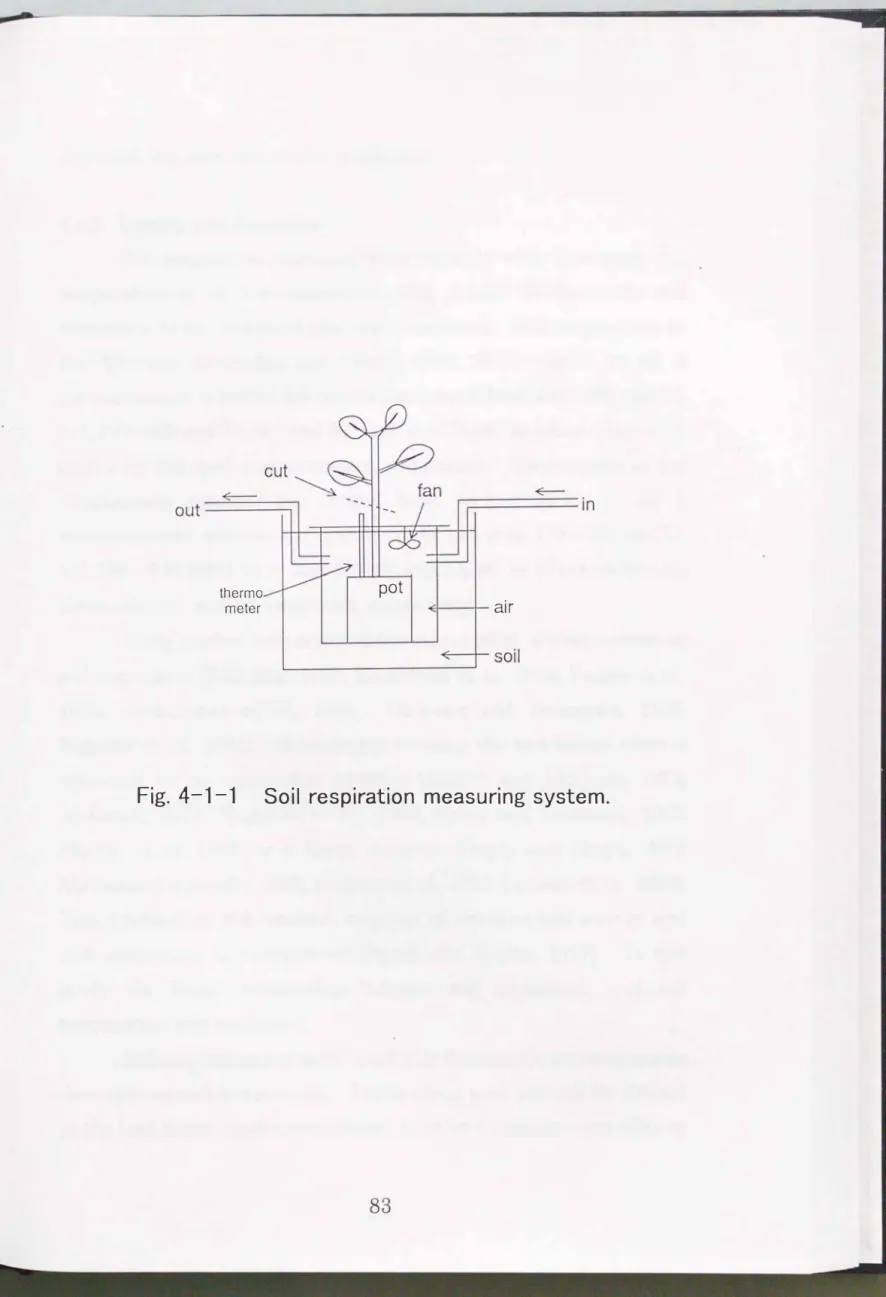
liter open-flow respiration chamber was used to measure soil respiration. The planting pot only was sealed in the chamber and buried in a large concrete pot,1
m in diameter and80
em in height, in a field (Fig.
4-1-1).
Wind speed in the chamber was maintained at1.0
ms-1 using a fan in the chamber to maintain C02 concentration equal in the chamber. Air flow rate through the chamber was maintained at1.5
Jm-1 and soil respiration rate was calculated from C02 concentration in the air flowing in and out of the chamber measured by infrared gas analyzer(IRA-107,
Shimadzu, Japan)(Ohashi et al,1995).
Soil temperature at a depth of10
em was measured using a thermistor thermometer (Kadec-us6, Kona system,82
out---,
thermo meter
pot
,.---in
-8----jf-- air
�-+--soil
�---�
Fig. 4-1-1 Soil respiration measuring system.
Japan) at the same time as soil respiration.
4.1.3 Results and discussion
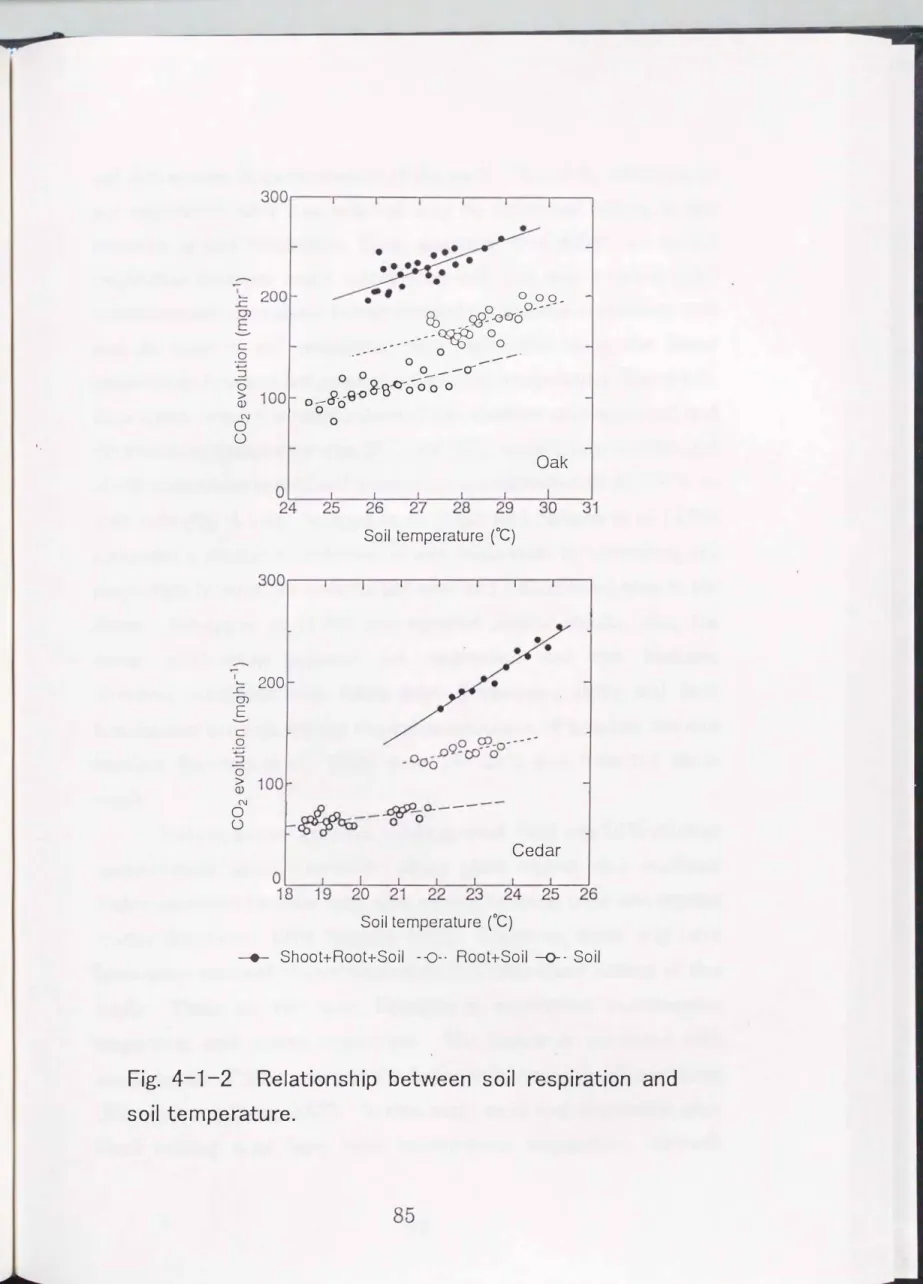
Soil respiration increased proportionally with increasing soil temperature in all 3 measurements (Fig. 4-1-2). However, the soil respiration range decreased after each treatment. Soil temperature in the
Quercus acutissima
pot ranged from 25 °C """'-' 30 oC in all 3 measurements, whereas soil respiration ranged from 200""'-'280 mgC02 hr-1, 150""'-'200 mgC02 hr-1 and 80""'-' 140 mgC02 hr-1 in (shoot+root+soil), (root+soil) and (soil) measurements, respectively. 'Thmperature in theCryptomeria japonica
pot ranged from 18 oC """'-' 25 °C in all 3 measurements, whereas soil respiration ranged from 170""'-'250 mgC02 hr-1, 120� 140mgC02
hr-1 and 50""'-'80mgC02
hr-1 in (shoot+root+soil), (root+soil) and (soil) measurement, respectively.Many studies have reported the salient effect of temperature on soil respiration (Witkamp, 1969; Kanemasu et al., 1974; Parker et al., 1983; Grahammer et al., 1991; Osozawa and Hasegawa, 1995;
Nakadai et al., 1996). Relationship between the two values often is expressed by an exponential equation (Kucera and Kirkham, 1971;
Anderson, 1973; Hagihara et al., 1984; Sakai and Tsutsumi, 1987;
Simona et al, 1989) or a linear equation (Gupta and Singh, 1981;
Mathes and Schriefer, 1985; Rochette et al., 1991; Lassard et al., 1994).
This results from the sensitive response of soil microbial activity and root respiration to temperature (Singh and Gupta, 1977). In this study, the linear relationship between soil respiration and soil temperature was confirmed.
Soil respiration decreased gradually through the two treatments, shoot cutting and root removal. In this study, pots were left for 10 days in the field before (soil) measurement in order to decrease the effect of
c 0 ...
::J 0
>
Q)
0 N
u
1'- 200
..c CJ)
E
c 0 ...
::J 0
>
Q)
0 N
u
•
0 00 0 Q,,-''
Eb
, ,�-.oo-c)-'
�
0--- 0
, , - 0 0 --
0 0
--a-0
8- -(y -- 8. -e-o s0 0 0 0
00
0 0
Oak
Soil temperature (C)
J...nL- .
� o..----�ua) - � - 0
Soil temperature (C)
Cedar
__.._
Shoot+Root+Soil
--0-·Root+Soil
-o- -Soil
Fig. 4-1-2 Relationship between soil respiration and
soil temperature.
soil disturbance from excavation of the root. Therefore, reduction in soil respiration after root removal may be attributed largely to the cessation of root respiration. Then, assuming that differences in soil respiration between intact (shoot+root+soil) and root removal (soil) measurements correspond to root respiration, the root respiration rate and its ratio to soil respiration were calculated using the linear relationship between soil respiration and soil temperature (Fig.
4-1-2).
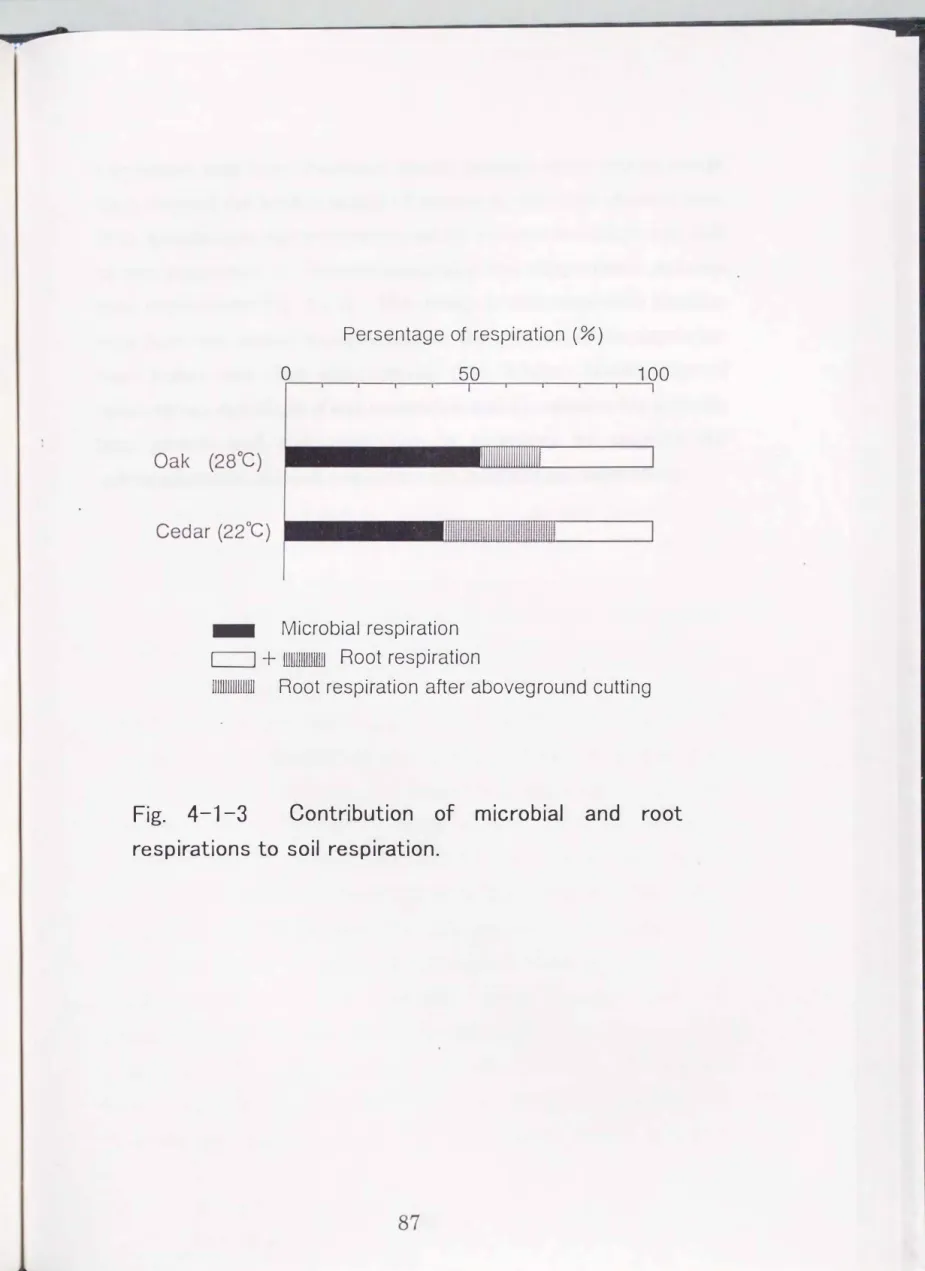
As a result, when the temperature of the
Quercus acutissima
pot andCryptomeria japomca
pot was28°C
and22°C,
respectively, contribution of root respiration to total soil respiration was estimated as45�50%
in both pots (Fig.4-1-3).
Nakane et al.(1983)
and Nakane et al.(1996)
estimated a similar contribution of root respiration by comparing soil resprration between an undisturbed area and a clear-felled area in the forest. Behara et al.
(1990)
also reported similar results using the linear relationship between soil respiration and root biomass.However, estimates from fallen litter (Kawahara,
1976)
and from terminating live root activity through construction of trenches and root barriers (Bowden et al.,1993)
were18�33 %
less than the above result.Soil respiration after shoot cutting (root +soil) was
70
% of intact measurement (shoot+root+soil). Many plant organs often maintain their respiration for some time after cutting by using their own organic matter (Karizumi,1979;
Negishi,1970).
Therefore, there may have been some remnant of root respiration just after shoot cutting in this study. There are two main functions in respiration, maintenance respiration and growth respiration. The former is associated with maintenance of old tissue and the latter with synthesis of new tissue (Marshall and Perry,1987).
In this study, most root respiration after shoot cutting may have been maintenance respiration. GrowthPersentage of respiration (%)
0 50 100
111111111111111111111111
- Microbial respiration c==J + llilJn!illlllill Root respiration
lllilll!l!lilllll Root respiration after aboveground cutting
Fig. 4-1-3 Contribution of microbial and root
respirations to soil respiration.
respiration may have decreased greatly because shoot cutting would have stopped the further supply of organic matter from shoot to root.
If so, it is thought that growth respiration occupies two-thirds and half of root respiration in
Quercus acutissima
andCryptomena japonica
pots, respectively (Fig. 4-1-3). The change in root respiration function may have also caused the difference in the gradient of the regression lines before and after shoot cutting (Fig. 4-1-2). Investigation of tern perature sensitivity of root respiration and the relationship between tree growth and root respiration is necessary to examine the relationship between root respiration function and soil respiration.
4.2 Contribution of root respiration rate to total soil respiration rate in
an Japanese cedar
(
Cryptomeria japonica D.Don) artificial forest4.2.1 Introduction
Soil respiration or C02 evolution from the soil surface has been regarded as an excellent indicator of both root system activity and soil microorganisms activity (Lamade et al., 1996; Behara et al., 1990).
Recently, understanding the amount and fluctuation of soil respiration has become more relevant due to the need to evaluate the capacity of forest ecosystems to fix carbon. This may be important to the global carbon budget (Houghton and Woodwell, 1989; Oikawa, 1991; Vose et al., 1997).
Many reports suggest that soil respiration is influenced strongly by environmental factors, such as soil moisture and temperature (Singh and Gupta, 1977; Schlentner and Van Cleve, 1985; Carlyle and Than, 1988; Lassard et al., 1994; Pajari, 1995). In forest ecosystems, soil respiration is also affected by forest management practices because root respiration may contribute a considerable proportion of soil respiration (Nakane et al., 1983). Some reports suggest that clear-felling or artificial gap formation causes a reduction of root respiration, thereby decreasing soil respiration (Brumme, 1995; Striegl and Wickland, 1998).
Ohashi et al. (1999b) reported that thinning may have increased soil respiration temporarily because of increased development of the roots of remaining trees. '!bland and Zak (1994) reported that the decomposition of dead roots after clear-felling offsets decreases in soil respiration. Therefore, in order to understand the complex fluctuations in soil respiration in forest ecosystems, it may be important
respiration.
Although many attempts have been made to estimate root contribution to total soil respiration, a precise estimate is difficult because of the complex nature of the soil sub-system (Behara et al., 1990). Some reports estimate the contribution of root respiration from measurement of C02 evolution in freshly cut roots (Edwards and Sollins, 1973) and from comparison of field measurement of total C02 flux and laboratory measurements of C02 flux from the same soil after removal of roots (Lamade et al., 1996; Thierron and Laudelout, 1996).
However, these approaches result in a rate significantly different from the natural rate because of disturbance of ground through digging (Nakane et al., 1996; Ohashi and Saito, 1998). As a result, Kawahara (1976) considered that natural root respiration may be equal to the difference between soil respiration and fallen litter. Katagiri (1988) and Behara et al. (1990) calculated natural root respiration from the linear relationship between soil respiration and root biomass.
However, the former method is only used for forest ecosystems in which soil organic matter is in dynamic equilibrium (Ohashi and Saito, 1998) and in the latter method it is difficult to measure root biomass accurately (Katagiri, 1988). Nakane et al. (1983) and Nakane et al.
(1996) addressed these problems by comparing soil respiration between an undisturbed control area and a clear-felled area. They estimated natural root respiration more accurately by using a frame box covered with nets in clear-felled areas to maintain the same environmental conditions as those of the control, and by taking into consideration C02 evolution due to decomposition of roots which had died as a result of felling.
In the present study, I estimated the contribution of root respiration to total soil respiration in a Japanese cedar forest
90
( Cryptomena ja.pomca.
D. Don) using the technique that modified the methods of Nakane et al. (1983) and Nakane et al. (1996). Soil respiration rate was compared between an undisturbed area and the center of an artificial small gap that was expected to decrease the disturbance of environmental conditions, such as temperature and moisture. In this stand, factors have already been clarified that affect soil respiration, such as environmental factors, forest management, and thinning (Gyokusen and Saito, 1995; Ohashi et al., 1995). Therefore, in this study, the effect of an artificial gap formation on soil respiration was also examined by estimating the soil respiration gradient from the center of the gap into the stand.4.2.2 Study area
The study area was a 0.45 ha plantation of 10-year-old Japanese cedar in the Forest Research and Instruction Station of Kumamoto Prefecture, located in Kyushu, southwest Japan (32° 49 ,. N, 130° 44
,. E).
Mean annual air temperature and precipitation in this area in 1996 were 16.2 cc and 1970 mm, respectively (Kumamoto Local Meteorological Observatory, 1996). The soil type is a light color humid andosol (Kuroboku) derived from volcanic ash (Inoue, 1979) with a thin organic horiwn. The forest is planted on a level topographic site and undergrowth is sparse. The study site had 16,000 trees ha-1, 6 - 8 min height. A description of this site may be found in reports by Gyokusen and Saito (1995) and Ohashi et al. (1999b).In March 1996, four cedar trees were felled and set up G 1 plot
(0.8 m
X 0.8m)
at the center of the gap (2.5 m X 2.5 m). G2, G3 and C (control) plots were also set up, at 0.8 m (edge of the gap), 1.6 m (edge of the surrounding stand), 6.0 m (in the forest, control) apart from G 1, respectively (Fig. 4-2-1). Felled tree heights were not different from0
Felled tree
2.5 m 0.8 m 4.0 m
Measurement plots
��
Gl
0 0
G2 G3
0
I I I I
0 0
((
0o�• • 0 . ... I 0
X X� X X� X X�
X xj X X� x xj X X� X X� � ... �.:
((
0 •
Gl • G2 0
G3 0 0
0 0 0 0 0 0
c
�
0
r�
, ... 0
�X X�
�X X�
�X X�
.........
c 0 0
Fig. 4-2-1 Location of measurement plots. Each plots has 6 measurement points.
surrounding trees
(P<
0.05).4.2.3 Methods Soil respiration
Six sampling po:ints were located randomly and their mean calculated :in every plot (Fig. 4-2-1). All samplings in plots were conducted between 9:00 to 15:00 to minimize the impact of diurnal variability (Edwards and Sollins, 1973; Hanson et al., 1993).
Measurement before felling was carried out once
in March 1996. Measurement after felling was carried out once on fine days at the end of every month for two years, from April 1996 to March 1998.
At each sampling point, soil respiration was measured using an open-flow portable measuring system that we developed (Gyokusen and Saito, 1995; Ohashi et al., 1995). The chamber was a 3 mm thick acrylic cylinder, 12.5 em in diameter and 10 em in height. Wind speed in the chamber was maintained at 4.0 ms·1 by a fan because higher wind speed provided consistent measurement values (Ohashi et al., 1995; Ohashi et al., 1999b). C02 concentration in the air flowing in and out of the chamber was measured by an infrared gas analyzer (SPB-H3, Shimadzu, Japan). Soil respiration rate was calculated when C02 concentration in the chamber was exactly 400 ppm using C02 concentration regulation (Ohashi et al, 1995; Ohashi et al, 1999b)
Soil surface temperature and soil moisture
Soil surface temperature was simultaneously measured using a thermistor thermometer (SL5-FF, Chino, Japan) at each point when soil respiration was measured. Three soil cores (20 cm2 X 5 em) were taken at 10 em depth inside and outside the gap, respectively, at the
end of each measurement. Cores were oven-dried at
105 oCfor
48h and soil moisture content was determined gravimetrically.
Statistical analysis
In order to compare tree heights between felled and surrouncling trees, a non-parametric test was used. Soil respiration, soil surface temperature and soil moisture were compared over years and between the four plots using ANOVA. Monthly difference in soil respiration, soil tern perature and soil moisture between the each G plot (G
1,G2,
G3)and C plot were compared by t-test. In order to examine the correlation of soil respiration rates with temperature and soil moisture in each plot, non-linear regression analyses was used.
Comparison of regre.ssion lines between soil respiration rate and soil temperature was carried out by ANCOVA
4.2.4
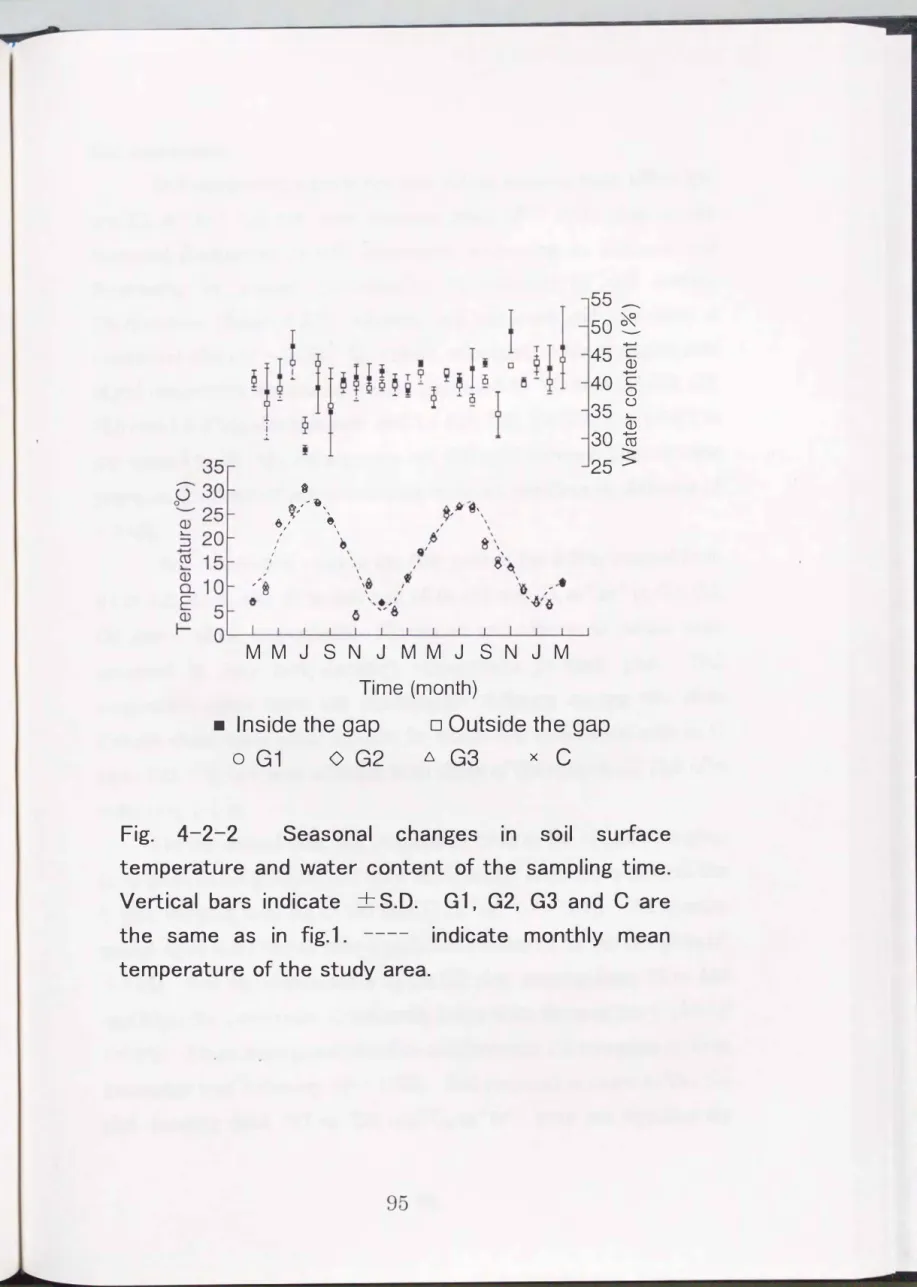
ResultsSoil surface temperature and soil moisture
Soil surface temperature, ranging from
4.5to
30.7oCand
6.0to
26.8't
in the first and second years, respectively, increased in summer and decreased in winter (Fig. 4-2-2). Maximum and minimum values were recorded in July and February, respectively,
ineach year.
There was hardly any seasonal fluctuation over the two years in
soil moisture content which ranged from 29 to
51%and
36to
51 °/oin
the first and second years, respectively. Maximum and minimum
values were recorded in July and March, respectively, in the first year,
and in June and October, respectively, in the second year. Soil surface
temperature and soil moisture content did not vary between plots or
over years (P<
0.05).t
� ,��,
�� '
6,' �\
I I I
M M J S N J M M J S N J M
Time (month)
55-- 50�
...
45
c Q)...
40
c 035 ::
30
-co Q)25 �
•
Inside the gap
oOutside the gap
0
G1
0G2
6G3
Xc
Fig. 4-2-2 Seasonal changes in soil surface temperature and water content of the sampling time.
Vertical bars indicate +S.D. G1, G2, G3 and C are the same as in fig.1. ---- indicate monthly mean temperature of the study area.
Soil respiration
Soil respiration rates before tree felling, ranging from
120
to136
mgC02 m-2 hr-1, did not vary between plots
(P < 0.05)
(Fig.4-2-3).
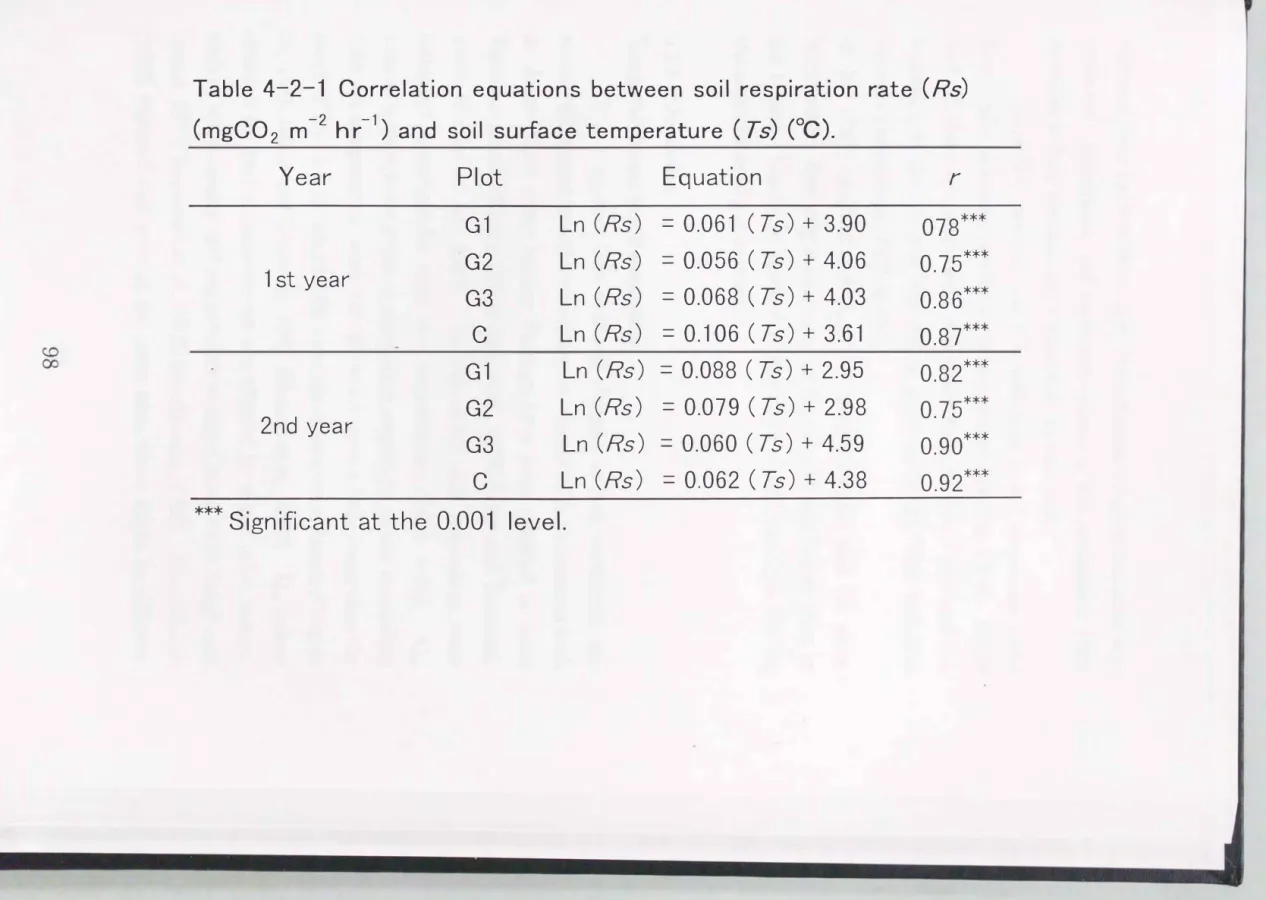
Seasonal fluctuation in soil respiration, increasing in summer and decreasing in winter, corresponded to changes in soil surface temperature (Table
4-2-1),
whereas soil moisture did not have a significant effect(P< 0.05). Q10
values, calculated as the changing rate of soil respiration when temperature increased10
°C, were2.0 (G 1, G2, G3)
and1.8
(C) in the first year, and1.6 (G 1, G2), 1.9 (G3)
and1.8
(C) inthe second year.
Q10
values were not different between plots or over years, as gradients of regression lines were not significantly different(P
< 0.05).
Soil respiration rates in the first year of the felling ranged from
31
to442, 41
to489, 37
to520
and55
to482
mgC02m-2hr-1 inGl, G2, G3
and C plots, respectively. Maximum and minimum values were recorded in July and January, respectively, in each plot. Soil respiration rates were not significantly different among the plots though there were some months in which soil respiration rate inG
plots
(G 1, G2, G3)
was different from those of the control (C) plot(P <
0.05)
(Fig.4-2-3).
In the second year, soil respiration rates in the
G 1
plot, ranging from38
to221
mgC02m-2hr-1 were significantly lower than those of the C plot, ranging from92
to540
mgC02 m-2 hr-1(P < 0.05).
All months except April and October were significantly different for the two plots(P
< 0.05).
Soil respiration rates in theG2
plot, ranging from73
to 444mgC02m-2hr-1, were also significantly lower than those of the C plot
(P
< 0.05).
There were monthly differences between the two plots in June, December and February(P < 0.05).
Soil respiration rates in theG3
plot, ranging from
117
to720
mgC02 m-2 hr-1, were not significantlyC\J I
E 0 C\J
0 (})
E
c 0
+-'
3/1996 - 3/1997 4/1997 - 3/1998
3, before felling
...•...•...•...•... ...
4 4
...•...•...•...•... ...•... iii ...•...
i ...
.5 5
···-
�
---··············· ···-�
·-·······1
...•...6 6
···············
*
··· ···=
···-�
---···'·······7 7
j
... 1
...1
...1
...1 ... ...•... i...
.... 1 ...
.8 8
... 1
.....1
.......1
........1
......... ···-�
---···i .....
... l
.......
.i ...
.9 9
···-
�
·-·······'
······· ···-�
---·······1
...1 ...
.10 1-0
m 3oo * *
� 0 ·······-··········· ···•···•···•···•···
53-
600 11 11Q) 300 *
� 0 ···-··············· ...•...•...•...•...
0 600 12 12
(j) 300 *
0 ···•···•···•···•··· ···•···•···•···•···
600 1 1
300 *
0 ···-···-···-···--··· ···•···•···•···•···
600 2 2
300 0 ···-···-···--···---··· ···-···-·······--···
3
300 *
0 ...•...•...•...•... ···•···•···•···•···
G 1 G2 G3 C G 1 G2 G3 C Plot
Fig.
4-2-3
Seasonal changes 1n soil respiration.Vertical bars indicate +S.D. * and ** are significantly different from
C
at0.05
and0.001
levels, respectively.Table
4-2-1
Correlation equations between soil respiration rate(Rs)
(mgC02 m-2
hr-1)
and soil surface temperature( Ts) (°C).
Year Plot
G1
1st
yearG2
G3 c G1
2nd
yearG2
G3 c
Equation
Ln (Rs)
=0.061 ( Ts)
+3.90 Ln (Rs)
=0.056 ( Ts)
+4.06 Ln (Rs)
=0.068 ( Ts)
+4.03 Ln (Rs)
=0.106 (Ts)
+3.61 Ln (Rs)
=0.088 ( Ts)
+2.95 Ln (Rs)
=0.079 ( Ts)
+2.98 Ln (Rs)
=0.060 ( Ts)
+4.59 Ln (Rs)
=0.062 ( Ts)
+4.38
***Significant at the 0.001 level.
r
078***
0.75***
0.86***
0.87***
0.82***
0.75***
0.90***
0.92***
different from those of the C plot. Nevertheless a higher tendency was observed. Maximum and minimum values of soil respiration were recorded in July and January, respectively, in each plot.
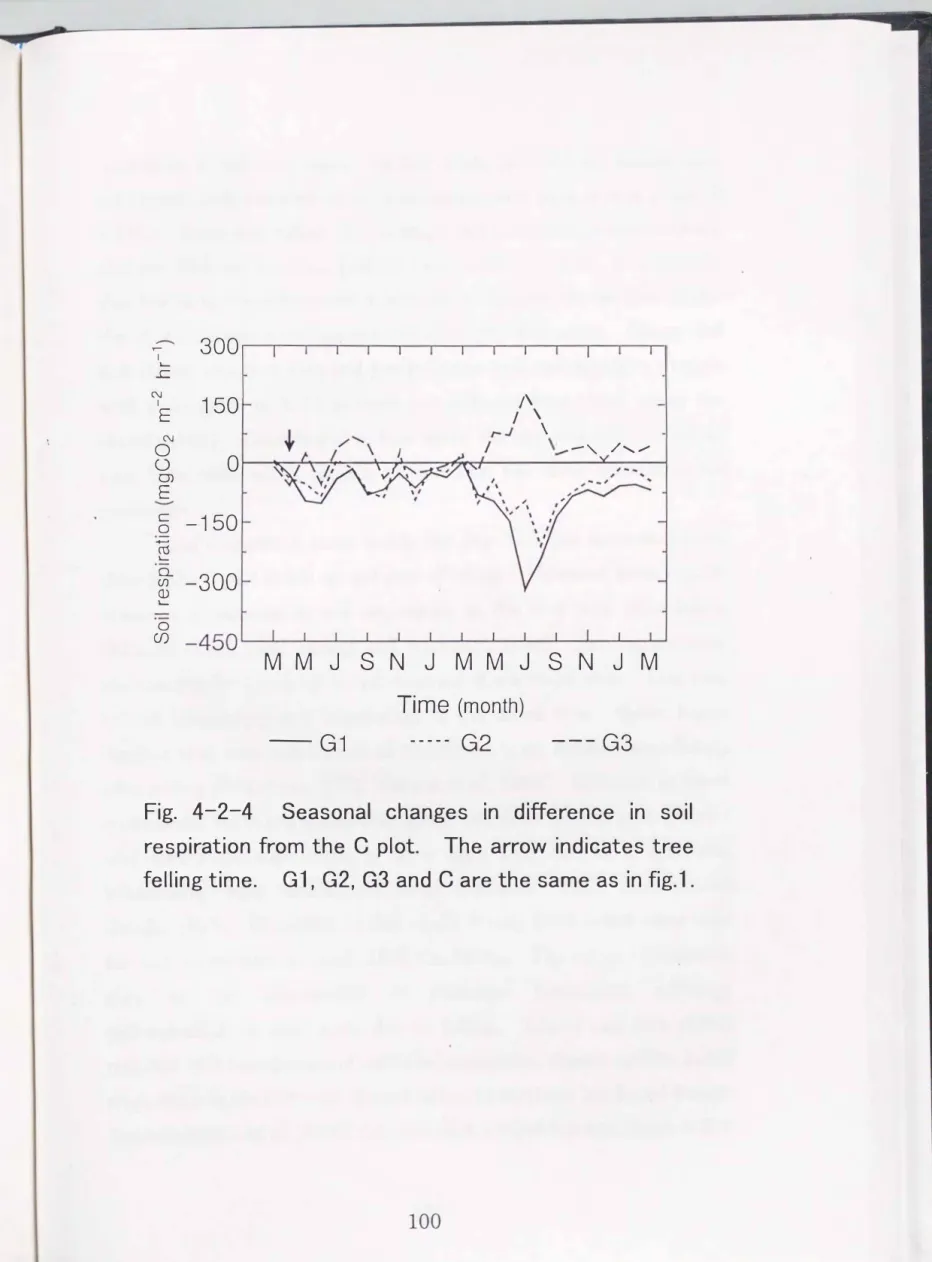
In each G plot (G 1, G2, G3), difference in soil respiration rates from C plot increased rapidly in the second summer (Fig. 4-2-4). In G 1 and G2 plots, soil respiration was lower than in the C plot and the reduction in the G2 plot was not as great as in G 1. This variation reached a maximum of 319 mgC02
m-2
hr-1
(July ) and 210 mgC02 m-2hr-1
(August) in G 1 and G2 plots, respectively. Soil respiration rates in the G3 plot was higher than in the C plot. Variations reached a maximum of 180 mgC02 m-2hr-1
in the second July of gap formation.4.2.5 Discussion
Temporal change in soil respiration
It is supposed that seasonal changes in soil respiration are mainly influenced by soil temperature in temperate environments such as Japan since many similar findings have been reported in other Japanese forests (Kirita, 1971d; Seto et al., 1978; Sakai and Tsutsumi, 1987; Simona et al., 1989). In this study, soil respiration rates increased exponentially with soil temperature (Th.ble 4-2-1).
Q10
values, a convenient index in comparing sensitivity of soil respiration with soil temperature, were 1.6�2.0 which were a little lower than the range of 1.8- 4.1, as reported for a variety oftemperate forests (Fung et al., 1987; Sakai and Tsutsumi, 1987; Hanson et al., 1993).
Q10
values obtained by field measurements are affected by many other factors, such as soil moisture and soil nutrient status (Chiba, 1975; Singh and Gupta, 1977; 'Ibwnsend et al., 1992; Kirschbaum, 1995). Kirschbaum (1995) reported that even at the same sites, there might be differentr-
300
I 1.-
..c
N I E
150
0 N
u
0
0) E
§ -150
� 1.-
(f) 0..
-300
1.-Q) 0
f\
I \
\
\
... -, /,,..,..w
-
4so
���������--L-L_�J_�
M M J S N J M M J S N J M Time (month)
-
G1 --- G2 --- G3
Fig. 4-2-4 Seasonal changes in difference in soil respiration from the C plot. The arrow indicates tree felling time. G 1, G2, G3 and C are the same as in fig.1.
recordings in different years. In this study, however, Q 10 values \Vere not significantly different either between the four plots or over years (P
< 0. 05). Since soil S"Luiace tern perature and soil moisture content were also not different between plots or over years (P< 0.05), it is thought that the san1e environmental conditions in the gap site as those under the closed canopy were maintained after gap formation. Zhang and Zak (1995) reported that soil temperature and soil moisture in gaps with a diameter of < 15 m were not different from those under the closed canopy. Accordingly, in this study, the gap size (2.5 m x 2.5 m) may have been s1nall enough to maintain the same enviro1unental conditions.
Soil respiration rates inside the gap (G 1, G2) decreased n1ore than in the C plot in the second year of felling. However, some reports observed a decrease in soil respiration in the first year after felling (Nakane et al., 1983; Striegl and Wickland, 1998). 'I\vo explanations are possible for the delay in the decrease of soil respiration. One may be the continuing root respiration of the felled tree. Some report suggest that root respiration of coniferous trees ceases immediately after felling (I(awahara, 1976; Nakane et al., 1983). However, in forest ecosyste1ns, there are many r hizosperic microbes around root systems and root respiration often is at a high rate due to a symbiotic relationship vvith michorrhiza fungi (Tsutsumi, 1987; Hatano and Sasaki, 1987). Therefore, in this study, it may have taken some time for root respiration to cease after the felling. The other explanation may be the acceleration of microbial respiration following decomposition of dead roots due to felling. Thland and Zak (1994) reported that acceleration of microbial respiration offset a decline in soil respiration in the first year of clear-felling in northern hardwood forests.
Arunnachalarn et al. ( 1996) reported that a rapid decomposition of fine
roots occurred from 60 days after root cutting in a subtropical humid forest. Therefore, in this study, the remnant of root respiration may offset the decrease in soil respiration in the early period of the first year and thereafter the decomposition of dead roots may offset the decrease.
Since almost all dead roots have been decomposed, soil respiration within the gap may be reduced in the second year.
Spatial change
in soilrespiration
Nakane et al. (1996) and Striegl and Wickland (1998) observed lower soil respiration rates in clear-felling areas than in the control area.
Brumme (1995) reported that soil respiration rates were lowest in the center of the 30m diameter gap. They explained the reduction in soil respiration was mainly attributed to the cessation of root respiration.
Thus, in this study, the reduction of soil respiration inside the gap
(G
1,G2)
may have been caused by the diminution of root respiration. Since some live roots are intermingled with dead roots, the reduction in theG2
plot (edge of the gap) may not be as great as inG
1 (center of the gap).In this study, soil respiration in the G3 plot (edge of the surrounding forest) tended to be higher than in the C plot. Brumme (1995) also observed that the highest soil respiration occurred at the edge of the surrounding forest of the gap rather than in the stand.
Ohashi et al. (1999b) reported that thinning increased soil respiration because of increased development of the roots of remaining trees in the stand. These reports suggest that an improvement in light conditions may accelerate root respiration. Therefore, in this study, the improvement in light conditions due to gap formation accelerated the root respiration rate in the G3 plot.
This study suggests that the small gap (2.5 m X 2.5 m) has the
potential to change the soil respiration rate in the gap site. Small gaps like this are often made by forest management activities, such as thinning, cleaning and cutting, and by natural disasters, such as typhoons. However most investigations have concentrated on larger disturbances, such as clear-felling (!bland and Zak., 1994; Zhang and Zak., 1995; Striegl and Wickland, 1998). Ohashi et al. (1999b) reported that forest management activities, such as thinning, may have the potential to change the carbon balance of the ecosystems and may even cause a small change in soil respiration, thereby substantially altering the global carbon budget. Thus, further studies, using gaps of different size and frequency, are necessary to fully determine the effect of small gap formation on soil respiration.
Estimation of root respiration
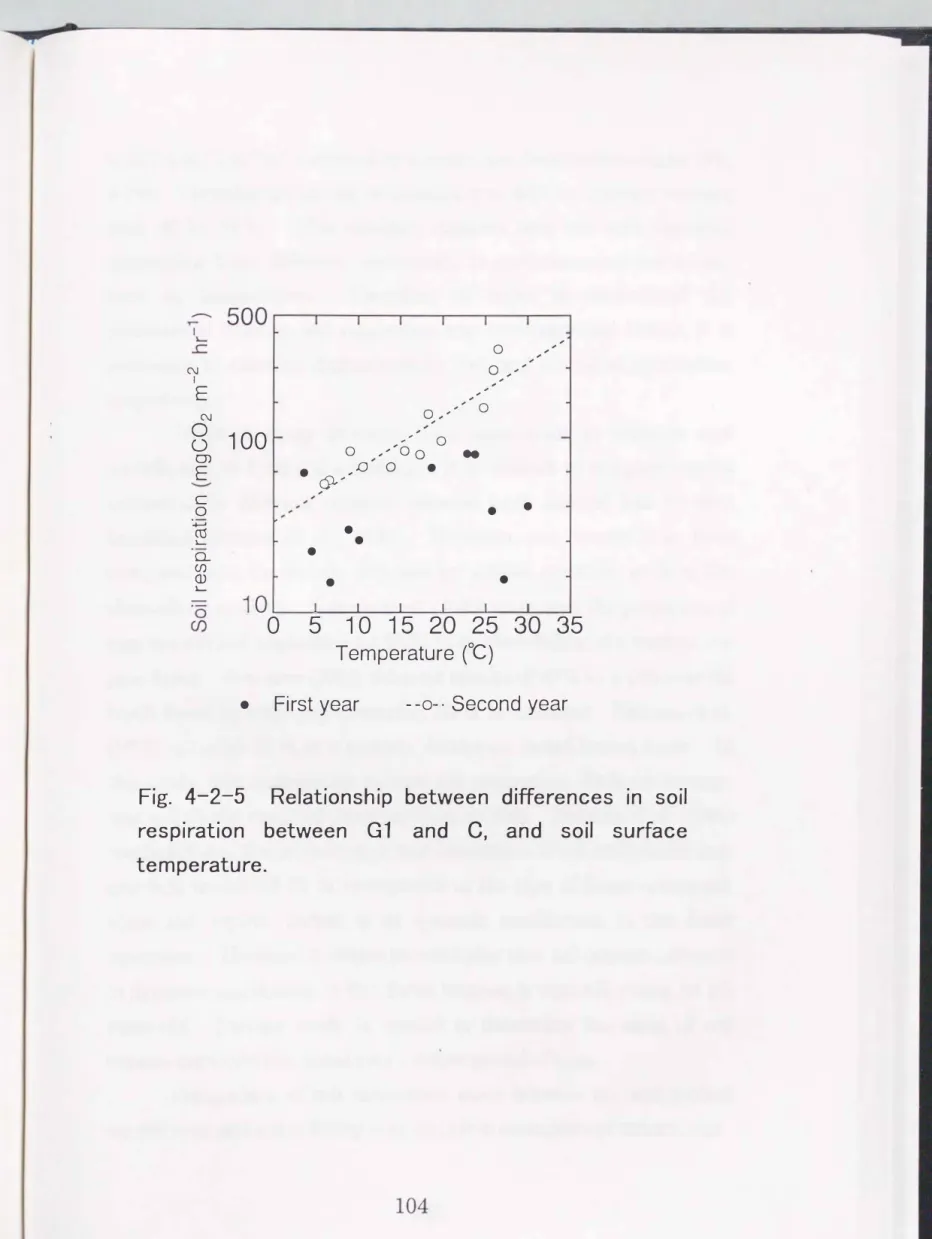
Assuming that differences in soil respiration rates between the center of the gap (G 1) and in the forest (C) corresponds to root respiration rates, the root respiration rate of this stand was calculated.
The relationship between root respiration
(Rr,
mgC02 m -2hr-1)
and soilsurface temperature
(Ts,oC)
in the second year is expressed by the following equation (Fig.4-2-5) (r
= 0.90, P< 0.00 1);Ln(Rz) == 0.07 Ts + 3.48 · · · (1)
Being a biochemical process, the relationship between root respiration rate and temperature usually has a
Q10
of2
(Singh and Gupta, 1977). Since theQ10
value calculated from equation (1) was also2.
0, it is thought that Ts is equal to root respiration rate. Thus, root respiration rate was estimated froJ? soil surface temperature in the C plot using equation (1). Its ratio to soil respiration in the C plot was also calculated as root contribution to total soil respiration of this stand.RDot respiration rate from April, 1996 to March, 1997, ranging from
54
N I
E
N
5oo��,--�,��,--�T--�,--�,--�
"
0 ...
-- -
�
---8 100
�?
... 0... 0 -
o ... 'o0 ..
01
E
c 0
� m lo...
o_
(J) CD lo...
f- • ,1J 0 •
;51"
•
•
•
•
• •
•
10
I I I I I I0 5 1 0 15 20 25 30 35
Temperature
(C)
• First year - -o-· Second year
Fig. 4-2-5 Relationship between differences in soil
respiration between
G1and C, and soil surface
temperature.
to 217 mgC02m-2hr-1 increased in summer and decreased in winter (Fig.
4-2-6). Contribution of root respiration was 49% on average, varying from 40 to 70 %. This variation suggests that root and microbial respiration have different sensitivities to environmental conditions, such as temperature. Therefore, in order to understand the relationship between soil respiration and environmental factors, it is necessary to examine fluctuations in root and microbial respiration, respectively.
Although many attempts have been made to estimate root contribution to total soil respiration, it is difficult to compare results estimated by different methods because each method has its own limitation (Behara et al., 1990). Therefore, our results have been compared with the results obtained by similar methods, such as the clear-felling method. Nakane et al. (1983) estimated the proportion of root to total soil respiration as 47-51 % by clear-felling of a mature red pine forest. Brumme (1995) obtained results of 40 % in a 146-year old beech forest by large gap formation, 30 m in diameter. Nakane et al.
(1996) recorded 51 % in a mature, deciduous, broad-leaved forest. In this study, root contribution to total soil respiration, 49 % on average, was within the range of these previous studies. Nakane et al. (1983) concluded that the proportion of root respiration to soil respiration may converge to around 50 %, irrespective of the type of forest concerned, when soil organic carbon is in dynamic equilibrium in the forest ecosystem. However, it cannot be concluded that soil organic carbon is in dynamic equilibrium in this forest because it was still young, at 10- years-old. Further study is needed to determine the state of soil organic carbon in this stand over a longer period of time.
Comparison of soil respiration rates between an undisturbed control area and a tree felling area can allow estimation of natural root
c 0 100 -�
L.
o_ (/)
<1>
L.
� 0 0
50
;:! Respiration rate
Contribution
�
0: 0 A MJ J ASONDJ
Month
80 2 c
co L.
o_
60
�
F M 0
Fig. 4-2-6 Seasonal changes in root respiration rate and contribution to soil respiration from April 1997 to March 1998.
respiration without any soil disturbance. However, large area felling is difficult because it requires a large labor force and permission from various authorities. Furthermore, this method needs to consider the effects of changes in environmental conditions after felling and C02 evolution due to decomposition of roots killed by cutting. In this study, however, the same environmental conditions in the gap as in the forest could be maintained because gap size was small (Fig.
4-2-2).
Furthermore, root respiration was estimated in the second year of the gap formation, when C02 evolution due to decomposition of dead roots may be small. Therefore, it was concluded that artificial small gap formation is one simple and effective method of estimating contribution of root respiration to total soil respiration.
4.3 Changes in soil respiration following aboveground growth in red oak and Japanese cedar forest stands
4.3.1 Introduction
Carbon fixation by photosynthesis and the storage of the carbon above- and below-ground in forests are expected to contribute to decreased carbon dioxide in the air. Therefore, recently, reforestation has been carried out all over the world. However, carbon storage capacity in forest ecosystems is regulated by a balance between carbon fixation by photosynthesis and carbon e1nission by respiration.
Therefore, since soil respiration is a major flux of carbon in ecosystems, the determination of soil respiration requires a clear understanding of the carbon storage capacity of the ecosystems (Freijer and Bouten, 1991).
Soil respiration in forest ecosystems has been studied in terms of seasonal (Iillita, 1971d; Anderson, 1973; Carlyle and Than, 1988;
Holt et al., 1990; Pajari, 1995), diurnal change (Witkamp, 1969;
Gyolmsen and Saito, 1995; Nakadai et al., 1996; Eguchi et al., 1997), and relation to environmental factors, such as temperature and moisture (Chiba, 1975; Schlentner and Van Cleve, 1985; Sakai and Tsutsumi, 1987). However, most studies were carried out in mature forest ecosyste1ns in which soil carbon cycles are already in dynamic equilibrium. Therefore, fluctuation of soil respiration in young forests during growth, when carbon dynamics are unstable, has been scarcely investigated. This is because soil respiration has been measured generally in order to clarify carbon cycling in forest ecosystems (Witkamp, 1969; �ucera and Kirkham, 1971; Edwards and Sollins, 1973; Anderson, 1973; Simono et al., 1989). However, the significance of the study of soil respiration has changed recently. Understanding
the extent and fluctuation of soil respiration has become more relevant due to the need to evaluate the capacity of forest ecosystems to fix carbon (Houghton and Woodwell, 1989; Oikawa, 1991; Vose et al., 1997).
Therefore, it is important to study soil respiration dynamics in young forests which have a potential to fix more carbon than mature forests.
In forest ecosystems, not only microbial respiration but also root respiration may contribute a considerable proportion of soil respiration (Singh and Gupta, 1977; Behara, 1990). Therefore, changes in root biomass and root activity, depending on aboveground vegetation conditions, change root respiration rate, thereby affecting soil respiration ceshanges in aboveground vegetation may also influence microclimate in forests and indirectly affect soil respiration. Some reports suggest that clear-felling or artificial gap formation causes a reduction of root respiration, thereby decreasing soil respiration (Brumme, 1995; Striegl and Wickland, 1998). Ohashi et al. (1999b) reported that thinning may have increased soil respiration tern porarily due to increased development of the roots of remaining trees.
Differences in the root and microbial ratio to soil respiration would cause variations in temperature sensitivity of soil respiration rates (Kirschbaum, 1995). These reports suggest that, changes in aboveground vegetation, such as planting and felling, may have significant effects on soil respiration.
The objective of this study IS to examme the effects of aboveground growth on soil respiration. Red oak
(Quercus
acutissima.)
and Japanese cedar(Cryptomeria japomca)
stands were grown from seed for 3 years and cuttage, respectively. One-and-a-half years after planting, 50% of each stand was clear-felled and the effect of clear-felling on soil respiration was also examined.4.3.2 Study Site
Measurement was conducted in young red oak
(Quercus acutissima)
and young Japanese cedar(Cryptomeriajapomca)
stands grown in large concrete pots in the nursery of Kyushu university, Fukuoka prefecture, south-west Japan. In March 1995, 5 large concrete pots, 4 m 2 in area and 1 m in depth, were filled with Masa soil and left for a year. Rainwater was drained through many small holes, 5 em in diameter, made in the bottom of the pot. In April 1996, seeds of red oak were sown in two of the pots in 16 seed m-2 and cuttages of Japanese cedar was planted in the other two pots in 16 cuttage m-2.The remaining pot was used as control. In December 1997, all trees in one pots from the oak and cedar stands, respectively, were clear-felled (Fig. 4-3-1). Each pot was designated as oak intact plot, oak felled plot, cedar intact plot, cedar felled plot and control plot, respectively.
Watering was carried out in all plots as required.
4.3.3 Methods
Soil respiration, tree height and tree diameter
6 sampling points were located randomly m each plot.
Measurement was carried out once on a fine day at the end of every month for three years, from April 1996, as near to just after planting, to May 1999.
Soil respiration was measured usmg an open-flow portable measuring system that developed by the authors (Gyokusen and Saito, 1995; Ohashi et al., 1995). The chamber was a 3 mm thick acrylic cylinder, 12.5 em in diameter and 10 c� in height. Wind speed in the chamber was maintained 4.0 ms-1 by a fan in the chamber (Hanson et al., 1993). C02 concentration in the air flowing in and out of the chamber was measured by infrared gas analyzer (SPB-H3, Shimadzu,
110
Tree
Jl
0 0 0 0 0 0 0 0 0 0 0 0 0 0 0 0
0 X X 0 X X ..., .... Measurement point
0 0
0 0
P'
X X X X
0 0
0 Oak intact plot 0 Cedar intact plot
0 X X 0 X X
0 0
0 0 0 0 0 0 0 0 0 0 0 0 0 0 0 0
0 X X 0 X X X X
0 0
0 0
X X X X X X
0 0
0 Oak felled plot 0 Cedar felled plot Control
0 X X 0 X X X X
0 0
Fig. 4-3-1 Design of measurement plots. Each plot
has 6 measurement points of soil respiration.
Japan). Soil respiration rate was calculated when C02 concentration in the chamber was exactly 400 ppm using C02 concentration regulation (Gyokusen and Saito, 1995; Ohashi et al, 1995) Soil surface temperature was measured using a thermistor thermometer (SL5-FF, Chino, Japan) as the same time as soil respiration.
Tree height (H) and diameter at the base (D) were measured for all trees once every two months and the averages calculated in each plot. D2H of each tree was calculated as an index of aboveground biomass (Yoda, 1971) and totaled for each plot.
Statistical analysis
Before felling, tree heights and diameters were compared between felled and non-felled plots using ANOVA Soil respiration, growth in tree height and diameter were also compared over years and between plots using ANOVA In order to examine the correlation of soil respiration rate with temperature in each plot, non-linear regression analysis was used. Comparison of regression lines between soil respiration rate and soil tern perature was carried out using ANCOVA Significance for all statistical analyses was accepted at a=
0.05.
4.3.4 Results
Tree height, tree diameter and 1YH
Growth in tree height and diameter were concentrated from May till September in both oak and cedar intact plots (Fig. 4-3-2, Fig. 4- 3-3). Heights in May, the final month of each measurement year, in oak and cedar intact plots were 41 em and 75 em, 82 em and 113 em, and 95 em and 126 em in 1st, 2nd and 3rd years, respectively. Annual height increase was 32'""'-'41 em in the 1st and 2nd years, decreasing to
112
Height 150
120 'E (.) 90
..r: +-'
.� 60
I Q)
30
0
1997 5 1998 5 1999
Time( Year)
Height-growth 40
,.-..,
§
30..r:
�
l... 20b.() +-' I ..r:
.� 10
I Q)
0
1997 5 1998 5 1999
Time (Year)
• Oak plot 0 Cedar plot
Fig. 4-3-2 Temporal change in tree height.
Diameter 30
� 25
E E 20
I....
15
-+-' Q.) Q.) E 10
('0
0 5
0
1997 5 1998 5 1999
Time (Year) Diameter-growth
5
r-...
E E
...c
� 0
I....
bJ) I I....
-+-' Q.) Q.) E
('0
0 0
1997 5 1998 5 1999
Time(Year)
• Oak plot 0 Cedar plot
Fig. 4-3-3 Temporal change in tree diameter.
13 em in the 3rd year. Diameters in May in oak and cedar intact plots were 5 mm and 13 mm, 12 mm and 18 mm, 16 mm and 22 mm in 1st, 2nd and 3rd years, respectively. Annual diameter growth was 4'""'--'7 mm throughout the year. Increase in D2H was concentrated from May to July in the two intact plots. D� in May in oak and cedar intact plots was 770 cm3 and 8400 cm3, 8600 cm3 and 26000 cm3, 22000 cm3 and 41000 cm:3 em in the 1st, 2nd and 3rd years, respectively (Fig. 4-3- 4).
Before clear-felling, height, diameter and D2H did not vary between felled and intact plots. After clear-felling, no sprouts appeared in the cedar felled plot, though 2'""'--'6 sprout appeared from every stump the following April (3rd year) in the oak felled plot. D2H in the oak felled plot recovered to half the level of the oak intact plot (Fig. 4-3-4).
Soil respiration and soil surface temperature
Fig. 4-3-5 shows seasonal readings in soil respiration and soil surface tern perature in each plot. Soil surface tern perature ranged from 8'""'-'40°C annually throughout measurement. Although summer tern peratures in plots without vegetation, such as the cedar felled plot after clear-felling and the control plot, tended to be higher than in vegetation plots (oak intact, oak felled and cedar intact plots), the differences were not significant.
Seasonal fluctuation in soil respiration, increasing in summer and decreasing in winter, corresponded to changes in soil surface tern perature. Soil respiration rates in the control plot, ranging from 21
�270 mgC02 m-2 hr-1, were not significantly differed over years of measurement. Soil respiration in the oak stand (intact plot and felled plot) ranged from 54�304 mgC02 m-2 hr-1, 51 �511 mgC02 m-2 hr-1 and
Oak 25000
e Oak plot 20000 0 Oak felling pi t
,---._
("')
E 15000 -3
I 10000
N 0
5000
0
1997 5 1998 5 1999
Time (Year)
Cedar 50000
e Cedar plot 40000 0 Cedar fellin
,---._ plot
("')
E 30000 -3
I 20000
N 0
10000
0
1997 5 1998 5 1999
Time (Year)
Fig. 4-3-4 Temporal change in D2H .
Oak plot Cedar plot 1000
} Temperature Soil respiration 40
� 800 u
0 30 �
0 t10 E 600 .3 �
"'
c: 400 20 �
._;] 0 � E C1l
-� 200 10 t-
�
·a 0 0
(/) 1997 1998 5 1999 1997 1998 1999
Time (Year) Time (Year)
Oak felling plot Cedar felling plot
1000
f 40
� 800
0 u
30 �
0 t10 600 �
E .3
"'
c: 400 20 �
._;] 0 � E C1l
-� 200 10 t-
�
·a 0 0
(/) 1997 1998 1999 1997 1998 1999
Time (Year) Time (Year)
Control 1000
';'r_ 40
E 800 u e Soil respiration
cJ 30 c
0 t10 E 600 +-' � ::::s
c: 400 20 � 0 Soil surface temperature
0 C1l
._;] a.
� E
-� 200 10 �
�
·a 0 0
(/) 1997 1998 1999
Time (Year)
Fig. 4-3-5 Temporal changes 1n soil respiration and soil surface temperature.
63'"'--'625 mgC02m-2hr-1 in the 1st, 2nd and 3rd years, respectively. Soil respiration rates in each oak plot did not vary significantly from those of the control plot in the 1st and 2nd years of measurement, but were significantly higher in the 3rd year (Fig. 4-3-6). Monthly variation was observed in the 4, 8'"'--'9 and 12 months in the 1st, 2nd and 3rd years, respectively, increasing gradually. Soil respiration rates were not significantly different between the oak intact plot and the oak felled plot for all years.
Soil respiration in the cedar stand (intact plot and felled plot) ranged from 77 '"'--'257 mgC02 m-2 hr-I, 37 '"'--'569 mgC02 m-2 hr-1 and 50'"'-' 533 mgC02 m-2 hr-1 in 1st, 2nd and 3rd years, respectively. Soil respiration rates in each oak plot were not significantly different from those of the control plot in 1st and 2nd years of measurement, but were significantly higher in the 3rd year. Monthly differences were observed in the 6'"'--'7, 7 "--' 11 and 11 "--' 12 months in the 1st, 2nd and 3rd years, respectively, increasing gradually. Soil respiration rates were not different significantly different between the cedar intact and the felled plots for all years.
The relationship between the soil respiration rate and temperature was expressed by exponential equation for each year (Table 4-3-1). Q10 values in the control plot, ranging from 1. 7 "--' 1.9, did not vary among years of measurement. Q10 values in the oak and cedar intact stands did not vary significantly from the control plot in the 1st year, ranging from 1.4'"'--' 1.7, but significantly higher in the 2nd and 3rd year, ranging from 2.0"--'2.2, 1.9"--'2.3, respectively (Fig. 4-3-7).
There were no significant differences in Q10 value between the oak and cedar stands in any year. Correlation equations between soil respiration and soil surface temperature were used to estimate annual soil respiration at each plot. Daily mean soil respiration was