厚生労働科学研究費補助金(健康安全・危機管理対策総合研究事業)
分担研究報告書
社会参加が要介護認定に及ぼす影響:社会経済状況の修飾効果による検討
研究協力者 芦田 登代(東京大学医学部 特任研究員)
研究分担者 近藤 克則(千葉大学予防医学センター 教授)
研究代表者 近藤 尚己(東京大学医学研究科 准教授)
研究要旨
【目的】
高齢者の介護予防のひとつに閉じこもりを防止することがある。それには、社会参加 しやすい環境への改善や健康格差対策が重要とされ、様々な部署が連携して進めること が効果的と指摘されている。高齢者の社会参加が健康へ及ぼす影響については、個人の 属性、特に学歴や所得など社会経済的な状況により、異なる可能性がある。そこで、様々 な社会活動への参加や参加の形態とその後の要介護状態との関連における、個人の社会 経済的な背景の作用修飾効果について検討することを目的とした。
【方法】
用いたデータは、日本老年学的評価研究(JAGES)のデータで、2003年度の調査回 答者の4年後の要介護状態のデータを付加したものである。調査対象は、要介護認定を受 けていない65歳以上の高齢者である。解析はコックス比例ハザードモデルによって行い、
エンドポイントは、要介護認定とした。社会参加の修飾効果として、会や組織の参加の 有無と社会経済的変数(所得と教育年数)それぞれとの交差項を作成し、オッズ比と95%
信頼区間を算出した。共変量には年齢、婚姻状態、就労状態、疾病状況を用いた。
【結果】
会や組織に入っていることはその後の要介護や死亡のリスクが低いことと関連してい た。修飾効果についての結果は、男性では教育年数によって修飾されている傾向が示さ れた。例えば、「スポーツ関係のグループやクラブ」では、教育年数が最も長い人をリ ファレンスグループとすると、教育年数が短い人のオッズ比は5.61(95% CI: 1.59,19.8)、
「趣味の会」ではオッズ比 3.97 (95% CI: 1.13,14.02)であった。
【結論】
社会参加は健康に効果的とされてきた。しかし、参加の仕方によっては逆の影響が見 られたことは、高齢者の社会参加を支援する上で社会階層への配慮が重要であることが 示唆された。
A. 研究目的
世界規模で高齢化が進む中、日本は急速 に高齢化が進行している。医療や介護費用 も、2000年から2012年の12年間に1.4倍に なるなど、保健医療制度の持続可能性の観 点から、介護予防が喫緊の課題となってい る(Ministry of Health, Labour and Welf are, 2000(a); Ministry of Health, Labou r and Welfare, 2012(b); Ministry of He alth, Labour and Welfare, (c))。従来の介 護予防は、ハイリスク者を対象に介入を行 っていたが、近年の介護予防は、まちづく りを通じて、例えば、社会参加の場を設置 するなど、全ての高齢者を対象に取り組ま れている。
先行研究では、高齢者の生活機能・認知 機能を維持する重要な要因として社会参加 が重要な役割を担うことが報告されている (Aida et al., 2011; Buchman et al., 20 09; Glass et al., 1999; Hsu, 2007; Iwas aki et al., 2002; Väänänen et al., 2009).
It is also suggested that promoting so cial participation could reduce healthca re costs (Yoshida et al., 2007) 。一方で、
社会参加の形態や人間関係の形態もSESに よって異なり(Moore, 1990)、同様に、社会 経済的背景(SES)によって、健康状態が 異なる多くの報告がある。このメカニズム には、厳しい社会経済状況におかれること による精神的ストレスが行動選択に影響を 及ぼすことや、社会経済状況が異なる集団 間で、選択行動に差が存在することなどが 指摘されている(Aida, 2010; Sisson KL 20 07)。これらのことから、社会参加の効果 は、適した社会参加のありかたもSESによっ て異なるのではないかと考えられる。しか
しながら、先行研究においては、社会参加 の効果は検討されているものの、参加がSE Sによって変化するのかどうかまでは検討 された報告は見あたらなかった。そこで、
本研究は、様々な社会活動への参加や参加 の形態とその後の要介護との関連における、
個人の社会経済背景の作用修飾効果につい て検討することを目的とした。
B. 研究方法 1. 用いたデータ
本研究は、AGES(Aichi Gerontological Evaluation Study 愛知老年学的評価研究)
プロジェクトの縦断データを用いた。調査 プロトコルの詳細はNishiら(Nishi et al.
2011)によって報告されているが、本稿で その概要を次に説明する。
調査対象地域は、半田市、常滑市、阿久 比町、武豊町、南知多町、美浜町の 6市町 村である。2003年10月に愛知県下の6市 町村に居住する 65 歳以上の要介護認定を 受けていない男女(男性 6,813 人、女性
7,473 人)を対象に、自記式アンケート調
査票を郵送した。半田、常滑市では 5,000 人を無作為抽出による標本調査、それ以外 の市町村では全数調査が行われた。28,152 人 か ら 回 答 が 得 ら れ 、 調 査 の 回 収 率 は
52.6%であった。その後、対象者を 4 年間
(1,461 日)追跡し、保険者から提供を受 けた要介護認定データを結合した。
分析には、12,991人のデータを用い、次
に述べる 1,813 人を無効回答として扱った。
無効回答としての基準は、ベースライン調 査時に日常生活動作(ADL)が非自立だっ た人1、追跡期間前に死亡・要介護認定を受
1 ベースライン時にADLが非自立だった回答者は、
けた人、要介護認定データと結合できなか った人、65歳未満の人、調査対象者名簿と 年齢や性別に矛盾があった人(年齢は4歳 以上ずれがあった場合を除外)とした。
調査実施には、日本福祉大学の倫理委員 会で承認を得たうえで実施され、データ利 用に当たっては、東京大学医学部の倫理委 員会の承認を得ている(No.10555)。
2. 測定
① 要介護認定
要介護認定状況については、市町村から 提供を受けた要介護認定データを用いた。4 年間(1,461 日)の追跡期間中に、保険者 から認定を受けたもので、要介護認定の発 生は要介護認定の申請日とした。
② 社会参加のタイプ
社会参加に関する項目は、「あなたは、次 にあげる会や組織に入っていますか」に対 して、「はい」「いいえ」と回答するもので ある。社会参加のタイプは8タイプに分類 した: (1)スポーツ関係のグループやクラ ブ; (2) 趣味の会; (3) ボランティアのグル ープ; (4) 市民運動・消費者運動; (5) 宗教団 体や会; (6) 政治関係の団体や会; (7) 町内 会・老人クラブ・消防団など (8) 業界団体・
同業団体。本研究では、先行研究において 要介護状態のリスク要因が確認されている 3 つの組織、すなわちスポーツ関係のグル ープやクラブ (Kanamori et al., 2012), 趣 味の会 (Takeda et al., 2010), ボランティ アのグループ (Li and Ferraro, 2005; Lum and Lightfoot, 2005; Musick, 2003)につい
観察期間の始めから要介護認定を受ける可能性が高 い状態にあったと考えられた。よって、イベント発生 に対するリスクが他の回答者と同等と考えにくいこ とから、ADL非自立者を除外した。
て、主として報告する。また、参加してい る組織で役割があるかについても検討した。
その質問項目は、「会や団体で、会長・世話 役・会計係などの役員をいずれかの組織で していますか」というものである。
③ 社会経済的状況(SES)
社会経済的状況は様々な指標があるが、
本研究ではSESの代表的な代理変数として 使われている、所得や教育年数を用いた (A dler et al., 1999)。所得は、等価所得を用 いた。等価所得とは、世帯所得を世帯人数 の平方根で割って計算したものである。そ れを、「200万未満」「200万以上400万未満」
「400万以上」の3グループと、未回答・無 回答者をグループ化した4つのグループを 作った。教育年数は、「あなたが受けられ た学校教育は何年間でしたか」という質問 に対し、「6年未満」「6-9年」「10-12年」
「13年以上」「その他」という回答を用い、
「その他」には無回答者を追加して5カテゴ リーに分けた。
④ 共変量
要介護認定と社会参加の関係を見た先行 研究を参考に (Kanamori et al 2014; Liao e
t al, 2011) 、年齢、婚姻状況、就労状況、3
大疾病(ガン、心臓病、脳卒中)の有無(自 己申告によるもの)、自治体ダミー変数を 共変量として用いた。婚姻状態は、「配偶 者がいる」「死別・離別した」「未婚」「そ の他」に分類した。就労は「現在、収入の あるお仕事はしていますか」という質問に
「している」という回答を用いた。
3. 分析
記述統計の確認後、Cox 比例ハザードモ デルを用いて、社会参加とその後の要介護
認定との関連について、男女を層化して分 析した。それぞれの社会参加と社会経済状 況の作用修飾効果を見るためには、それぞ れの会・組織への参加と等価世帯所得の各 グループ層(200 万未満、200 万以上 400 万未満、400万以上、無回答・その他)、お よび、会・組織への参加と教育年数層(6 年未満、6-9年、10-12 年、13 年以上、無 回答・その他)とを掛け合わせた交互作用 項を作った。さらに、教育年齢層と等価所 得階層をランク付けした順序尺度として作 成し、感度分析を行った。
C. 結果
回答者の平均年齢は、72.9歳であった(男 性72.3歳、女性73.3歳)。組織への参加割 合は、男性・女性ともに「町内会・老人ク ラブ・消防団など」への参加の割合が最も 高く(男性57.6%、女性58.4%)、次に「趣 味の会」への参加(男性27.5%、女性35.1%)、 スポーツ会計のグループやクラブ(男性
22.3%、女性 19.9%)であった。会やグル
ープへの参加している人のうち、会で役割 がある人は男性46.0%、女性 30.7%であっ た。社会経済的な属性の違いによる参加組 織や参加形態の違いについては、「ボランテ ィアグループ」「スポーツ関係のグループや クラブ」「趣味の会」では男女に共通して教 育年数層が高いほど参加割合が高かった。
所得階層との関係では、男性では教育年数 が高まるほどこれらの組織いずれへも参加 割合が高まっていたが、女性では中所得層 が 高 い 逆 U 字 型 の 傾 向 を 示 し て い た
(Table1、Supplementary Table1 and 2)。 次に、年齢・婚姻状況、就労の有無、等 価世帯所得、教育年数、疾病を調整して分
析した結果、先行研究と同様に、要介護認 定のリスクを軽減していた。統計的に有意 な結果についての述べると、男性について は、スポーツ参加(Hazard Ratio [HR] = 0.66; 95% confidence interval [CI]:
0.51,0.85) (Table 2, model 1); 趣味の会 (HR = 0.69; 95% CI: 0.55,0.87) (Table 3, model 1); 会での役割 (HR = 0.82; 95%
CI: 0.66,1.02) (Table 4, model 1)であった。
女性については、「スポーツ関係のグループ やクラブ」「趣味の会」への参加で要介護と 死亡のリスクを低下させており、「会や団体 での世話役」では要介護のリスクを下げて いた。ボランティアグループへの参加は明 らかな関係が見られなかった。
<修飾効果との関連>
社会参加形態と要介護・死亡との関連に おけるSESの作用修飾効果を検証した結果、
まず教育年数について、男性「スポーツ関 係のグループやクラブ」では、教育年数が 最も長い人をリファレンスグループとする と 、 教 育 年 数 が 短 い 人 の オ ッ ズ 比 は 5.61(95% CI: 1.59,19.8)であった (Table 2, model 2)。趣味の会への参加での作用修飾 について見ると、オッズ比は 3.97 (95% CI:
1.13,14.02) (Table3, model2)であった。女 性では明確な関連が見られなかった。男性 のボランティアグループへの参加は、所得 が最も低いグループにおいて、所得が最も 高いグループよりも、要介護認定のリスク を 3.74 倍高めている傾向が見られた(95%
CI: 0.81,17.23) (Table5, model3)。会での役 割については、教育年数が最も長いグルー プよりも最も低いグループは、要介護リス クが男性3.95倍(95% CI: 1.30,12.05)、女 性 3.13 倍(95% CI: 0.86,11.34)であった
(Table 4, model 2)。所得階層について見る と、最も所得が高いグループよりも最も低 い グ ル ー プ で は 、 男 性 2.33 (95% CI:
0.97,5.63)、女性1.56 (95% CI: 0.64,3.79) であった(Table 4, model 3)。
さらに、グループ参加数と要介護認定と の関連も検討した結果、最も教育年数が高 いグループと比較して最も教育年数が低い グループは1.47倍要介護のリスクが高まる 可能性が見られた (Appendix table1 and 2)。
D 考察
社会経済的な属性の違いによる参加組織 や参加形態の違いについては、「ボランティ アグループ」「スポーツ関係のグループやク ラブ」「趣味の会」では男女に共通して教育 年数層が高いほど参加割合が高かった。所 得階層との関係では、男性では教育年数が 高まるほどこれらの組織いずれへも参加割 合が高まっていたが、女性では顕著な関連 が見られなかった。組織参加とその後の要 介護認定との関連について、先行研究と同 様に、男女とも「スポーツ関係のグループ やクラブ」「趣味の会」ボランティアグルー プの参加」「町内会活動への参加」「会や組 織での世話役をしていること」が要介護リ スクの低減の可能性が見られた。これら関 係を学歴や所得が修飾するかについてみた ところ、男性では「スポーツ関係のグルー プやクラブ」、「会で世話役をしていること」
については、教育年数が長い人ほど参加に よる要介護りスクの低減効果が高い可能性 が示された。
教育年数が長いほど、また所得階層が高 くなるほど、男性は会やグループに参加し
ている割合が大きい傾向であった。社会参 加と教育年数における修飾効果について、
男性ではスポーツや趣味の会および世話役 において、教育年数が低い人ほど要介護リ スクが高まる可能性が示された。そのメカ ニズムにおいては、さらに検討する必要は あるが、たとえば同じスポーツの会でも、
SES によって参加している会の性質が異な る可能性があり、SES が高い人が選択する 会のほうが、活動強度やグループ内のメン バー同士の関係性が良好でありより健康保 護効果が高いといったことも考えられる。
健康と所得階層間のメカニズムとして、階 層によって行動様式が異なるために、健康 影響が異なるという行動・文化論的な仮説 が た て ら れ て い る (Socialist Health Association, 1980)。
また、別の解釈として、時にはスポーツ では、戦略的な活動が求められ、同様に、
世話役などのリーダー的な役割を担うにも ソーシャルスキルやマネジメント能力も必 要と考えられ、非認知能力との関連も考え られた(Heckman and James, 2006; Heckman and Kautz, 2013)。
また、女性は明瞭な傾向は示されなかっ た。これは、日本の女性においては健康や 健康行動について社会経済格差が見られに くいという先行研究の結果と一致している (Kagamimori et al., 2009)。一方で、過去の AGES の論文でも指摘されているように女 性の社会経済的状況については、男性とそ の意味合いが異なることから、測定法の問 題によりうまくとらえられていないことを 反映している可能性もある(Kagamimori et al., 2009; Kondo et al., 2009)。
本研究は大規模な縦断データを用いてお
り、また複数の社会活動について豊富な情 報があるなど、多くの利点を持っている。
しかし、解釈の際に留意すべき点として、
すべての回答は自己申告であるため、報告 バイアスの存在が考えられた。たとえば、
「趣味の会」について、公民館等の地域で 開講されている活動に対しては「はい」と 答えている確率は高いが、友人同士で集っ てプライベートで楽しむ会には組織参加し ているという認識を持っておらず、「いいえ」
と回答している可能性なども否定できない。
他にも選択バイアスとして、社会参加する かどうか、さらに、どの会やグループに参 加するかという選択の規定要因には個人の 性格や選好、文化的背景も影響されている と考えられるが、それらと社会経済的な要 因との交絡についてはデータの制約から分 からない。また、本研究はベースライン時 点での経済状況がその後の要介護認定との 関連を示すという観察にとどまるもので、
そこに至ったプロセス(ライフコース等)
は検討していないという選択バイアスも考 えられた。これらは今後の課題としたい。
E 結論
現在、国や各自治体では、高齢者の生き がいづくりや介護予防の推進のために、社 会参加の促進に向けた様々な施策に取り組 んでいる。高齢者の社会参加の意欲も徐々 に増しており、平成10年では参加したいと 答えた高齢は47.9%であったのが、平成15
年には47.7%、平成20年は54.1%と次第に
増加し、平成20年では「参加したい」「参 加したいが事情があって参加できない」を 合わせると7割の人がグループ活動の参加 に意欲を見せているというデータもある
(Cabinet Office, Government of Japan, 2013)。社会参加は健康に良い影響を与える ことは多くの研究により示唆されていると ころではあるが(Ichida 2013 ,Kanamori 2012)、本研究の結果から見ると、社会参加 しようとする意欲に影響を与える行動の選 択要因にも、参加したい活動の種類が個人 の社会経済的背景によって違いがある可能 性を示唆しており、今後の地域介入の際に 検討すべき課題であるといえよう。本研究 の結果からは、特に男性において、教育歴 の違いによって適した会や組織への参加形 態や活動の種類の違いがあることが示唆さ れた。更なる検討が必要ではあるが、この ような知見を踏まえ、社会参加の環境を整 備する際には、例えば、地域の平均的なSES に応じて、活動のプログラム内容を考慮す るなど、個人や地域の社会経済的な背景を ふまえた場作りの展開が効果的と考えられ た。
F. 研究発表
1. Toyo A, Kodo N*, Kondo K. Social participation and the onset of functional disability by socioeconomic status and activity type: the AGES cohort study.
Preventive Medicine. 印刷中
G. 知的財産権の出願・登録状況(予定を含 む)
特になし
【 引用文献 】
Adler, N.E., Ostrove, J., M. 1999.
Socioeconomic status and health: what we know and what we don't. Ann. N. Y.
Acad. Sci. 896 (1), 3–15.
Aida, J. 2010. Social factors affecting health (2) dental diseases. Nihon Koshu Eisei Zasshi 55 (5), 410–414. (in Japanese) Aida, J., Kondo, K., Hirai, H., Subramanian,
S.V., Murata, C., Kondo, N., Ichida, Y., Shirai, K., Osaka, K. 2011. Assessing the association between all cause mortality and multiple aspects of individual social capital among the older Japanese. BMC Public Health 11 (1), 499.
Buchman, A. S., Boyle, P. A., Wilson, R. S, Fleischman, D.A., Leurgans, S., Bennett, D.A. 2009. Association between late-life social activity and motor decline in older adults. Arch. Intern. Med. 169 (12), 1139-1146.
Cabinet Office, Government of Japan. 2012.
Annual report on the aging society.
Available from,
http://www8.cao.go.jp/kourei/whitepaper /w-2012/zenbun/pdf/1s2s_5.pdf (Date Accessed – 10/9/15.). (in Japanese) Glass, T.A., Medes de Leon, C., Marottoli, R.A.,
Berkman, L.F. Population based study of social and productive activities as predictors of survival among elderly Americans. BMJ. 19 (7208), 478–483.
Heckman, J.J., Kautz, T. 2013. Fostering and measuring skills: interventions that improve character and cognition.
National Bureau of Economic Research Working Paper, 19656.
Heckman, J.J., Stixrud J., Urzua, S. 2006. The effects of cognitive and noncognitive abilities
on labor market outcomes and social behavior. J. Labor Econ. 24 (3), 411–
482.
Hsu, H.C. 2007. Does social participation by the elderly reduce mortality and cognitive impairment? Aging Ment.
Health 11 (6), 699–707.
Ichida, Y., Hirai, H., Kondo, K., Kawachi, I., Takeda, T., Endo, H. 2013. Does social participation improve self-rated health in
the older population? A
quasi-experimental intervention study.
Soc. Sci. Med. 94, 83–90.
Iwasaki, M., Otani, T., Sunaga, R., Miyazaki, H., Xiao, L., Wang, N., Yosiaki, S., Suzuki, S. 2002. Social networks and mortality based on the Komo-Ise cohort study in Japan. Int. J. of Epidemiol. 31 (6), 1208–1218.
Kagamimori, S., Gaina, A., Nasermoaddli, A.
2009. Socioeconomic status and health in the Japanese population. Soc. Sci. Med.
68 (12), 2152–2160.
Kanamori, S., Kai, Y., Kondo, K., Hirai, H., Ichida, Y., Suzuki, K., Kawachi, I. 2012.
Participation in sports organizations and the prevention of functional disability in older Japanese: the AGES Cohort Study.
PloS. One 7 (11), e51061.
Kanamori, S., Kai, Y., Aida, J., Kondo, K., Kawachi, I., Hirai, H., Shirai K., Ishikawa, Y., Suzuki, K., and The JAGES
Group 2014. Social Participation and the Prevention of Functional Disability in older Japanese: the AGES Cohort Study.
PloS. One 9 (6), e99638.
Kondo, N., Kawachi, I., Hirai, H., Kondo, K., Subramanian, S. V., Hanibuchi, T., Yamagata, Z. 2009. Relative deprivation and incident functional disability among older Japanese women and men:
prospective cohort study. J. Epidemiol.
Community Health 63 (6), 461–467.
Li, Y., Ferraro, K.F. 2005. Volunteering and depression in later life: social benefit or selection processes? J. Health Soc. Beh.
46 (1), 68–84.
Liao WC, Li CR, Lin YC, Wang CC, Chen YJ, et al. 2011. Healthy behaviors and onset of functional disability in older adults:
results of a national longitudinal study.
Journal of the American geriatrics society 59: 200–206.
Lum, TY, Lightfoot E. 2005. The effects of volunteering on the physical and mental health of older people. Res. Aging 27 (1), 31–55.
Ministry of Health, Labour and Welfare 2000(a). Survey on the trend of medical care expenditures Available from, http://www.mhlw.go.jp/topics/medias/s- med/00/1.html(Date Accessed – 10/10/14). (in Japanese)
Ministry of Health, Labour and Welfare 2012(b). Survey on the trend of medical care expenditures Available from, http://www.mhlw.go.jp/topics/medias/yea r/12/index.html(Date Accessed –
10/10/14). (in Japanese)
Ministry of Health, Labour and Welfare (c).
Trend in long term care benefit expenditure and insurance fee. Available from,
http://www.mhlw.go.jp/topics/kaigo/
zaisei/sikumi.html (Date Accessed – 10/10/14). (in Japanese)
Moore, G. 1990. Structural determinants of men's and women's personal networks.
Am. Sociol. Rev. 55 (5), 726–735.
Musick, M.A., Wilson, J. 2003. Volunteering and depression: the role of psychological and social resources in different age groups. Soc.
Sci. Med. 56 (2), 259–269.
Nishi, A., Kondo, K., Hirai, H., Kawachi, I.
2011. Cohort profile: the AGES 2003 Cohort Study in Aichi, Japan. J.
Epidemiol. 21 (2), 151–157.
Sisson, K.L. Theoretical explanations for social inequalities in oral health. 2007.
Community Dent. Oral. Epidemiol. 35 (2), 81–88.
Socialist Health Association. 1980. The black report 1980. Available from, http://www.sochealth.co.uk/resources/pu blic-health-and-wellbeing/poverty-and-in equality/the-black-report-1980/ (Date Accessed – 10/10/14.).
Takeda, T., Kondo, K., Hirai, H. 2010.
Psychosocial risk factors involved in progressive dementia-associated senility among the elderly residing at home:
AGES project–three year cohort longitudinal study. Nihon Koshu Eisei Zasshi 57 (12),1054-1065. (in Japanese) Väänänen, A., Murray, M., Koshinen, A.,
Vahtera, J., Kouvonen, A., Kivimäki, M.
2009. Engagement in cultural activities and cause-specific mortality: prospective cohort study. Prev. Med. 49 (2–3),142–
147.
Yoshida, H., Fujiwara, Y., Amano, H., Kumagai, S., Watanabe, N., Sangyoon, L., Mori, S., Shinkai S. 2007. Economic evaluation of
disability prevention programs for community-dwelling elderly – secular trend analyses of medical and care expenses comparing participants and non-participants in the programs. Nihon Koshu Eisei Zasshi 54 (3), 156–167. (in Japanese)
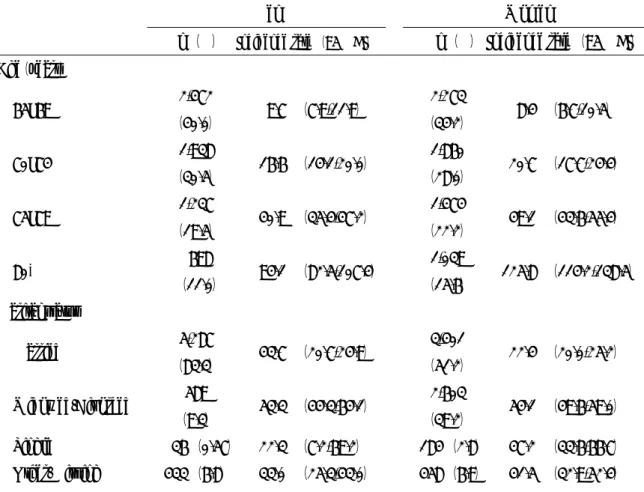
Table 1. Incidence rates (1,000 person-years) of functional disability by subjects’ characteristics based on data from the Japan Aichi Gerontological Evaluation Study (AGES)
Men Women
n (%) Incidence rate (95% CI) n (%) Incidence rate (95% CI)
Age(years)
65–69 2,472
(40.0) 9.7 (7.9,11.9) 2,273
(34.2) 8.4 (6.7,10.5)
70–74 1,938
(30.5) 16.6 (14.1,20.0) 1,860
(28.0) 20.7 (17.7,24.4)
75–79 1,237
(19.5) 40.9 (35.4,47.2) 1,474
(22.2) 49.1 (43.6,55.4)
80+ 698
(11.0) 94.1 (82.5,107.4) 1,039
(15.6) 125.8 (114.2,138.5)
Marital status
Married 5,287
(83.3) 43.7 (20.7,24.9) 3,401
(51.2) 22.4 (20.0,25.2)
Widowed/Divorced 589
(9.3) 53.3 (44.3,64.1) 2,603
(39.2) 54.1 (49.6,59.0)
Single 36 (0.57) 22.3 (7.2,69.2) 184 (2.8) 47.2 (33.6,66.7) Other/Missing 433 (6.8) 33.0 (25.3,43.0) 458 (6.9) 41.5 (32.9,52.4)
Medical condition(3 major diseasesa)
Yes 1,348
(21.3) 34.9 (30.1,40.4) 948
(14.3) 59.6 (52.0,68.4)
No 4,997
(78.8) 23.7 (21.6,26.0) 5,698
(85.7) 32.7 (30.4,35.2)
Employment status
Yes 2,048
(32.3) 12.0 (9.8,14.6) 1,169
(17.6) 16.5 (13.2,20.7)
No 4,188
(66.0) 32.9 (30.2,35.9) 5,325
(80.1) 40.5 (37.8,43.4) Missing 109 (1.7) 34.2 (20.3,57.7) 152 (2.30) 51.9 (36.0,74.6)
Equivalized income(million yen)
<1.99 2,192
(34.6) 26.4 (23.1,30.1) 2,115
(31.8) 35.7 (31.7,40.0)
2.00–3.99 2,725
(43.0) 22.2 (19.5,25.2) 1,992
(30.0) 25.3 (22.0,29.2) 4.00+ 649 (10.2) 20.0 (15.2,26.4) 575 (8.7) 35.5 (28.3,44.4)
Missing 779 (12.3) 44.1 (37.1,52.5) 1,964(30) 49.1 (44.2,54.5)
Educational attainment(years)
Very low(≦5) 143 (2.3) 63.9 (45.2,90.3) 399 (6.0) 93.7 (78.7,111.7)
Low(6–9) 3,230
(50.9) 29.9 (27.0,33.1) 3,604
(54.2) 32.4 (29.5,35.5) Middle(10–12) 1,709
(26.9) 20.3 (17.2,24.1) 1,921
(28.9) 31.7 (27.8,36.1) High(≧13) 874 (13.8) 17.4 (13.5,22.5) 328 (4.9) 30.0 (21.7,41.3)
Other/Missing 389 (6.1) 26.3 (19.2,36.0) 394 (5.9) 50.5 (40.1,63.5)
Participation in group activities
Sports group or club
Yes 1,251
(22.3) 13.7 (10.8,17.4) 1,127
(19.9) 13.9 (10.8,17.8)
No 4,351
(77.7) 27.2 (24.8,29.9) 4,537
(80.1) 39.1 (36.2,42.2)
Hobby group
Yes 1,549
(27.4) 16.3 (13.4,19.8) 2,016
(35.1) 19.9 (17.0,23.3)
No 4,096 26.6 (24.1,29.3) 3,728 42.0 (38.7,45.6)
(72.6) (64.9)
Volunteer group
Yes 623
(11.1) 14.5 (10.4,20.2) 563
(9.9) 18.0 (13.1,24.6)
No 5,001
(88.9) 25.1 (22.9,27.4) 5,139
(90.1) 35.7 (33.1,38.5)
Facilitator role
Yes 2,073
(46.0) 15.8 (13.3,18.8) 1,340
(30.7) 18.3 (15.0,22.4)
No 2,430
(54.0) 27.6 (24.4,31.2) 3,023
(69.3) 37.6 (34.2,41.3)
The number of participating groups(range:0-3)
0 3,324
(60.9) 28.4 (25.6,31.4) 3,282
(60.3) 44.8 (41.2,48.8)
1 1,294
(23.7) 22.5 (18.7,27.1) 1,233
(22.7) 22.6 (18.7,27.3)
2 674(12.3) 10.6 (7.3,15.3) 707(13.0) 11.2 (7.9,15.9)
3 168(3.1) 3.0 (0.7,12.0) 218(4.0) 14.1 (8.0,24.8)
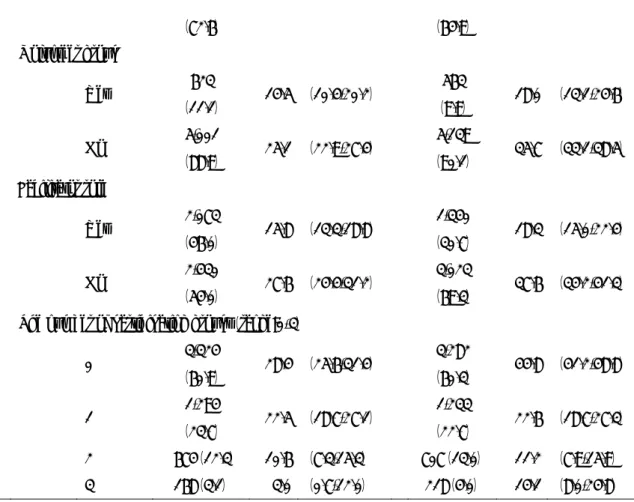
Table 2. Hazard ratios for incident functional disability (95% confidence intervals) by participation in sports group activities: results of Cox regression analysis
Men Model 1 Model 2 Model 3
Participation in sports group
activities 0.66 (0.51,0.85) 0.43 (0.19,1.02) 0.17 (0.17,0.93)
× Education very low 5.61 (1.59,19.82)
× Education low 1.74 (0.70,4.35)
× Education middle 0.93 (0.33,2.59)
× Education high 1.00(ref)
× Income low 0.82 (0.82,5.59)
× Income middle 0.48 (0.48,3.31)
× Income high 1.00 (ref)
Income low (<1.99) 1.11 (0.79,1.56) 1.09 (0.78,1.54) 0.98 (0.68,1.42) Income middle (2.00–3.99) 0.92 (0.66,1.28) 0.90 (0.65,1.26) 0.61 (0.61,1.24)
Income high (4.00+) 1.00 (ref) 1.00 (ref) 1.00 (ref)
Education very low (≦5) 1.89 (1.15,3.09) 1.49 (0.86,2.57) 1.13 (1.13,3.04)
Education low (6–9) 1.27 (0.94,1.71) 1.19 (0.87,1.63) 0.94 (0.94,1.70)
Education middle (10–12) 1.22 (0.89,1.69) 1.24 (0.88,1.74) 0.89 (0.89,1.69)
Education high (≧13) 1.00(ref) 1.00(ref) 1.00 (ref)
Women Model 1 Model 2 Model 3
Participation in sports group
activities 0.58 (0.44,0.76) 0.34 (0.10, 1.14) 0.12 (0.12,0.93)
× Education very low 0.98 (0.16,6.18)
× Education low 1.47 (0.42,5.17)
× Education middle 2.03 (0.57,7.2)
× Education high 1.00 (ref)
× Income low 0.57 (0.57,5.23)
× Income middle 0.33 (0.33,3.47)
× Income high 1.00 (ref)
Income low (<1.99) 1.24 (0.94,1.63) 1.24 (0.94,1.63) 0.90 (0.90,1.58)
Income middle (2.00–3.99) 1.02 (0.77,1.35) 1.02 (0.77,1.36) 0.76 (0.76,1.36)
Income high (4.00+) 1.00(ref) 1.00 (ref) 1.00 (ref)
Education very low (≦5) 0.95 (0.63,1.44) 0.90 (0.59,1.39) 0.62 (0.62,1.42)
Education low (6–9) 0.75 (0.52,1.10) 0.71 (0.48,1.06) 0.51 (0.51,1.07)
Education middle (10–12) 0.70 (0.48,1.03) 0.65 (0.43,0.97) 0.47 (0.47,1.01)
Education high (≧13) 1.00 (ref) 1.00 (ref) 1.00 (ref)
Adjusted for age, marital status, employment status, the three major diseases (cancer, heart disease, and stroke), and municipality.
Income (million yen) denotes annual equivalized household income.
Units: education = years, income = million yen
Table 3. Hazard ratios for incident functional disability (95% confidence intervals) by participation in hobby group activities: results of Cox regression analysis
Men Model 1 Model 2 Model 3
Participation in hobby group
activities 0.69 (0.55,0.87) 0.56 (0.30,1.05) 0.62 (0.31,1.23)
× Education very low 3.97 (1.13,14.02)
× Education low 1.41 (0.70,2.82)
× Education middle 0.87 (0.40,1.90)
× Education high 1.00(ref)
× Income low 1.38 (0.63,3.02)
× Income middle 1.03 (0.47,2.22)
× Income high 1.00 (ref)
Income low (<1.99) 1.09 (0.77,1.54) 1.09 (0.77,1.54) 1.02 (0.69,1.51)
Income middle (2.00–3.99) 0.92 (0.65,1.29) 0.91 (0.65,1.27) 0.91 (0.61,1.34)
Income high (4.00+) 1.00(ref) 1.00(ref) 1.00(ref)
Education very low (≦5) 1.71 (1.02,2.84) 1.43 (0.81,2.50) 1.72 (1.03,2.87)
Education low (6–9) 1.29 (0.95,1.74) 1.19 (0.85,1.67) 1.28 (0.95,1.73)
Education middle (10–12) 1.19 (0.86,1.65) 1.21 (0.84,1.75) 1.19 (0.86,1.64)
Education high (≧13) 1.00 (ref) 1.00 (ref) 1.00 (ref)
Women Model 1 Model 2 Model 3
Participation in hobby group
activities 0.67 (0.55,0.80) 0.64 (0.31,1.33) 0.51 (0.28,0.92)
× Education very low 1.02 (0.35,2.95)
× Education low 1.15 (0.53,2.49)
× Education middle 0.89 (0.40,1.97)
× Education high 1.00(ref)
× Income low 1.16 (0.59,2.27)
× Income middle 1.08 (0.54,2.14)
× Income high 1.00(ref)
Income low (<1.99) 1.22 (0.93,1.61) 1.23 (0.94,1.61) 1.18 (0.87,1.59)
Income middle (2.00–3.99) 1.01 (0.77,1.34) 1.01 (0.77,1.34) 1.00 (0.73,1.36)
Income high (4.00+) 1.00(ref) 1.00(ref) 1.00(ref)
Education very low (≦5) 0.95 (0.63,1.45) 0.94 (0.56,1.56) 0.96 (0.63,1.46)
Education low (6–9) 0.77 (0.52,1.12) 0.74 (0.46,1.19) 0.76 (0.52,1.11)
Education middle (10–12) 0.76 (0.52,1.12) 0.78 (0.48,1.28) 0.75 (0.51,1.10)
Education high (≧13) 1.00(ref) 1.00(ref) 1.00(ref)
Adjusted for age, marital status, employment status, the three major diseases (cancer, heart disease, and stroke), and municipality.
Income (million yen) denotes annual equivalized household income.
Units: education = years, income = million yen
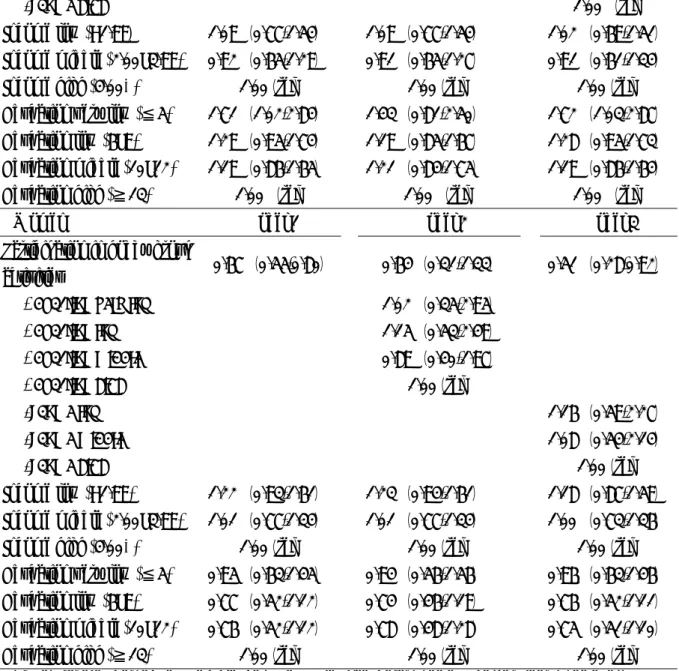
Table 4. Hazard ratios for incident functional disability (95% confidence intervals) by having a facilitator role in a group: results of Cox regression analysis
Men Model 1 Model 2 Model 3
Have facilitator role 0.82 (0.66,1.02) 0.76 (0.41,1.44) 0.39 (0.18,0.87)
× Education very low 3.95 (1.30,12.05)
× Education low 1.09 (0.54,2.17)
× Education middle 0.60 (0.27,1.33)
× Education high 1.00 (ref)
× Income low 2.33 (0.97,5.63)
× Income middle 1.72 (0.72,4.10)
× Income high 1.00 (ref)
Income low (<1.99) 1.09 (0.73,1.62) 1.08 (0.72,1.60) 0.82 (0.52,1.31)
Income middle (2.00–3.99) 0.99 (0.68,1.46) 0.99 (0.67,1.46) 0.84 (0.54,1.31)
Income high (4.00+) 1.00 (ref) 1.00 (ref) 1.00 (ref)
Education very low (≦5) 2.17 (1.22,3.84) 1.36 (0.64,2.91) 2.14 (1.21,3.78)
Education low (6–9) 1.40 (1.00,1.97) 1.36 (0.88,2.09) 1.39 (0.99,1.96)
Education middle (10–12) 1.16 (0.79,1.68) 1.37 (0.86,2.20) 1.15 (0.79,1.68)
Education high (≧13) 1.00 (ref) 1.00 (ref) 1.00 (ref)
Women Model 1 Model 2 Model 3
Have facilitator role 0.70 (0.56,0.88) 0.30 (0.10,0.87) 0.45(0.20, 1.00)
× Education very low 3.13 (0.86,11.34)
× Education low 2.22 (0.73,6.81)
× Education middle 2.69 (0.86,8.42)
× Education high 1.00 (ref)
× Income low 1.56(0.64, 3.79)
× Income middle 1.46(0.59, 3.63)
× Income high 1.00(ref)
Income low (<1.99) 1.15 (0.84,1.58) 1.14 (0.83,1.57) 1.08(0.76, 1.52)
Income middle (2.00–3.99) 0.97(0.70,1.34) 0.96 (0.69,1.32) 0.92(0.65, 1.30)
Income high (4.00+) 1.00 (ref) 1.00 (ref) 1.00 (ref)
Education very low (≦5) 0.66 (0.41,1.08) 0.52 (0.31,0.89) 0.65 (0.40,1.06)
Education low (6–9) 0.63 (0.41,0.96) 0.52 (0.33,0.83) 0.62 (0.41,0.95)
Education middle (10–12) 0.57 (0.37,0.87) 0.45 (0.28,0.73) 0.55 (0.36,0.85)
Education high (≧13) 1.00 (ref) 1.00(ref) 1.00 (ref)
Adjusted for age, marital status, employment status, the three major diseases (cancer, heart disease, and stroke), and municipality.
Income (million yen) denotes annual equivalized household income.
Units: education = years, income = million yen
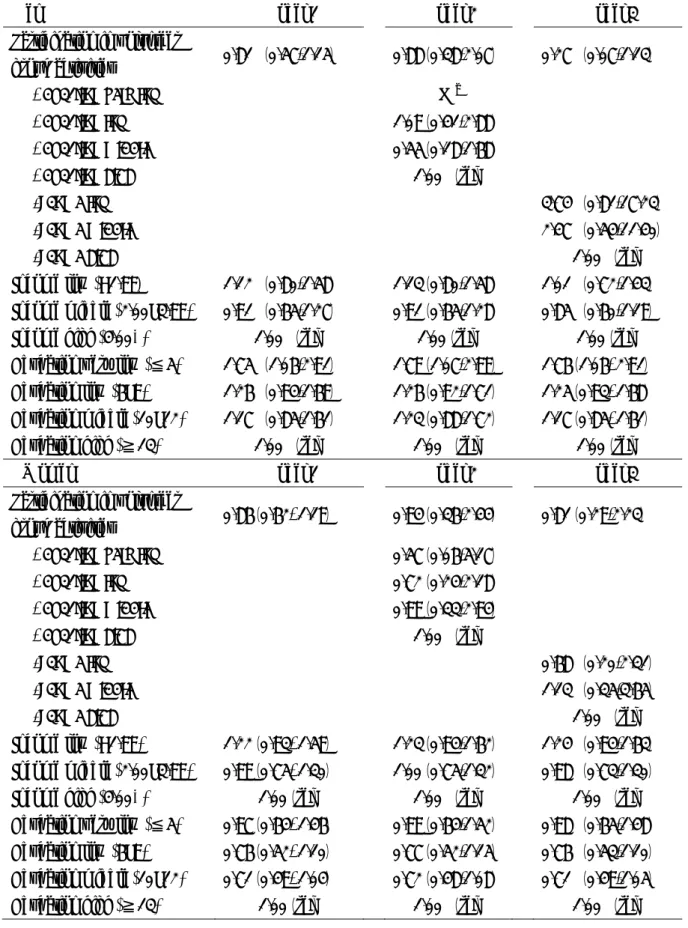
Table 5. Hazard ratios for incident functional disability (95% confidence intervals) by participation in volunteer group activities: results of Cox regression analysis
Men Model 1 Model 2 Model 3
Participation in volunteer
group activities 0.81 (0.57,1.15) 0.88(0.38,2.07) 0.27 (0.07,1.13)
× Education very low ―a
× Education low 1.09(0.41,2.88)
× Education middle 0.55(0.18,1.68)
× Education high 1.00 (ref)
× Income low 3.74 (0.81,17.23)
× Income middle 2.47 (0.54,11.40)
× Income high 1.00 (ref)
Income low (<1.99) 1.12 (0.80,1.58) 1.13(0.80,1.58) 1.01 (0.72,1.43)
Income middle (2.00–3.99) 0.91 (0.65,1.27) 0.91(0.65,1.28) 0.85 (0.60,1.19)
Income high (4.00+) 1.00 (ref) 1.00(ref) 1.00(ref)
Education very low (≦5) 1.75 (1.06,2.91) 1.79(1.07,2.99) 1.76(1.06, 2.91)
Education low (6–9) 1.26 (0.94,1.69) 1.26(0.92,1.71) 1.25(0.93, 1.68)
Education middle (10–12) 1.17 (0.85,1.61) 1.23(0.88,1.72) 1.17(0.85, 1.61)
Education high (≧13) 1.00 (ref) 1.00 (ref) 1.00(ref)
Women Model 1 Model 2 Model 3
Participation in volunteer
group activities 0.86(0.62, 1.19) 0.94(0.36,2.44) 0.81(0.29,2.23)
× Education very low 0.57(0.06,5.17)
× Education low 0.72(0.24,2.18)
× Education middle 0.99(0.33,2.94)
× Education high 1.00 (ref)
× Income low 0.68 (0.20,2.31)
× Income middle 1.13 (0.35,3.65)
× Income high 1.00 (ref)
Income low (<1.99) 1.22(0.93, 1.59) 1.23(0.94,1.62) 1.24 (0.94,1.63) Income middle (2.00–3.99) 0.99(0.75, 1.30) 1.00(0.75,1.32) 0.98 (0.73,1.30)
Income high (4.00+) 1.00(ref) 1.00 (ref) 1.00 (ref)
Education very low (≦5) 0.97(0.64, 1.46) 0.99(0.64,1.52) 0.98 (0.65,1.48) Education low (6–9) 0.76(0.52, 1.10) 0.77(0.52,1.15) 0.76 (0.53,1.10) Education middle (10–12) 0.71(0.49, 1.04) 0.72(0.48,1.08) 0.71 (0.49,1.05) Education high (≧13) 1.00(ref) 1.00 (ref) 1.00 (ref)
a Values could not be estimated because there were too few cases.
Adjusted for age, marital status, employment status, the three major diseases (cancer, heart disease, and stroke), and municipality.
Income (million yen) denotes annual equivalized household income.
Units: education = years, income = million yen
図1.
※
Volunteer group:
few
コックスハザードモデルによる予測値:教育年数と社会参加の有無との交互作用項
軸: 参加経験なし,
Volunteer group:
few cases.
コックスハザードモデルによる予測値:教育年数と社会参加の有無との交互作用項
参加経験なし,
Volunteer group: Value and 95% confidence interval could not be estimated because there were too コックスハザードモデルによる予測値:教育年数と社会参加の有無との交互作用項
参加経験あり
Value and 95% confidence interval could not be estimated because there were too コックスハザードモデルによる予測値:教育年数と社会参加の有無との交互作用項
参加経験あり
Value and 95% confidence interval could not be estimated because there were too コックスハザードモデルによる予測値:教育年数と社会参加の有無との交互作用項
Value and 95% confidence interval could not be estimated because there were too コックスハザードモデルによる予測値:教育年数と社会参加の有無との交互作用項
Value and 95% confidence interval could not be estimated because there were too コックスハザードモデルによる予測値:教育年数と社会参加の有無との交互作用項
Value and 95% confidence interval could not be estimated because there were too コックスハザードモデルによる予測値:教育年数と社会参加の有無との交互作用項
Value and 95% confidence interval could not be estimated because there were too
図2. 2. コックスハザードモデルによる予測値:所得階層と社会参加の有無との交互作用項コックスハザードモデルによる予測値:所得階層と社会参加の有無との交互作用項コックスハザードモデルによる予測値:所得階層と社会参加の有無との交互作用項コックスハザードモデルによる予測値:所得階層と社会参加の有無との交互作用項コックスハザードモデルによる予測値:所得階層と社会参加の有無との交互作用項コックスハザードモデルによる予測値:所得階層と社会参加の有無との交互作用項コックスハザードモデルによる予測値:所得階層と社会参加の有無との交互作用項コックスハザードモデルによる予測値:所得階層と社会参加の有無との交互作用項
図 3.
ボランティアの
※ Participation three groups people
3. コックスハザードモデルによる予測値:教育年数とグループ参加合計数(スポーツ・趣味・
ボランティアの3
Participation three groups people.
コックスハザードモデルによる予測値:教育年数とグループ参加合計数(スポーツ・趣味・
3グループ)との交互作用項
Participation three groups
コックスハザードモデルによる予測値:教育年数とグループ参加合計数(スポーツ・趣味・
グループ)との交互作用項
in education very low group
コックスハザードモデルによる予測値:教育年数とグループ参加合計数(スポーツ・趣味・
グループ)との交互作用項
in education very low group
コックスハザードモデルによる予測値:教育年数とグループ参加合計数(スポーツ・趣味・
in education very low group: Not estimated because there were few コックスハザードモデルによる予測値:教育年数とグループ参加合計数(スポーツ・趣味・
imated because there were few コックスハザードモデルによる予測値:教育年数とグループ参加合計数(スポーツ・趣味・
imated because there were few コックスハザードモデルによる予測値:教育年数とグループ参加合計数(スポーツ・趣味・
imated because there were few
図 4.
ボランティアの
. コックスハザードモデルによる予測値:所得階層とグループ参加合計数(スポーツ・趣味・
ボランティアの3
コックスハザードモデルによる予測値:所得階層とグループ参加合計数(スポーツ・趣味・
3グループ)との交互作用項
コックスハザードモデルによる予測値:所得階層とグループ参加合計数(スポーツ・趣味・
グループ)との交互作用項
コックスハザードモデルによる予測値:所得階層とグループ参加合計数(スポーツ・趣味・
グループ)との交互作用項
コックスハザードモデルによる予測値:所得階層とグループ参加合計数(スポーツ・趣味・
コックスハザードモデルによる予測値:所得階層とグループ参加合計数(スポーツ・趣味・
コックスハザードモデルによる予測値:所得階層とグループ参加合計数(スポーツ・趣味・
コックスハザードモデルによる予測値:所得階層とグループ参加合計数(スポーツ・趣味・
Appendix 1. Hazard ratios (95% confidence intervals) for incident functional disability by one point increase in the number of participating groups (ranger: 0-8) among men of the very low educational background.
Men Model 1 Model 2 Model 3
Participation in group activities 0.92 (0.85,0.99) 0.93 (0.75,1.14) 0.77 (0.61,0.96)
× Education very low 1.47 (1.02,2.14)
× Education low 1.02 (0.81,1.27)
× Education middle 0.86 (0.67,1.10)
× Education high 1.00 (ref)
× Income low 1.26 (0.97,1.62)
× Income middle 1.15 (0.89,1.48)
× Income high 1.00 (ref)
Income low (<1.99) 1.06 (0.75,1.50) 1.03 (0.73,1.46) 0.76 (0.47,1.23) Income middle (2.00–3.99) 0.88 (0.63,1.23) 0.85 (0.61,1.20) 0.71 (0.44,1.14)
Income high (4.00+) 1.00 (ref) 1.00 (ref) 1.00 (ref)
Education very low (≦5) 1.70 (1.00,2.87) 1.19 (0.59,2.43) 1.69 (1.00,2.85) Education low (6–9) 1.33 (0.98,1.81) 1.31 (0.84,2.05) 1.32 (0.97,1.80) Education middle (10–12) 1.26 (0.90,1.76) 1.54 (0.95,2.50) 1.26 (0.90,1.75)
Education high (≧13) 1.00 (ref) 1.00 (ref) 1.00 (ref)
Women Model 1 Model 2 Model 3
Participation in group activities 0.83 (0.77,0.90) 0.92 (0.71,1.19) 0.80 (0.64,1.00)
× Education very low 0.87 (0.61,1.25)
× Education low 0.91 (0.69,1.21)
× Education middle 0.86 (0.64,1.15)
× Education high 1.00 (ref)
× Income low 0.96 (0.74,1.25)
× Income middle 0.99 (0.76,1.30)
× Income high 1.00 (ref)
Income low (<1.99) 1.22 (0.92,1.61) 1.22 (0.92,1.61) 1.24 (0.84,1.84) Income middle (2.00–3.99) 1.00 (0.75,1.33) 1.00 (0.75,1.34) 1.00 (0.66,1.51)
Income high (4.00+) 1.00 (ref) 1.00 (ref) 1.00 (ref)
Education very low (≦5) 0.92 (0.60,1.40) 1.06 (0.60,1.87) 0.92 (0.61,1.41) Education low (6–9) 0.75 (0.51,1.10) 0.84 (0.50,1.42) 0.75 (0.51,1.10) Education middle (10–12) 0.72 (0.49,1.07) 0.87 (0.50,1.50) 0.72 (0.49,1.06)
Education high (≧13) 1.00 (ref) 1.00 (ref) 1.00 (ref)
Adjusted for age, marital status, employment status, the three major diseases(cancer, heart disease, and stroke), and six municipalities.
Income(million yen) denotes annual equivalized household income.
Groups : sports, hobby, volunteer group, citizen/consumer, religious, political, local community group and industry or trade associations.
Appendix 2. Hazard ratios (95% confidence intervals) for incident functional disability by one point increase in the number of participating groups (sports, hobby, and volunteer groups only; range: 0-3) among men of the very low educational background. .
Men Model 1 Model 2 Model 3
Participation in group activities 0.75(0.66,0.87) 0.71(0.49,1.03) 0.62(0.41,0.95)
× Education very low 2.39(1.11,5.16)
× Education low 1.18(0.78,1.80)
× Education middle 0.77(0.48,1.25)
× Education high 1.00 (ref)
× Income low 1.40(0.87,2.25)
× Income middle 1.10(0.69,1.75)
× Income high 1.00 (ref)
Income low (<1.99) 1.07(0.75,1.51) 1.06(0.75,1.49) 0.92(0.62,1.38) Income middle (2.00–3.99) 0.89(0.63,1.25) 0.88(0.62,1.23) 0.84(0.56,1.24)
Income high (4.00+) 1.00 (ref) 1.00 (ref) 1.00 (ref)
Education very low (≦5) 1.66(1.00,2.77) 1.34(0.75,2.41) 1.68(1.01,2.79) Education low (6–9) 1.24(0.92,1.68) 1.17(0.82,1.66) 1.24(0.92,1.67) Education middle (10–12) 1.20(0.87,1.67) 1.33(0.90,1.94) 1.20(0.87,1.66)
Education high (≧13) 1.00 (ref) 1.00 (ref) 1.00 (ref)
Women Model 1 Model 2 Model 3
Participation in group activities 0.72(0.64,0.82) 0.73(0.48,1.12) 0.56(0.37,0.87)
× Education very low 0.66(0.29,1.55)
× Education low 0.99(0.62,1.56)
× Education middle 0.94(0.59,1.52)
× Education high 1.00 (ref)
× Income low 1.16(0.71,1.88)
× Income middle 1.14(0.70,1.86)
× Income high 1.00 (ref)
Income low (<1.99) 1.25(0.95,1.65) 1.26(0.96,1.67) 1.19(0.88,1.62) Income middle (2.00–3.99) 1.02(0.77,1.36) 1.03(0.77,1.37) 0.98(0.72,1.35)
Income high (4.00+) 1.00 (ref) 1.00 (ref) 1.00 (ref)
Education very low (≦5) 0.86(0.56,1.31) 0.89(0.54,1.46) 0.85(0.56,1.30) Education low (6–9) 0.70(0.48,1.03) 0.70(0.44,1.12) 0.69(0.47,1.01) Education middle (10–12) 0.69(0.47,1.02) 0.71(0.44,1.15) 0.68(0.46,1.00)
Education high (≧13) 1.00 (ref) 1.00 (ref) 1.00 (ref)
Adjusted for age, marital status, employment status, the three major diseases(cancer, heart disease, and stroke), and six municipalities.
Income(million yen) denotes annual equivalized household income.
Three groups activity: sports, hobby, volunteer group
Appendix 3. Estimates (95% confidence intervals) of Cox proportional hazard models for political group/organizations participation
Men Model 1 Model 2 Model 3
Participation in political group activities 1.06 (0.80,1.40) 1.15 (0.52,2.54) 0.53 (0.19,1.49)
× Education very low 1.29 (0.30,5.56)
× Education low 1.07 (0.45,2.57)
× Education middle 0.59 (0.21,1.61)
× Education high 1.00 (ref)
× Income low 2.38 (0.78,7.27)
× Income middle 1.67 (0.54,5.18)
× Income high 1.00 (ref)
Income low (<1.99) 1.11 (0.79,1.55) 1.09 (0.78,1.53) 1.00 (0.70,1.42) Income middle (2.00–3.99) 0.94 (0.67,1.30) 0.92 (0.66,1.28) 0.88 (0.62,1.24)
Income high (4.00+) 1.00 (ref) 1.00 (ref) 1.00 (ref)
Education very low (≦5) 1.77 (1.07,2.94) 1.72 (1.00,2.95) 1.76 (1.06,2.92) Education low (6–9) 1.30 (0.97,1.75) 1.30 (0.95,1.77) 1.29 (0.96,1.74) Education middle (10–12) 1.18 (0.86,1.63) 1.26 (0.89,1.77) 1.18 (0.85,1.62)
Education high (≧13) 1.00 (ref) 1.00 (ref) 1.00 (ref)
Women Model 1 Model 2 Model 3
Participation in political group activities 1.16 (0.82,1.65) 0.81 (0.11,5.92) 0.96 (0.30,3.07)
× Education very low 1.53 (0.18,12.96)
× Education low 1.22 (0.15,9.81)
× Education middle 1.41 (0.17,11.47)
× Education high 1.00 (ref)
× Income low 1.29 (0.35,4.71)
× Income middle 0.56 (0.12,2.57)
× Income high 1.00 (ref)
Income low (<1.99) 1.22 (0.94,1.60) 1.22 (0.93,1.60) 1.21 (0.92,1.59) Income middle (2.00–3.99) 1.00 (0.76,1.32) 1.00 (0.76,1.31) 1.02 (0.77,1.35)
Income high (4.00+) 1.00 (ref) 1.00 (ref) 1.00 (ref)
Education very low (≦5) 1.03 (0.68,1.56) 1.02 (0.67,1.54) 1.02 (0.67,1.54) Education low (6–9) 0.80 (0.55,1.16) 0.79 (0.54,1.15) 0.79 (0.55,1.15) Education middle (10–12) 0.75 (0.51,1.09) 0.74 (0.50,1.09) 0.74 (0.51,1.09)
Education high (≧13) 1.00 (ref) 1.00 (ref) 1.00 (ref)
Adjusted for age, marital status, employment status, the three major diseases(cancer, heart disease, and stroke), and six municipalities.
Income(million yen) denotes annual equivalized household income.
Appendix 4. Estimates (95% confidence intervals) of Cox proportional hazard models for industry or trade associations participation
Men Model 1 Model 2 Model 3
Participation in industry or trade
associations group activities 1.20 (0.92,1.56) 1.73 (0.94,3.17) 0.87(0.43,1.79)
× Education very low 1.78 (0.37,8.63)
× Education low 0.73 (0.37,1.45)
× Education middle 0.44 (0.20,0.98)
× Education high 1.00 (ref)
× Income low 1.34 (0.58,3.06)
× Income middle 1.45 (0.64,3.25)
× Income high 1.00 (ref)
Income low (<1.99) 1.14 (0.81,1.60) 1.14 (0.81,1.60) 1.06 (0.73,1.54) Income middle (2.00–3.99) 0.95 (0.68,1.32) 0.94 (0.68,1.31) 0.87 (0.60,1.26)
Income high (4.00+) 1.00 (ref) 1.00 (ref) 1.00 (ref)
Education very low (≦5) 1.82 (1.09,3.02) 1.87 (1.09,3.23) 1.80 (1.08,2.99) Education low (6–9) 1.28 (0.95,1.72) 1.38 (0.99,1.94) 1.27 (0.95,1.70) Education middle (10–12) 1.14 (0.83,1.57) 1.34 (0.93,1.92) 1.14 (0.83,1.56)
Education high (≧13) 1.00 (ref) 1.00 (ref) 1.00 (ref)
Women Model 1 Model 2 Model 3
Participation in industry or trade
associations group activities 0.99 (0.64,1.54) 2.68 (0.63,11.37) 1.38 (0.43,4.42)
× Education very low 0.89 (0.12,6.77)
× Education low 0.26 (0.05,1.27)
× Education middle 0.32 (0.06,1.68)
× Education high 1.00 (ref)
× Income low 0.58 (0.14,2.30)
× Income middle 0.41 (0.08,2.07)
× Income high 1.00 (ref)
Income low (<1.99) 1.21 (0.92,1.58) 1.21 (0.92,1.58) 1.23 (0.94,1.62) Income middle (2.00–3.99) 0.99 (0.75,1.31) 1.00 (0.75,1.32) 1.02 (0.77,1.35)
Income high (4.00+) 1.00 (ref) 1.00 (ref) 1.00 (ref)
Education very low (≦5) 0.99 (0.66,1.49) 1.02 (0.67,1.55) 0.99 (0.66,1.49) Education low (6–9) 0.78 (0.54,1.12) 0.82 (0.56,1.19) 0.78 (0.54,1.12) Education middle (10–12) 0.70 (0.48,1.03) 0.74 (0.50,1.09) 0.70 (0.48,1.03)
Education high (≧13) 1.00 (ref) 1.00 (ref) 1.00 (ref)
Adjusted for age, marital status, employment status, the three major diseases(cancer, heart disease, and stroke), and six municipalities.
Income(million yen) denotes annual equivalized household income.
Appendix 5. Estimates (95% confidence intervals) of Cox proportional hazard models for citizen/consumer groups participation
Men Model 1 Model 2 Model 3
Participation in citizen/consumer
group activities 0.93(0.57,1.51) 0.59(0.08,4.30) ―a
× Education very low 9.09(0.78,106.59)
× Education low 1.47(0.18,11.9)
× Education middle 0.97(0.10,9.57)
× Education high 1.00 (ref)
× Income low ―a
× Income middle ―a
× Income high 1.00 (ref)
Income low (<1.99) 1.10 (0.78,1.55) 1.10 (0.78,1.55) 1.05 (0.74,1.48) Income middle (2.00–3.99) 0.91 (0.65,1.27) 0.90 (0.65,1.26) 0.88 (0.63,1.23)
Income high (4.00+) 1.00 (ref) 1.00 (ref) 1.00 (ref)
Education very low (≦5) 1.80 (1.08,2.99) 1.64 (0.97,2.77) 1.81 (1.09,3.01) Education low (6–9) 1.27 (0.95,1.71) 1.26 (0.93,1.70) 1.27 (0.95,1.72) Education middle (10–12) 1.18 (0.85,1.63) 1.18 (0.85,1.64) 1.18 (0.86,1.63)
Education high (≧13) 1.00 (ref) 1.00 (ref) 1.00 (ref)
Women Model 1 Model 2 Model 3
Participation in citizen/consumer
group activities 1.08 (0.73,1.58) 3.60 (1.25,10.34) 0.45 (0.06,3.25)
× Education very low 0.78 (0.16,3.71)
× Education low 0.20 (0.06,0.68)
× Education middle 0.19 (0.05,0.76)
× Education high 1.00 (ref)
× Income low 1.00 (0.11,8.76)
× Income middle 2.06 (0.24,17.49)
× Income high 1.00 (ref)
Income low (<1.99) 1.16 (0.89,1.52) 1.18 (0.90,1.54) 1.18 (0.89,1.54) Income middle (2.00–3.99) 0.98 (0.74,1.29) 1.00 (0.75,1.32) 0.97 (0.73,1.28)
Income high (4.00+) 1.00 (ref) 1.00 (ref) 1.00 (ref)
Education very low (≦5) 1.02 (0.67,1.54) 1.01 (0.71,1.69) 1.02 (0.67,1.54) Education low (6–9) 0.79 (0.55,1.15) 0.88 (0.59,1.31) 0.79 (0.54,1.15) Education middle (10–12) 0.72 (0.49,1.06) 0.80 (0.53,1.20) 0.71 (0.48,1.04)
Education high (≧13) 1.00 (ref) 1.00 (ref) 1.00 (ref)
Adjusted for age, marital status, employment status, the three major diseases(cancer, heart disease, and stroke), and six municipalities.
Income(million yen) denotes annual equivalized household income.
a. Values could not be estimated because there were too few cases.
Appendix 6. Estimates (95% confidence intervals) of Cox proportional hazard models for religious organization participation
Men Model 1 Model 2 Model 3
Participation in group activities 1.15 (0.90,1.45) 1.67 (0.89,3.13) 0.5 4(0.19,1.52)
× Education very low 0.45 (0.11,1.78)
× Education low 0.64 (0.32,1.30)
× Education middle 0.53 (0.23,1.20)
× Education high 1.00 (ref)
× Income low 1.88 (0.62,5.70)
× Income middle 2.45 (0.82,7.31)
× Income high 1.00 (ref)
Income low (<1.99) 1.11 (0.79,1.56) 1.11 (0.79,1.56) 1.02 (0.71,1.46) Income middle (2.00–3.99) 0.93 (0.66,1.29) 0.93 (0.67,1.30) 0.82 (0.57,1.16)
Income high (4.00+) 1.00 (ref) 1.00 (ref) 1.00 (ref)
Education very low (≦5) 1.73 (1.04,2.88) 1.99 (1.14,3.47) 1.75 (1.05,2.92) Education low (6–9) 1.31 (0.97,1.76) 1.43 (1.02,2.01) 1.31 (0.97,1.76) Education middle (10–12) 1.21 (0.88,1.67) 1.36 (0.95,1.95) 1.21 (0.88,1.67)
Education high (≧13) 1.00 (ref) 1.00 (ref) 1.00 (ref)
Women Model 1 Model 2 Model 3
Participation in group activities 1.03 (0.83,1.28) 1.55 (0.60,4.04) 0.78 (0.36,1.70)
× Education very low 0.47 (0.15,1.47)
× Education low 0.67 (0.24,1.82)
× Education middle 0.72 (0.25,2.04)
× Education high 1.00 (ref)
× Income low 1.18 (0.49,2.82)
× Income middle 1.40 (0.57,3.43)
× Income high 1.00 (ref)
Income low (<1.99) 1.22 (0.93,1.59) 1.22 (0.93,1.60) 1.20 (0.90,1.59) Income middle (2.00–3.99) 0.98 (0.74,1.29) 0.97 (0.74,1.29) 0.94 (0.70,1.26)
Income high (4.00+) 1.00 (ref) 1.00 (ref) 1.00 (ref)
Education very low (≦5) 0.99 (0.66,1.49) 1.09 (0.70,1.69) 1.00 (0.66,1.50) Education low (6–9) 0.77 (0.53,1.11) 0.81 (0.54,1.20) 0.77 (0.53,1.11) Education middle (10–12) 0.73 (0.50,1.06) 0.76 (0.50,1.14) 0.73 (0.50,1.06)
Education high (≧13) 1.00 (ref) 1.00 (ref) 1.00 (ref)
Adjusted for age, marital status, employment status, the three major diseases(cancer, heart disease, and stroke), and six municipalities.
Income(million yen) denotes annual equivalized household income.
Appendix 7. Estimates (95% confidence intervals) of Cox proportional hazard models for local community participation
Men Model 1 Model 2 Model 3
Participation in local community
activities 0.80 (0.70,0.99) 0.96 (0.56,1.65) 0.66 (0.37,1.17)
× Education very low 1.47 (0.56,3.81)
× Education low 0.82 (0.46,1.46)
× Education middle 0.78 (0.41,1.49)
× Education high 1.00 (ref)
× Income low 1.19 (0.63,2.26)
× Income middle 1.32 (0.70,2.51)
× Income high 1.00 (ref)
Income low (<1.99) 1.03 (0.74,1.43) 1.02 (0.74,1.42) 0.93 (0.58,1.49) Income middle (2.00–3.99) 0.88 (0.64,1.21) 0.87 (0.63,1.21) 0.75 (0.47,1.2)
Income high (4.00+) 1.00 (ref) 1.00 (ref) 1.00 (ref)
Education very low (≦5) 1.84 (1.12,3.02) 1.57 (0.77,3.20) 1.83 (1.12,3.00) Education low (6–9) 1.33 (1.00,1.79) 1.49 (0.96,2.33) 1.34 (1.00,1.79) Education middle (10–12) 1.18 (0.86,1.62) 1.35 (0.83,2.19) 1.18 (0.86,1.63)
Education high (≧13) 1.00 (ref) 1.00 (ref) 1.00 (ref)
Women Model 1 Model 2 Model 3
Participation in local community
activities 0.78 (0.67,0.90) 0.86 (0.43,1.74) 0.84 (0.51,1.37)
× Education very low 0.98 (0.44,2.18)
× Education low 0.87 (0.42,1.80)
× Education middle 0.96 (0.45,2.04)
× Education high 1.00 (ref)
× Income low 0.86 (0.49,1.48)
× Income middle 0.89 (0.50,1.57)
× Income high 1.00 (ref)
Income low (<1.99) 1.27 (0.97,1.67) 1.28 (0.98,1.68) 1.39 (0.90,2.14) Income middle (2.00–3.99) 1.04 (0.79,1.38) 1.05 (0.79,1.38) 1.12 (0.71,1.77)
Income high (4.00+) 1.00 (ref) 1.00 (ref) 1.00 (ref)
Education very low (≦5) 1.00 (0.66,1.50) 1.00 (0.59,1.71) 1.00 (0.67,1.51) Education low (6–9) 0.81 (0.56,1.17) 0.87 (0.53,1.42) 0.82 (0.56,1.18) Education middle (10–12) 0.77 (0.53,1.13) 0.78 (0.46,1.30 ) 0.77 (0.53,1.13)
Education high (≧13) 1.00 (ref) 1.00 (ref) 1.00 (ref)
Adjusted for age, marital status, employment status, the three major diseases(cancer, heart disease, and stroke), and six municipalities.
Income(million yen) denotes annual equivalized household income.
Supplementary Table 1. Proportion of participation (%) by educational attainment
Men Women
Very low Low Middle High Very low Low Middle High Political group/organization 8.9 10.6 12.2 12.1 45.0 4.1 5.2 6.2 Industry or trade association 6.2 14.6 18.7 20.5 1.2 4.8 5.1 4.9
Volunteer group 4.5 8.6 14.0 15.5 2.4 7.8 12.7 22.6
Citizen/consumer group 4.5 4.5 3.8 3.4 1.5 5.2 5.9 5.7
Religious organization 14.7 11.9 12.8 14.2 13.2 11.6 11.5 12.1
Sports group or club 11.6 18.2 26.8 29.1 6.8 18.6 23.6 30.1
Local community 47.5 57.9 58.1 56.1 44.1 58.3 62.2 52.6
Hobby group 11.3 22.5 31.7 38.3 11.6 30.1 44.9 58.1
Have facilitator role 26.2 40.9 53.3 52.5 18.3 28.8 33.3 43.7
Supplementary Table 2. Proportion of participation (%) by income level
Men Women
Low Middle High Low Middle High Political group/organization 10.3 11.4 16.9 4.7 4.9 6.4 Industry or trade association 12.5 15.9 34.3 4.0 5.4 7.4
Volunteer group 8.3 12.3 16.5 9.8 12.3 10.9
Citizen/consumer group 3.8 4.5 3.4 5.5 5.7 4.7
Religious organization 12.4 12.6 13.6 13.0 10.3 11.3 Sports group or club 17.4 25.1 31.6 18.2 25.5 19.5
Local community 55.2 60.2 58.3 54.7 62.0 62.3
Hobby group 21.8 31.5 34.1 31.9 42.0 39.0
Have facilitator role 42.3 49.5 52.3 31.4 33.7 30.4
Supplementary Table 3. Estimates (95% confidence intervals) of Cox proportional hazard models on sports group/club participation
Men
Model 1 Model 2 Model 3
Income(ordinal scale) 0.90 (0.77,1.06) 0.90 (0.77,1.06) 0.96 (0.81,1.14) Education(ordinal scale) 0.88 (0.77,1.00) 0.94 (0.82,1.08) 0.88 (0.77,1.00) Group Participation 0.60 (0.45,0.81) 2.82 (0.95,8.4) 1.38 (0.61,3.12)
× Education 0.53 (0.34,0.83)
× Income 0.62 (0.39,0.98)
Women
Model 1 Model 2 Model 3
Income(ordinal scale) 0.90 (0.79,1.03) 0.90 (0.79,1.03) 0.92 (0.81,1.06) Education(ordinal scale) 0.88 (0.77,1.01) 0.88 (0.76,1.01) 0.88 (0.77,1.01) Group Participation 0.48 (0.34,0.68) 0.37 (0.11,1.28) 0.81 (0.33,1.96)
× Education 1.11 (0.68,1.82)
× Income 0.73 (0.43,1.22)
Adjusted for age, marital status, employment status, the three major diseases (cancer, heart disease, and stroke), and municipality.
The order of income categories were as follows: less than 200 million Yen, 200–399 million Yen, 400 or more million Yen. Educational attainment was categorized as less than 6 years, 6–9 years, 10–12 years, and 13 or more years, respectively.