11
Ar
t
i
cl
e
NUE JournalofInternationalEducationalCooperation,Volume7,11-20,20131.Research background and purpose as an introduction The Republic of Fiji is located in the South Pasic Ocean and comprises an archipelago of more than 332 islands.Itspopulation isapproximately 849,000,51% of which is Fijian native and 44% of which is Indian descendant. Thus, the national language consists of English,Fijian and Hindi(Fijian Hindi).Fijian system of schooleducation consists(compulsory schooling) ofthe 6-yearprimary education(Classes1 to 6) and the6-year secondary education(Form 1 to 6).In actuality,sincethe previous system of Class 1-8(primary education) and Forms3-7(secondary education) wastraditionally accepted by the nation, many schools still follow it. The Net Enrollment Ratio(NER) of the primary education was 97% and thatofthesecondary education was84%(MoE, 2011;2012a).
Since in 2009 and 2010 the Fijian Government abolished severalexternalexaminationsattheprimary and secondary levels,thedropoutratehasdrastically decreased. According to the MoE(2012c), the dropout rate of secondary levelshrank from 5.0%(2008) to 0.3%(2010) meanwhilethatofprimary education changed from 1.3% (2008) to 0.2%(2010).However,65% ofstudentshave
passed the Fiji School Leaving Certificate Examination (FSLCE),which isconducted attheend oftheForm 6,so
that almost 35% of the Form 6 students can’t graduate from the secondary school and should repeat the grade, drop outoftheschool(MoE,1 2012a).Among theexamined subjects,Mathematicsshowsthelowestscoreand passing rateand isdefined by theMoE asoneofthecoreissuesof quality education.
Thepurposeofthisstudy isdefined by theauthoras researching and analyzing thesecondary schoolstudents’
A
St
udy
on
Fi
j
i
an
Secondar
y
School
St
udent
s'
Anxi
et
y
t
owar
d
Mat
hemat
i
cs
and
t
hei
r
Academi
c
Achi
evement
—
Consi
der
i
ng
School
Avoi
dance
and
Teacher
s'
awar
eness
—
ISHIZAKA Hiroki
Naruto University ofEducation
Abstract:thepurposeofthisstudy isto research and analyzethesecondary schoolstudents’ attitudetoward Mathematicsand theirweak pointsofmathematicalknowledge,in consideration with schoolavoidanceand teachers’ levelofperceiving thestudents’ issues.In thestudy,itisconfirmed that1) theclass-related anxiety in Mathematics could haveanegativecorrelation with theattendancerate,mutually being liked with thetendency ofschoolavoidance,2) theanxiety forproblem solving,teachersand surrounding peoplegrowsasmuch asthestudentsgetpromoted and 3) thelevelof understanding geometry remained very low.Itisconcluded thattheschoolavoidance should bedealtwith notonly from thesocioeconomicsector,butalso from theschool and teachers,especially teaching contentsand method.
Keywords:Mathematicsanxiety,schoolavoidance,Fiji
国際教育協力研究 第7号 12
attitude toward Mathematics and their weak points of mathematical knowledge, in consideration with school avoidance2and teachers’ levelofperceiving thestudents’ issues.Thisstudy isexpected to offerhelpfulinformation to elaborateand implementabettereducationalpolicy with respect to the drop-out issues and quality education in Mathematics.Thestudy’sdetailisdescribed below. 2. Theoretical framework for applying psychometric
scaling
The first scholars who mentioned the Mathematics anxiety weresaid to beDregerand Aiken(1957).According to them,theMathematicsanxiety isdefined asa“syndrome of emotional reaction to Arithmetic and Mathematics”. After several researchers developed questionnaires and small rating scales relevant to the Mathematics anxiety, finally Richardson and Suinn(1972) elaborated a commonly used scale, so-called “Mathematics Anxiety Rating Scale(MARS)”. Firstly, this scale is developed with 98 question itemsto estimatetheMathematicsanxiety in daily lifeand studying scene.40 itemswereselected by Brush(1976) due to a validity analysis and nowadays commonly used in the psychological study. Cronbach’s α3oftheMARS is0.93,which valueisquitehigh. In Japan,Fujii(1994) firstly employed theMARS and adjusted itto thecountry’scontext,sincetherewasno psychometricscaleto evaluatetheMathematicsanxiety in the country. As a result of applying the translated and culture-fitted MARS(theprincipalcomponentanalysis& varimax rotation),Fujii(1994) concluded thattheMARS is sufficiently reliable(Spearman-Brown’s reliability coefficientofthesplit-halfmethod was0.89) and defined two factors:“MathematicsLearning Anxiety Factor” and “MathematicsAssessmentAnxiety Factor”.According to Fujii(1994)’s regression analysis using the MARS’s scores(N=146), it was inferred that, as much as the students perceived the difficulty of Mathematics and disliked Mathematics,theMathematicsanxiety heightened. On the other hands, Watabe and Sakuma(1998), recognizing theeffectivenessofFujii(1994)’sMARS and the importance of alleviation of Mathematics anxiety to improve students’ academic achievement, developed an originalMathematicsanxiety scale(theauthorofthisstudy
callsit“MathematicsAnxiety Scal(MAS)”) e fordetecting methodsofteachers’ support.According to Watabeand Sakuma(1998),many scholarsaffirm thattheteachers’ supportto thestudentscan generatepositiverepercussions overthestudents’ emotion and even academicachievement (Fujii,1994; Reed,1961; Kawano,1988).Based on this
understanding, Watabe and Sakuma prepared 18 scale items and conducted a factor analysis(the principal componentanalysis& varimax rotation),applying them to primary schools’ students(N=312).
Asaresult,4 factors,which showed morethan 1 asan eigenvaluewereextracted(asthewholescale:α=0.80). Namely, they were the “Class Related Anxiety Factor (CRAF)(α=0.81)”,“Problem Solving FailureAnxiety
Factor(PSFAF)(α=0.67)”,the“Concern-for-Teacher Anxiety Factor(CTAF)(α=0.43)” and the“Concer n-for-SurroundingsAnxiety Factor(CSAF)(α=0.34)”.The CRAF meanstheanxiety thestudentsfeelwhen they are learning in a lesson or certain situation relevant to the lesson.ThePSFAF explainsthepreoccupation they feel when solving aproblem in atest,homework orlesson.The CTAF and CSAF arewhatthey worry when teachersand friendslook attheirlearning orsolving aproblem.
According to Yoshidaand Yamashita(1987),thereis aperception gap on learning motivation between students and teachers, and if it is the case, the teachers may misunderstand that certain stimulant pedagogical actions doesn’t influence the students’ learning motivation, or viceversa,disturbing factorsdoesn’taffectit.Therefore,it isalso indispensableto understand theteachers’ perception on thestudents’ learning motivation,including itspositive and negative factors such as support and disturbance (anxiety) toward learning.
With respectto theschoolavoidance,many scholars developed their own psychometric scale to estimate it. Particularly in the Japanese society of the educational psychology,thisissue,along with seriousphenomenasuch as mental illness, extreme reclusiveness(the so-called “Hikikomori” in Japanese) and cruelviolence,hasbeen dealtwith asoneofthemostcrucialcontroversiesin the education sector.Atfirsttime,theterm “SchoolAvoidance Feeling” emerged when Morita(1991) published hisstudy
2Schoolavoidancemeansthefactthatthestudentsfailto go to school,aswellasabsenteeism and truancy.
13 on studentswho used to truantorarein asimilarsituation.
Morit(1a 991) defined thatthe“SchoolAvoidanceFeeling” wasthestudents’ sentimentoffeeling likenotgoing to school, regardless of how many days a student actually failsto go to school.
The“SchoolAvoidanceFeeling Scale(SAFS)” has been developing in Japan in an original way that the poverty isnotnecessarily considered asthecorecauseof the school avoidance. Rather, 1) the students’ mental condition such asself-esteem,self-disgustand depression, 2) therelationship(socialsupport) between thestudents and stakeholders such as friends, teachers, family and community and 3) theimpression orthoughtaboutschool and lesson havebeen taken into accountasmain objectsof study(Watanabe and Koishi, 2000; Satoh and Saito, 2001; Tomishigeand Ogura,2001; Kaneko etal.,2003; Nakashimaand Hara,2009; Suzukietal.,2011).Apart from the discussion on the validity of this rationale, at least,itisassumed thatthe“SchoolAvoidanceFeeling Scale” in Japan could enrich itsvariety forsearching the students’ mentalcondition,human relationshipsand school and lesson matters.
One of the most frequently used SAFS among psychologistsin Japan isthemodelofWatanabeand Koishi (2000). Firstly, they elaborated the SAFS, citing and
modifying 34 scale items which estimate the perception toward schoollife(Kuzeetal.,1985) and truanttendency (Haraoka,1972).Using the34 scaleitems,afactoranalysis was conducted(N=354, the principal factor analysis & varimax rotation). Ultimately, 28 items remained after removing items,whosefactorloading was0.40 orlessthan 0.40 for1 factor,or,wasmorethan 0.40 formorethan 1 factor.Outofthese28 items,26 items(asthewholescale:
α=0.89) werecategorized into threefactors:the“School Rebellion Tendency Facto(SRTF)r (α=0.87)”,“Friendship Isolation Tendency Factor(FITF)(α=0.84)”,“Attendance DisgustTendency Factor(ADTF)(α=0.81)”.
3.Research methods and objects
Basically, quantitative methods are applied in this study in orderto research whetherthereisany relationship and tendency among theMathematicsanxiety,theschool avoidance, the mathematical knowledge and teachers’ perception on the students’ issues. Questionnaire survey based on theLikertscale(fiveordered responselevelsin thisstudy) and asmallMathematicstestwereconducted in asecondary school,agirlscollege(thestudents’ N=331, the teachers’ N=23), in the capital city of Fiji, Suva, between July 23rdand 27th,2012.Aswellasthisresearch, the attendance record(the first term of 2012) of the corresponding studentswascollected.Thiscollegestarted asasecondary schoolforIndian girls,buttoday,around 70% of students are Fijian and the rest are Indian. The averageacademicachievementoftheschooliscategorized asoneofthelowestin thecountry.
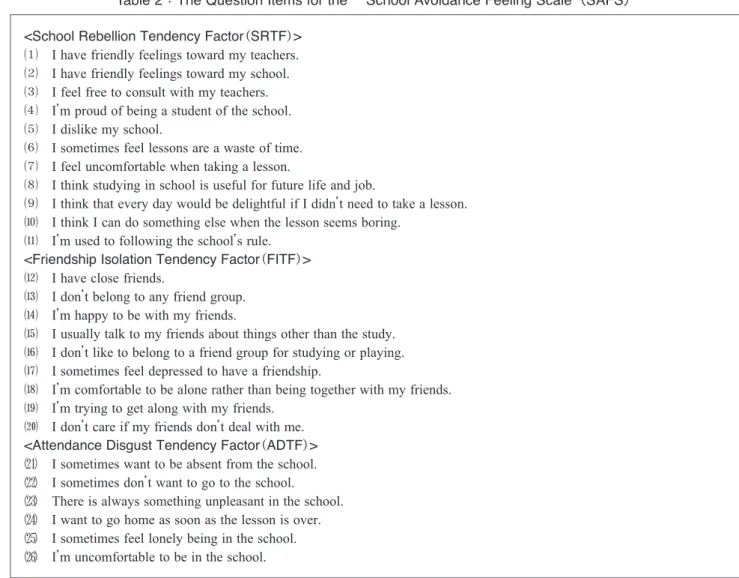
Forthequestionnaire,the“MathematicsAnxiety Scale (MAS)”(Watabeand Sakuma,1998) and the“School
AvoidanceFeeling Scale(SAFS)”(Watanabeand Koishi, 2000) wereemployed,translating allthescaleitemsfrom Japaneseto English,consulting with 3 Fijian teachersof thegirlscollegeand modifying them to contextualizethe questionnaireand ensurethesescale’sstructuralvalidity. In contextualizing thequestionnaire,itwasconcluded that thesamenumberand basiccontentsofthescaleitemswere going to beutilized fortheresearch(referto theTable1 and Table2)
<Class Related Anxiety Factor(CRAF)>
⑴ When you haveto startstudying anew unit(topic) ⑵ When you areasked to do homework
⑶ Suddenly you areasked to takeatest
⑷ When you haveto solveastory problem during thelesson ⑸ When theduration ofthetestisdefined
⑹ When therearetoo many calculation questions
⑺ When you aretold by theteacherto review themathematicslesson
⑻ When you aretold by theteacherto writean answeron theblackboard in frontofyourfriends
⑼ When you couldn’ tunderstand thequestion theteacherraised and theteachercameto check youranswer
国際教育協力研究 第7号 14
The test questions(refer to the Annex 1) were comprised of1) decimalsand fraction(9 questions),2) angle(3 questions),3) surfacearea(1 question) and 4) story problem(3 questions).Thetest’scontentswere programed to bewhatallthesamplestudentsshould have learned,therefore,whatwasbased on theFijian curriculum and textbooksoftheForm 3.Thescoring system isthat1 correctanswerwascounted as1,so thatthetotalscorewas 16.Based on thetotalscoreand students’ earned score,the
accuracy ratewascalculated forthewholetestand each mathematical field. The test duration to answer all questionswas1 hour.
4.Findings and analysis
1)The “Mathematics Anxiety Scale(MAS)”
Asthewholescale,Cronbach’sα oftheMAS applied in this study was 0.82, meanwhile that of the “Class
<Problem Solving Failure Anxiety Factor(PSFAF)>
⑽ When you don’ tunderstand thesecond halfofaquestion even though you understand itsfirsthalf. ⑾ When you can’ tfillup thewholeblanksofthetest
⑿ When you noticed yourerrorsaftersubmitting thetest
⒀ When thetestasksyou to solveaquestion thatyou couldn’ thavesolved before ⒁ When you don’ tunderstand thehomework’ squestions
<Concern-for-TeacherAnxiety Factor(CTAF)> ⒂ When you didn’ tdo homework
⒃ When yourfriend said to you “you couldn’ tsolveit?” afteryou couldn’ tsolvethequestion < Concern-for-Surroundings Anxiety Factor(CSAF)>
⒄ When you arelikely to havebad markson thetestwhen itisreturned to you ⒅ When yourteachersteach ortalk morequickly according to theirconvenience
<SchoolRebellion Tendency Factor(SRTF)> ⑴ Ihavefriendly feelingstoward my teachers. ⑵ Ihavefriendly feelingstoward my school. ⑶ Ifeelfreeto consultwith my teachers. ⑷ I’ m proud ofbeing astudentoftheschool. ⑸ Idislikemy school.
⑹ Isometimesfeellessonsareawasteoftime. ⑺ Ifeeluncomfortablewhen taking alesson.
⑻ Ithink studying in schoolisusefulforfuturelifeand job.
⑼ Ithink thatevery day would bedelightfulifIdidn’ tneed to takealesson. ⑽ Ithink Ican do something elsewhen thelesson seemsboring.
⑾ I’ m used to following theschool’ srule. <Friendship Isolation Tendency Factor(FITF)> ⑿ Ihaveclosefriends.
⒀ Idon’ tbelong to any friend group. ⒁ I’ m happy to bewith my friends.
⒂ Iusually talk to my friendsaboutthingsotherthan thestudy. ⒃ Idon’ tliketo belong to afriend group forstudying orplaying. ⒄ Isometimesfeeldepressed to haveafriendship.
⒅ I’ m comfortableto bealoneratherthan being togetherwith my friends. ⒆ I’ m trying to getalong with my friends.
⒇ Idon’ tcareifmy friendsdon’ tdealwith me. <Attendance DisgustTendency Factor(ADTF)> 肝 Isometimeswantto beabsentfrom theschool. 艦 Isometimesdon’ twantto go to theschool. 莞 Thereisalwayssomething unpleasantin theschool. 観 Iwantto go homeassoon asthelesson isover. 諌 Isometimesfeellonely being in theschool. 貫 I’ m uncomfortableto bein theschool.
15 Related Anxiety Factor(CRAF)”,the“Problem Solving
FailureAnxiety Facto(PSFAF)”,r the“Concern-for-Teacher Anxiety Facto(CTAF)r ” and the“Concern-for-Surroundings Anxiety Factor(CSAF)” were0.72,0.75,0.55 and 0.65 respectively.
The Kruskal-Wallis Test, which is one of the nonparametricstatisticalmethod,wasadopted in thisstudy to figureoutwhetherthereisany differenceoftheMAS
factors’ totalscoreamong thestudentsoftheForm 3,4, 5 and 6. The hypothesis analysis showed a significant differenceamong theformsin thePSFAF,CTAF and CSAF (referto theTable3).According to theresultsofmultiple comparison,itisconfirmed thattheaveragetotalscoreof PSFAF,CTAF and CSAF tendsto increasegradually from theForm 3 to 6.Itcan beinferred thatasfarasthestudents getpromoted and grow,they feelmoreshameifthey failor theirteacherorfriendsseetheirfailureorweak points. Table 3:MAS Results Comparison among Forms(3-6)
Decision Sig. Test NullHypothesis Retain thenull hypothesis. .254 Independent-Samples Kruskal-WallisTest The distribution of Class Related Anxiety is the same across
categoriesofForm. 1 Rejectthenull hypothesis. .005 Independent-Samples Kruskal-WallisTest The distribution of Problem Solving Failure Anxiety is the same
acrosscategoriesofForm. 2 Rejectthenull hypothesis. .013 Independent-Samples Kruskal-WallisTest Thedistribution ofConcern-for-TeachersAnxiety isthesameacross
categoriesofForm. 3 Rejectthenull hypothesis. .001 Independent-Samples Kruskal-WallisTest The distribution of Concern-for-Surroundings Anxiety is the same
acrosscategoriesofForm. 4
Asymptoticsignificancesaredisplayed.Thesignificancelevelis.05.
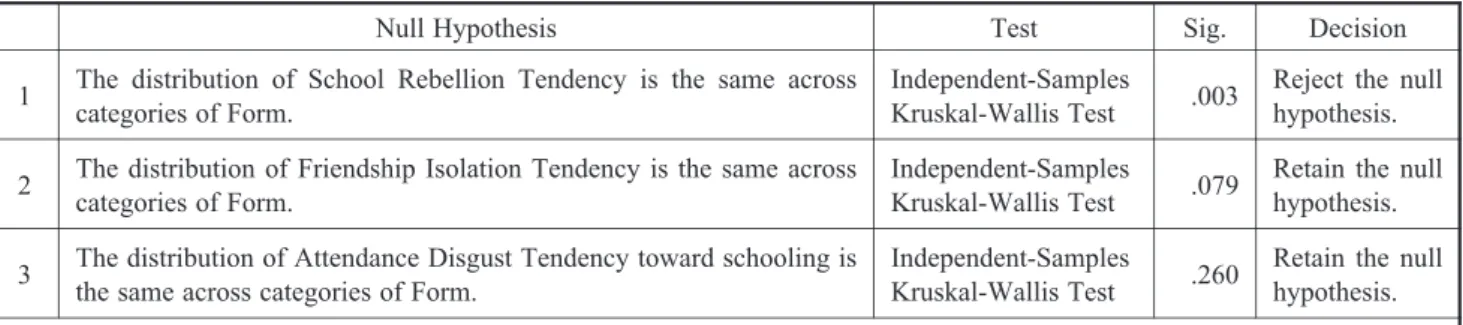
2)The “SchoolAvoidance Feeling Scale(SAFS)” Asthewholescale,theα oftheSAFS applied in this study was0.74,meanwhilethatofthe“SchoolRebellion
Tendency Facto(SRTF)r ”,the“Friendship Isolation Tendency Factor(FITF)” and the“AttendanceDisgustTendency Factor(ADTF)” were0.64,0.44 and 0.70 respectively. Table 4:SAFS Results Comparison among Forms(3-6)
Decision Sig. Test NullHypothesis Rejectthenull hypothesis. .003 Independent-Samples Kruskal-WallisTest Thedistribution ofSchoolRebellion Tendency isthesameacross
categoriesofForm. 1 Retain thenull hypothesis. .079 Independent-Samples Kruskal-WallisTest Thedistribution ofFriendship Isolation Tendency isthesameacross
categoriesofForm. 2 Retain thenull hypothesis. .260 Independent-Samples Kruskal-WallisTest Thedistribution ofAttendanceDisgustTendency toward schooling is
thesameacrosscategoriesofForm. 3
Asymptoticsignificancesaredisplayed.Thesignificancelevelis.05.
As well as the MAS case, the Kruskal-Wallis Test showed asignificantdifferenceamong theforms,butonly in theSRTF(referto theTable4).According to theresults of multiple comparison, it is also confirmed that the averagetotalscoreoftheSRTF rosegradually from the Form 3 to 6.Itisconsidered thatasfarasthestudents grow adolescent, they feel more uncomfortable if they think oftheirschoolorteacher.
3)Combination ofthe two scale’s findings
TheresultsofthePearson’sCorrelation Analysison the MAS and SAFS factorsasfollows(referto theTable5):
a) Mutually,thePSFAF,CSAF and CTAF werestrongly correlated.
b) A correlation wasconfirmed between theCRAF,and, thePSFAF,CTAF and SRTF respectively.
c) TheCRAF wasmoderately correlated with theCSAF and ADTF.
d) The SRTF was correlated with the ADTF and moderately correlated with theFITF.
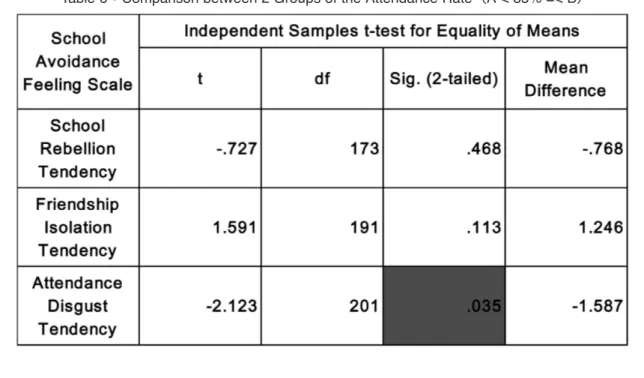
With respect to the SAFS, the results of the independent samples t-test for equality of the average scoresshowed thatthedifferenceoftheADTF mean score
国際教育協力研究 第7号 16
wasstatistically significantbetween astudentgroup ofless than 85%(A) asan attendancerate4
and anothergroup of 85% or more than 85%(B). It is understandable that
among thethreefactorsoftheSAFS,theADTF isthemost relevantto theattendancerate(referto theTable6).
Table 5:Summary ofCorrelation among the MAS & SAFS Factors
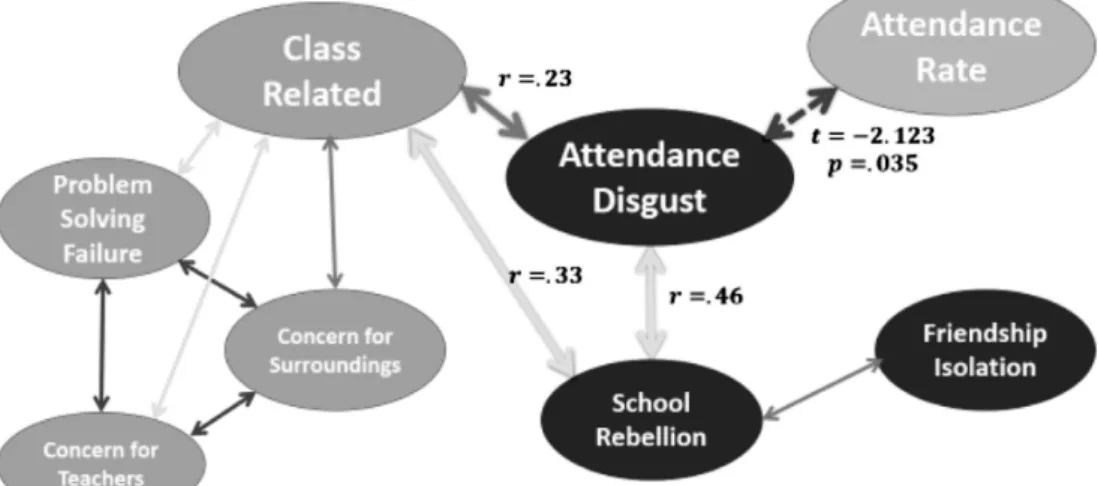
Regarding the results and analysis in the previous sessions,asimplified path diagram wasmadeby theauthor (referto theDiagram 1).According to thediagram,the CRAF seemsto haveaprincipalroleto connectbetween theMAS factorsand theSAFS factors,sincetheCRAF is correlated notonly with theotherMAS factors,butalso
with thetwo SAFS factors,thatisto say,theADTF and SRTF. On the other hands, the ADTF seems to play a liaison role, in the diagram, between the MAS, in particular, the CRAF and the attendance rate, and the SRTF helpstheADTF connecting between theCRAF and ADTF.
Table 6:Comparison between 2 Groups ofthe Attendance Rate(A < 85% =< B)
17 4)Comparison between the data ofstudents and that
ofteachers
Aswellasthestudents’ dataanalysis,theteachers’ one was also calculated and analyzed. As the Table 7 shows,asignificantdifferencebetween thestudentsand teacherswascorroborated in theCRAF and PSFAF ofthe
MAS, and the FITF and ADTF of the SAFS. The differenceverified in theCRAF,PSFAF and SAFS was negative(t-value),which meanstheteachers’ concern over thestudentswashigherthan thestudents’ actualanxiety.Only in thecaseoftheFITF,theteachers’ concern appeared much lowerthan thestudents’ anxiety.
Table 7:Comparison ofthe MAS & SAFS Results between the Students and Teachers
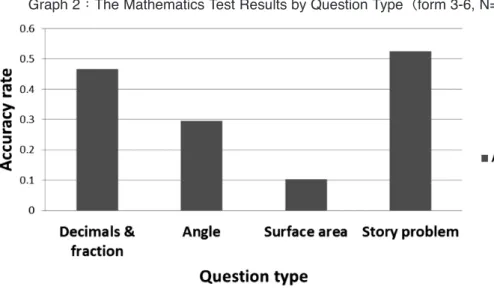
5)The mathematics test
The test results indicated in general that the level of understanding the Form 3 contents was very low(the accuracy ratewas42.7%).Regarding itsmathematicalfield, each field’saccuracy ratewerethe“Decimalsand fraction” 0.47,“Angle” 0.30,“Surfacearea” 0.10 and “Story problem” 0.53,respectively(referto theGraph 2).
AstheTable8 shows,thedifferenceofthetestmean scoresamong theformswasstatistically significantin the fields “Decimals and fraction” and “Story problem”. However,thedifferencewasnotverified in the“Angle” and “Surface area”. From the results mentioned above, it is
derived thatthereconfirmed no advanceoflearning from thelowergradeto thehighergradein thegeometry,even though an improvementseemed to existin thealgebraand problem solving skill(referto theTable8).
国際教育協力研究 第7号 18
5.Significance ofthe study and generalconclusions According to the study results, with respect to the Mathematics Anxiety Scale(MAS), above all, the “Problem Solving FailureAnxiety Factor(PSFAF)”,the “Concern-for-Teacher Anxiety Factor(CTAF)” and the “Concern-for-SurroundingsAnxiety Factor(CSAF)” should
becoped with attheearly leveloftheschooleducation (including the primary education), since these factors affectthefeeling toward Mathematicsmuch largerin the highergradethan in thelowerone.Besides,the“Class Related Anxiety Factor(CRAF)” should be much considered atthewholesecondary schoollevel,especially, how to teach Mathematics and support the students in lesson isakey issue.
SincetheCRAF connectsbetween theMAS factors and theSchoolAvoidanceFeeling Scale(SAFS) factors, which could be linked with the school attendance, the improvementon theCRAF,in certain manners,indirectly
might be positively correlated with the attendance5. The attendance(absenteeism) issueshould bedealtwith not only from the socioeconomic sector, but also from the school and teachers, especially teaching contents and method. On the other hands, the “School Rebellion Tendency Factor(SRTF)” oftheSAFS also should be taken care of at the early level of the school education (including the primary education). This is because, according to the research results, as far as the students grew adolescent,they could feelmoreuncomfortableabout theirschoolorteacher.
Although in general the teacher’s concerns for the students’ Mathematics anxiety and school avoidance is higherthan thoseofthestudents,only theFITF showed the opposite results. Thus, the teachers need to consciously takecareofthestudents’ relationship insideand outsideof school.Needlessto say,thegovernmentalauthority should takeitinto accountin supporting theschools.
Table 8:The Mathematics TestResults Comparison among Forms(3-6)
Decision Sig. Test NullHypothesis Rejectthenull hypothesis. .000 Independent-Samples Kruskal-WallisTest The distribution of Decimals and Fraction is the same across categoriesofForm. 1 Retain thenull hypothesis. .296 Independent-Samples Kruskal-WallisTest Thedistribution ofAngleisthesameacrosscategoriesofForm.
2 Retain thenull hypothesis. .124 Independent-Samples Kruskal-WallisTest The distribution of Surface Area is the same across categories of
Form. 3 Rejectthenull hypothesis. .000 Independent-Samples Kruskal-WallisTest Thedistribution ofStory Problem isthesameacrosscategoriesof
Form. 4
Asymptoticsignificancesaredisplayed.Thesignificancelevelis.05.
5Definitely itcannotbedenied thattheattendance(absenteeism) affectstheMAS factors.Whatwasverified in thestudy wasamutualinfluential
relationship,which wasindirect,between them.Both ofthem asawholeshould beconsidered in theschooleducation. Graph 2:The Mathematics TestResults by Question Type(form 3-6,N=252)
19 Theanalysisoftestscoresshowsthatthegeometry
wasatthemostcriticalleveland,worsethan that,there seemed to beno improvementofgeometry’sscoreduring the corresponding 4 years of the secondary level. With respectto thestory problem,in fact,thereisnotan ideal improvementamong theforms,sincemostofthestudents could solve only the first question, which is a simplest question related to the other 2 higher-order-thinking questions. Therefore, it is still necessary to enhance the problem-solving capacity. In this study, there didn’t verified any significantcorrelation between theMAS and SAFS,and thetestscore.However,oneofthosereasons could bethefactthatthevery low accuracy rateofthetest affected apossiblerelationship between them.Thus,there isstillroom to examinethat,conducting atestwith awide rangeofquestionsand contents.
In addition, according to the author’s study, there confirmed,in Fiji,no research on theMathematicsanxiety, the students’ feeling of avoiding school, and the relationship between them and school attendance rate. Moreover,thereisno opened dataabouttheMathematics testscore,in which theweak pointsin themathematical fieldsand theanswering tendency aredetectible.Therefore, thisstudy isexpected to beableto open,in Fiji,aresearch spaceon theissuesofquality education,such asmental care of students, social supports and teaching capacity developmentforschooling and Mathematicseducation. Since this study focused only on a girl secondary schoolin thecapitalcity ofFijidueto theavailability of accessatthattime,itisindispensable,needlessto say,to widen the range of research and deepen the analysis, considering thesocioeconomicand culturalFijian context, for the sake of proposing any educational policy with respect to the nationwide issues. It is expected to be considered in futureresearchesofmine.
Reference
Brush,I.1976.MathematicsAnxiety in CollegeStudents. Unpublished paper.Wesleyan University.
Dreger,R.M.& Aiken,L.R.1957.TheIdentification of Number Anxiety in College Population. Journal of EducationalPsychology.48,344-351.
Fujii,Yoshihisa.1994.A Study on MathematicsAnxiety Rating Scale(MARS).JapaneseJournalofEducational Psychology.42,448-454.
Haraoka, Kazuma. 1972. A Factor Analysis on Truant Tendency. Journal of the Faculty of Education, Saga University.20,67-90.
Kaneko,Hitoshi.,Honjo,Shuji.& Takamura,Sakiko.2003. The Relationship Between Self-reference and Social Phobic,Depression,and SchoolAbsenteeism Tendencies.
TheJapaneseJournalofPersonality.Vol.12-1,2-13. Kawano, Yoshiaki. 1988. Effects of Affiliative Cues of
Teachers on Children’s Task Performance. Japanese JournalofEducationalPsychology.36,161-165. Kuze,Toshio.,Ninomiya,Katsumi.and Ohno,Hisashi.1985.
A Study on Juniorand SeniorHigh SchoolStudents’ Adaptation to School Life. Japanese Association of EducationalPsychology27thGeneralAssemblyCollection ofPapers.404-405.
Ministry ofEducation(MoE).2011.AnnualReport2010.
Suva:Ministry ofEducation,NationalHeritage,Culture and Arts,Youth and Sports.
Ministry ofEducation(MoE).2012a.AnnualReport2011.
Suva:Ministry ofEducation,NationalHeritage,Culture and Arts,Youth and Sports.
Ministry ofEducation(MoE).2012b.FinancialStatements fortheYearEnded 31 December2011.Suva:Ministry of Education, National Heritage, Culture and Arts, Youth and Sports.
Ministry ofEducation(MoE).2012c.2012-2014 Education SectorStrategicDevelopmentPlan.Suva:Ministry of Education,NationalHeritage,Cultureand Arts,Youth and Sports.
Ministry ofEducation(MoE).2012d.2013 AnnualBusiness Plan.Suva,Fij:Mii nistry ofEducation,NationalHeritage, Cultureand Arts,Youth and Sports.
Morita,Yoji.1991.Sociology of“Truancy” Phenomena, Tokyo:Gakubun Sha.
Nakashima, Yoshimi & Hara, Akiko. 2009. Which is Effectualon theMeasurementoftheSchoolAvoidance Feeling, by the Strength or by the Frequency? -An attemptofMeasurementsby both-.TheJointJournalof the National Universities in Kyushu, Education and Humanities.2,1-8. Reed,H.B.1961.TearcherVariableofWarmth,Demand, and Utilization ofIntrinsicMotivation Related to Pupil’s ScienceInterest:A Study Illustrating SeveralPotentialsof Variance-Covariance.JournalofExperimentalEducation. 29,205-229.
Richardson,F.C.& Suinn,R.M.1972.TheMathematics Anxiety Rating Scale:Psychometric Data. Journal of Counseling Psychology.19,551-554.
国際教育協力研究 第7号 20
Satoh, Yuhkoh & Saito, Seiichi. 2001. Developmental Process of Multiple Feelings of Self-disgust during Adolescence and Adulthood. Bulletin of Graduate SchoolofHuman Developmentand Environment,Kobe University.Vol.8-2,27-40.
Suzuki, Manami., Asakawa, Kiyoshi., Minami, Masanori & Qi, Qiumeng. 2011. The Relations between Social Skills and Feelings of School Avoidance in College Students.TheJournalofSchoolEducation.23,27-33. Takekuma, Manami. 2011. Education in Fiji, from an
International or Multi-Ethnic Perspective. Bulletin of Fukuoka InternationalUniversity,No.25,15-24. Tomishige, Kaoru & Ogura, Tamiko. 2001. Bulletin of
Graduate School of Human Development and
Environment,KobeUniversity.Vol.8-2,1-12.
Watabe,Reijirou & Sakuma,Tatsuya.1998.A Study on Structures of Children’s Arithmetic Anxiety and Methods of Teacher’s Supports. Japanese Journal of EducationalPsychology.46.184-192.
Watanabe,Yoichi& Koishi,Hirofumi.2000.A Study on the Negative Feeling toward School in Junior High SchoolStudents.Bulletin ofGraduateSchoolofHuman Developmentand Environment,KobeUniversity.Vol. 8-1,1-12.
Yoshida, Michio & Yamashita, Ichirou. 1987. Factors influencing the students' learning motivation and I n-service Teachers’ Perception. Japanese Journal of EducationalPsychology.35,309-317.