Andrew RUSH, Ernest HEALY and Dharma ARUNACHALAM Centre for Population and Urban Research
Monash University
Diverse Society – Melbourne Australia
Abstract
This research focuses on the relationship between social inequality and social capital in local communities in the State of Victoria, Australia. Four indicators of social inequality are used - income and education levels, along with ethnic composition and gender, which are strong predictors of inequality within communities in the Australian context. The chosen measure of social capital is voluntary work for an organisation or group, a variable included in the Australian Census as an indicator of social capital.
The relationship between social inequality and social capital is examined using Local Government Area (LGA) and Statistical Local Area (SLA) level population data from the 2011 Australia Census, for the State of Victoria. Data at these geographic levels is analysed using univariate, bivariate and multivariate analysis techniques, although only data from metropolitan Melbourne is used in the multivariate analysis. Gender is only examined at the univariate level.
The results showed strong overall links between social capital and the respective measures of income, ethnicity, gender and education.
Introduction
Social capital has received considerable attention in social science literature in recent years.
Political scientists and economists take a normative approach which highlights the values and attitudes that govern social interactions. Sociologists, in contrast, often adopt a social structuralist approach which emphasises social networks, organisations and linkages (Foley
& Edwards 1999, p. 142).
Putnamʼs work, most notably his 1995 publication “Bowling Alone: Americaʼs declining social capital” (Putnam 1995a), has popularised the concept of social capital amongst
academics and in popular discourse in recent years. Although research by Leigh and Healy has investigated the links between a range of social indicators and social capital outcomes in the state of Victoria, Australian literature on social capital is still relatively limited. While Leigh (2006) examined the associations between several indicators of inequality and social trust, Healy (2007) focused on the relationship between ethnic diversity and volunteering.
Similarly, the Australian Bureau of Statistics (ABS) investigated the role of ethnic diversity, education and a number of other social indicators in generating social capital in Australian communities (ABS 2006). In this paper, we examine how personal income, level of education, ethnicity and gender are associated with one indicator of social capital, ʻvoluntary work for an organisation or group,ʼ in the state of Victoria.
Volunteering is widely accepted as an appropriate measure of social capital as it relies on the use of social networks, and promotes actions which benefit individuals, communities and society. Many such networks are crucial for the structure and function of modern society.
Many authors, including Putnam, Glaeser, Hall and Lin have noted the association between community level differences in education, income, gender and ethnic composition and social capital outcomes. Their studies, along with those of a number of other authors, are discussed below.
Inequality and social capital
There are many problems associated with social inequality, including low levels of social capital (Wilkinson and Pickett 2007). Relative deprivation (income inequality) has been consistently associated with low levels of personal trust (Kawachi et al. 1999) and associational membership (Green 2007). Hall (1999) found in Britain that ʻpeople in the middle class have twice as many organizational affiliations as ... the working class and they are likely to be active in twice as many organizationsʼ (Hall 1999, p. 438). Patterns of sociability of the working class are also more likely to revolve around relatively narrow and closely connected kin and friendship networks, which greatly limit these groupsʼ access to wider social capital networks and resources. Lin (2000) argues that low levels of social capital occur when certain social groups cluster at relatively disadvantaged socioeconomic locations, leading to a general tendency for individuals to form social networks with those in a similar social position to themselves. This leads to individuals from disadvantaged groups networking in groups with poorer quality resources, which subsequently leads to poorer social capital for the individuals in these groups. You (2005) argues that the poor will regard themselves as the losers in societies with an unequal distribution of income and other resources, and will consequently exhibit lower levels of social trust. This stands in contrast to
the ʻsimilarityʼ explanation, which suggests those belonging to the most common group should have the highest levels of social trust. From this perspective, individualsʼ sense of belonging in a community is largely influenced by the equality of opportunity within that community (Rothstein and Uslaner 2005; Putnam 2001).
Education is one of the most important predictors of social capital, including voting, trust and organisational participation (Putnam 1995b; Helliwell & Putnam 2007). Additionally, Putnam (1995b) found that the level of education is a very strong predictor of social capital returns, with the last two years of university education twice as important as the first two years of high school. In Britain, Hall (1999) found that voluntary participation in community organisations for a post-secondary school graduate in 1990 was 110 per cent higher than for secondary graduates. A meta-analysis by Huang et al. (2009) indicated a significant positive effect of education on individual social capital measured by levels of social participation and social trust.
A number of studies have also highlighted the importance of ethnic heterogeneity in creating social capital. According to Putnam (2001), patterns of immigration are strongly associated with the levels of social capital in the United States. Specifically, areas with a higher proportion of population with Scandinavian ancestry showed greater levels of social capital. However, as noted by Glaeser (2001), the Scandinavian population is also highest in states with greater ethnic homogeneity, and countries with greater homogeneity tend to have more social capital. It is argued that social capital requires coordination, which is more difficult when people are different from one another (Alesina & LaFerrara 2000 cited in Glaeser 2001). Nevertheless the formation of social capital through mutual cooperation may be possible when there are opportunities to connect with people of different backgrounds (Conley & Uslaner 2003). Such bridging ties are essential for the development of social capital in heterogeneous communities. They refer to groups likely to form these bridging bonds as ʻgeneralised trustersʼ, and those who only trust people from their own social group as ʻparticularised trustersʼ. Lin (2000) also argues that ethnic communities rely on smaller and more poorly resourced social networks revolved around family, friends and members of their local community, which is consistent with particularised trusters.
Gender differences in social capital outcomes have received relatively little attention in the social capital literature. While women had a higher proportion and greater diversity of kin ties in their personal networks than did men, men had larger networks than females on average (Lin 2000). This is because men tend to be located in larger organisations related to economic institutions, which provide greater access to social resources including business opportunities, potential job openings, and other means of career advancement. Women, on
the other hand, were located in smaller, less influential organisations, which were more focused on local and domestic affairs (Lin 2000).
Putnam (1995b) notes a significant decline in the membership of voluntary organisations between the 1960s and 1990s. However, the decline has been more significant for females.
Putnam speculates that this may be due to far more women entering the workforce in recent decades; however, he goes on to note that working women are marginally more inclined to be members of voluntary associations than housewives. Furthermore, the overall declines in civic engagement over this period have been considerably greater among housewives than among employed women.
In recent years, there has been a growing body of literature on social capital in Australia.
However, this is still largely underdeveloped, particularly in relation to measuring the association between inequalities in income and education and social capital outcomes.
According to the 2006 Census of Population and Housing and the 2006 Australian General Social Survey, those who work part time are significantly more likely to volunteer than those who either work full time or are unemployed (ABS 2012). Further, Healy (2007) found that those earning $2000 or more per week are more likely to volunteer than those in low income brackets (below $599 per week). Leigh (2006) showed that a 10 per cent increase in mean income was associated with a three per cent increase in localised trust and a two per cent increase in generalised trust.
People with a post-school qualification or who have completed year 12 are significantly more likely to volunteer than those with who have completed year 11 or lower (ABS 2012).
Participation in education can build and strengthen social capital through the creation of social networks based on participation and reciprocity. Leigh (2006) showed a strong positive correlation between years of education and localised and generalised social trust.
Although Australian society is fairly cohesive, lower levels of social capital were found in areas with higher concentrations of immigrants (Pardy and Lee 2011). Leigh (2006) examined data from the 1997-1998 Australian Community Survey and the 1996 Australian Census to measure the relationship between trust and a number of factors, including neighbourhood ethnic diversity. His findings showed a strong negative correlation between localised trust and ethno-linguistic diversity. In other words, neighbourhoods with a greater diversity of ethnic groups (measured by place of birth) and languages spoken exhibited lower levels of trust than communities where the majority of residents identify as Australian and spoke English as their first language. Interestingly, in his regression analysis of this relationship, where social inequality indicators and ethnic and linguistic diversity are measured separately against trust, only linguistic diversity remained statistically significant,
while coefficients of ethnicity and inequality were small. Furthermore, Leigh found that in more linguistically diverse neighbourhoods both Australian-born and overseas-born residents exhibited lower levels of trust for other members of that neighbourhood (localised trust).
However, for overseas-born residents, these lower levels of trust only extended to people beyond the neighbourhood (generalised trust).
In contrast, Healy (2007) found that those from non-English speaking countries were less likely to volunteer than those born in Australia or in other English speaking countries regardless of language proficiency. Healy also found that the relationship between ethnic diversity and volunteer rates did not vary significantly with income. Nevertheless, volunteering rates tend to be lower in poor socioeconomic neighbourhoods amongst both Australian-born and NESB-born residents (Healy 2007).
Some argue that the disparity in volunteering between those from English-speaking and non-English speaking backgrounds is largely due to differences in attitudes to volunteering amongst people from different ethnic backgrounds (Randle & Dolnicar 2007). Those from Australian, British and Dutch backgrounds were found to have a more individualistic approach to volunteering, while those from Greek, Italian and Macedonian backgrounds were more conscious of the views of family, friends and others within their ethnic communities (Randle & Dolnicar 2007). Although many people from these latter groups did perform many activities which could be regarded as “volunteering”, they tended to be more directed towards family members and friends rather than towards the wider community. In other words, the definition of volunteering also varies between different ethnic groups (Randle & Dolnicar 2007). Potentially, this means that many members of NESB ethnic groups could be participating in activities which do not meet the official definition of volunteering, but may otherwise be regarded as volunteering.
Regarding gender differences, females are more likely to volunteer than males (ABS 2012).
This is despite the tendency for women to be members of fewer associations than men (Peter
& Drobnic 2013). A survey of 212 youths (aged 12-20 years) in the rural NSW town of Broken Hill found that, although girls start off with a fairly high community participation rate, this drops dramatically between the ages of 15 and 18, while males aged 18 or over had the highest participation rates of any group (Onyx et al. 2005). The authors concluded this was largely connected to women in the community feeling unsafe as a result of high rates of domestic violence and teenage pregnancies within the Broken Hill area. Although this study only examined the Broken Hill area, similar problems may be present in many other rural communities throughout Australia, which may decrease the willingness of people-especially females-to participate in public life.
The literature above has highlighted the importance of participation in voluntary organisations in relation to the production of social capital at the community level. The following sections will investigate this relationship at an empirical level, using data for the State of Victoria, Australia, and the same indicator variables described above.
Method
This paper examines the relationship between income, education, ethnic diversity and gender and levels of volunteering in the state of Victoria, Australia. The focus is at the LGA (Local Government Area) level as well as the SLA (Statistical Local Area) level for the multivariate findings, and we use data from the 2011 Australian Census. In total, all 79 Local Government Areas (excluding unincorporated postcodes) located in the State of Victoria were included in the data. Of these, 31 are located in the metropolitan (Melbourne) area and 48 are located in regional areas. LGAs in metropolitan Melbourne contain an average population of 129,032 residents, while LGAs located in regional Victoria have an average population of 28,036 residents. There are a total of 79 SLAs located within metropolitan Melbourne, with an average population of 50,633 residents.
Income inequality was measured by two indicators: the percentage of people within each LGA or SLA whose income was low ($31,199 per year or lower), and the percentage whose income was high ($104,000 per year or above). These measures were chosen to give an indication of which Victorian communities suffer from greater levels of relative income deprivation and those which have the greatest portion of high income earners. All people aged 15 years and over were included in the analysis of income, as the ABS does not provide data for those under 15 years of age.
Educational inequality was measured as the portion of respondents within each LGA or SLA who have completed a bachelors degree or higher. Respondents aged 25-64 years were included in deriving this measure of inequality.
Ethnic diversity was measured by three indicators: country of birth, ancestry (1st response) and main language spoken at home. Place of birth diversity was measured by the percentage of residents within each LGA who were of Australian, New Zealand, British, Irish or North American origin; ancestry diversity was measured by the percentage of residents within each LGA who listed their ancestry (1st response) as Australian, New Zealander, British, Irish or North American (There was also an “ancestry 2nd response” option provided by the census questionnaire, but this not used in our analysis), while language diversity was measured by the percentage of people within each LGA or SLA who reported English as their main
language spoken at home.
The dependent variable is the proportion of people engaged in voluntary work through an organisation or group in each LGA or SLA within the 12 months prior to the census. All the independent variables of inequality and diversity are also percentages. We thus employ multiple regression statistical techniques to establish the net relationship between each measure of inequality and diversity and subsequent volunteering rates.
Results: Univariate data and analysis
This section briefly examines the ways that the selected indicators and measures of social capital characterise the Victorian population.
Personal income data from the 2011 census show that those receiving less than $600 per week (low income) comprised over 48.4 per cent of the population, compared with 25 per cent in the top two income groups ($1000-1499, and above $1500). The proportion in the
$2000 or more per week (high income) bracket was 5.7 per cent. At the same time, approximately 40 percent of persons in Victoria received between $300 and $999 per week.
This mid-range income share is considerably greater in non-metropolitan areas compared with areas of metropolitan Melbourne.
Education data show that slightly more than half (55.9 per cent) of Victorians aged 25-64 years, had obtained a post-school qualification. The percentages in regional areas were marginally less. Diplomas and certificates were the most common qualifications, particularly in regional areas. Because the majority of diploma and certificate level qualifications (sub- Bachelor degree) are received from vocational level institutions (TAFE colleges), the percentage of Victorians with university-level qualifications is still relatively low (27.2 per cent), again, particularly in non-metropolitan Victoria.
Ethnicity data show that the majority (74.8 per cent) of Victorian residents were born either in Australia or another predominantly English speaking country. By contrast, however, only 61 per cent of respondents reported their ancestry (1st response) as being from one of these countries. This observation may reflect the relatively high rates of ethnic intermarriage
Table 1 Rates of Voluntary work in Victoria, by gender and age group: 2011 census.
Gender 15-29 years 30-49 years 50-64 years 65 + years Total Male
Female Overall
12.8 17.1 14.9
16.0 21.4 18.7
18.6 20.9 19.8
17.0 17.6 17.3
15.9 19.5 17.7 Source: ABS, Tablebuilder (2011 Australian census)
in Australia, which have increased with growth in the number of second generation immigrants (Price 1996, p. 13).
Data on voluntary work show that 17.7 per cent of the Victorian population volunteered in the twelve months prior to the 2011 Census. There is a considerable gender difference, with 19.5 per cent of females and 15.9 per cent of males having volunteered. As noted, this difference may be related to the greater percentage of females working part time compared to males. As noted above, people employed part time have significantly higher rates of all forms of unpaid work (including voluntary) than those who either work full time or who are unemployed (ABS 2012). The gender difference is greatest in the 15-29 years and 30-49 years age groups.
Results: Bivariate and multivariate analyses
This section is divided into two parts. The first part examines the bivariate relationships between volunteering and the respective indicators of inequality at the LGA level, while the second analyses these relationships using multiple regression analysis at both the LGA and SLA levels.
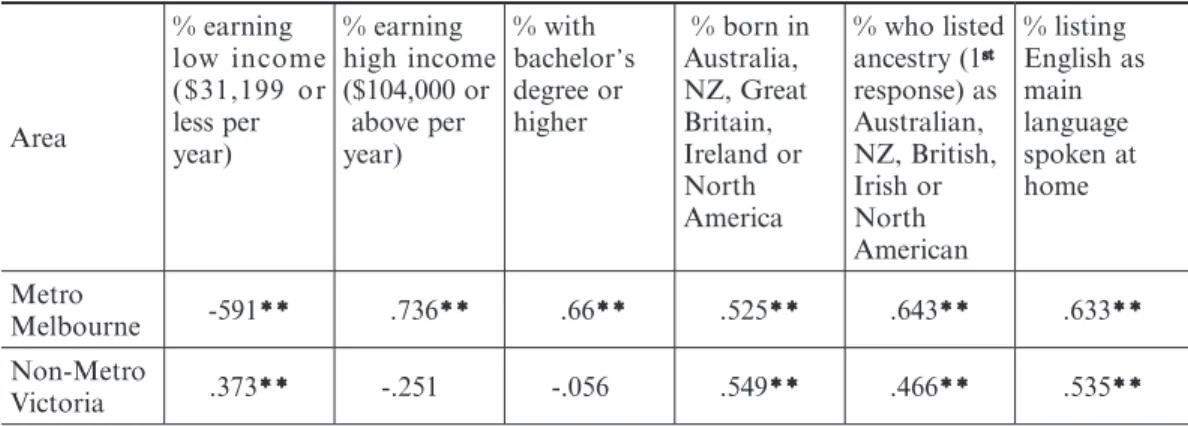
The bivariate data analyses between voluntary work and the selected indicators of inequality show strong correlations between all three indicators of ethnicity and volunteering at the p≤0.01 level in both metropolitan and regional areas of Victoria. However, the findings for income and education levels varied greatly between metropolitan and regional Victoria.
Table 2 Bivariate Correlations (Pearson r value) between voluntary work and chosen indicators, including gender, for metropolitan Melbourne and non-metropolitan Victoria, at the LGA level.
Area
% earning low income ($31,199 or less per year)
% earning high income ($104,000 or above per year)
% with bachelorʼs degree or higher
% born in Australia, NZ, Great Britain, Ireland or North America
% who listed ancestry (1st response) as Australian, NZ, British, Irish or North American
% listing English as main language spoken at home
Metro
Melbourne -591** .736** .66** .525** .643** .633**
Non-Metro
Victoria .373** -.251 -.056 .549** .466** .535**
Source: ABS, Tablebuilder (2011 Australian census)
Note: *indicates correlation is significant at the 0.05 level, and ** indicates correlation is significant at the 0.01 level.
In metropolitan Melbourne, voluntary work was strongly correlated with high income (positive), low income (negative) education levels (positive), and ethnicity (positive). All four of these correlations were significant at the p≤.01 level of significance. By contrast, in regional areas, only ethnicity (positive) and low income (positive) were significantly associated with voluntary work; and in the case of low income, in the opposite direction to what was found in metropolitan areas. This strongly contradicts previous social capital literature, i.e. Hall (1999). This may mean that there are different dynamics at work in the creation of social capital in metropolitan and non-metropolitan areas within Victoria. For example, some previous research indicates that civic engagement, particularly in organised sporting activities, is particularly strong in small rural/non-metropolitan communities, a factor that may counteract the effects of low income on social capital to some degree (Tonts 2005). Given these findings, the multivariate data analysis is only carried out for LGAs within metropolitan Melbourne.
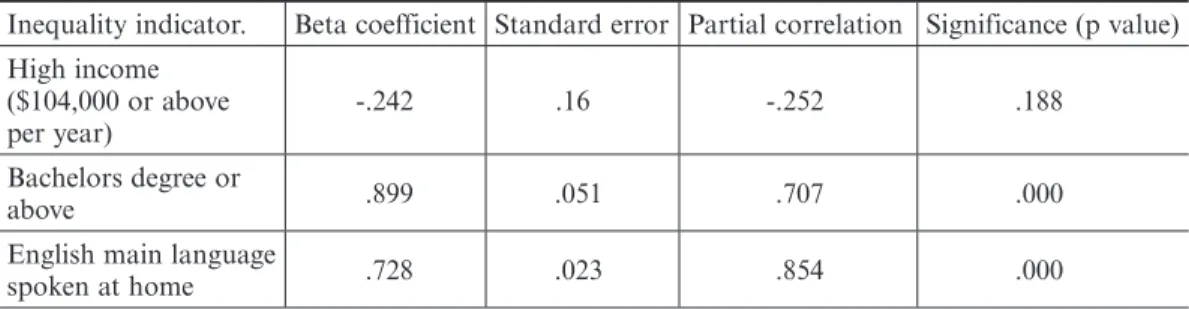
Tables 3 and 4 show the multivariate models used to examine the relationship between rates of volunteering behaviour and the selected independent variables. Table 3 shows these relationships at the LGA level, and Table 4 at the SLA level. High income was chosen as the only indicator of income for the multivariate analysis due to the limited number of cases at the LGA level (31), which only allowed for a maximum of three independent variables to be used in any one calculation. It was decided not to include low income in measuring the relationship between volunteering and the chosen indicators at the SLA level. Initial multivariate analysis showed only high income was still statistically significant. Only one indicator of ethnicity (Language) was chosen given that bivariate correlations revealed an extremely strong amount of collinearity between the three indicators of ethnicity, with all
Table 3 Multivariate linear regression models for voluntary work, including all indicators of inequality (metropolitan Melbourne, LGA level).
Inequality indicator. Beta coefficient Standard error Partial correlation Significance (p value) High income
($104,000 or above per year)
-.242 .16 -.252 .188
Bachelors degree or
above .899 .051 .707 .000
English main language
spoken at home .728 .023 .854 .000
Note: *indicates partial correlation is significant at the 0.05 level, and ** indicates partial correlation is significant at the 0.01 level. # indicates a variable was excluded for a particular model.
three combinations displaying a correlation of .95 or above.
The results of the multiple regressions for voluntary work at the LGA level (Table 3) show a strong positive correlation with the education variable. This means that increased rates of volunteering are strongly linked to higher education levels. Consistent with this, there is also a positive association between volunteering and language. However, in this model, high income is no longer significant at the p≤.05 level, and the partial correlation for this variable suggests a relatively small negative relationship with volunteering, once education and ethnicity are controlled for. These results are all confirmed by their respective beta coefficients and partial correlations.
The findings at the SLA level, shown in Table 4 below, are almost identical to those shown in Table 3, with the education and ethnicity variables once again significant at the p≤.01 significance level, while high income again falls short of significance and, as was the case at the LGA level, displays a small negative partial correlation (-.162). The corresponding beta values and partial correlations for all three indicators are also strikingly similar to those displayed in Table 3. These findings demonstrate the relationship between social capital (measured by voluntary work) and indicators of social inequality and difference are consistent when measured at different geographical levels, despite the far smaller number of cases used at the LGA level (31) compared to the SLA level (79).
Discussion
The bivariate analysis supports the argument that ethnic diversity is inversely associated with social capital (as measured by volunteering activity). Authors such as Lin (2000) and Putnam (2001), for example, have argued that areas with higher levels of ethnic homogeneity will Table 4 Multivariate linear regression models for voluntary work, including all indicators of
inequality (metropolitan Melbourne, SLA level).
Inequality indicator. Beta coefficient Standard error Partial correlation Significance (p value) High income
($104,000 or above per year)
-.185 .123 -.162 .159
Bachelors degree or
above .774 .05 .569 .000
English main language
spoken at home .771 .017 .816 .000
Note: *indicates partial correlation is significant at the 0.05 level, and ** indicates partial correlation is significant at the 0.01 level. # indicates a variable was excluded for a particular model.
possess higher levels of voluntary work.
The multivariate analysis supports the arguments of Putnam & Helliwell (2007) and Hall (1999), which propose that areas with higher percentages of residents with a university level qualification are characterised by higher levels of volunteering, a key indicator of social capital. Finally, the contention that high-income areas will have higher levels of volunteering (Lin (2000) & You (2005) was supported by the bivariate data analysis, although the results of the multivariate analyses pose some doubt concerning this relationship. Because high income is closely correlated with high education levels, this initially seems contradictory. This apparent inconsistency is discussed further below.
The multivariate analysis of the education indicator (proportion of persons with bachelor degree or above) lends strong support to the argument that those who are better educated are more likely to volunteer (Putnam (1995b); Hall (1999), & Huang et al. (2009)). This result was supported by the bivariate correlations, and the multivariate analysis. This outcome lends strong support to Putnamʼs (1995b) argument that education is the most important variable in determining volunteering levels, and that this is also likely to apply to areas outside of the United States.
However, it should be noted that the initial multivariate analysis, which excluded the language indicator, showed no significant association between education and voluntary work.
However, as there is also a high correlation (positive) between education and high income, the contrasting findings for education and income in the final multivariate analysis could be a result of the strong collinearity between education and high income. Another likely explanation for the strong association between education and volunteering in the final multivariate findings is that there is a strong association between education and language (the proportion of persons speaking English in the home). This would be expected given that many of those who primarily speak a language other than English at home may have some difficulty with English, which would subsequently make it more difficult to complete a higher qualification in Australia.
However, regarding the income variable, it should again be noted that the initial multiple regressions found high income to be strongly positively correlated with voluntary work when controlling for low income alone. Therefore, it could also be argued that the multivariate findings also support the contention by authors, including Hall (1999) & Lin (2000), that low-income earners tend to rely on more restrictive, family and friend based networks Hall (1999) & Lin (2000), while high-income earners use a wider variety of connections, typically associated with volunteering. Although the relatively small number of cases may also have influenced these findings, it should be noted there were over twice as many cases at the SLA
level (79) as there were at the LGA level (31), but there was little variation in the findings between the two.
Other factors may help explain the ambiguous findings for income. These include differences in the amount of free time available for volunteering between those who work part-time and those who work full-time. Higher income earners may choose to donate to organisations rather than volunteer personally. Further, LGAs with greater numbers of children and larger families may provide greater opportunities for volunteering through an abundance of local community centres such as schools, churches and sporting clubs. These factors need further examination in explaining the relationship between social inequality and social capital.
Consistent with this studyʼs initial hypotheses, both the bivariate correlations and the multivariate regressions for ethnicity supported the contention that rates of voluntary work are higher in communities where there is greater ethnic homogeneity, i.e. (Alesina and LaFerrara 2000; Lin 2000, & Conley & Uslaner 2003). It should be noted that volunteering is largely dependent on skills such as language proficiency as well as a sense of belonging and/or status within the local or wider community.
Nevertheless, it should be noted that, in responding to the Census form questions, some respondents may classify activities, such as volunteering for a local ethnic organisation, as voluntary work while others do not, which potentially confounds research findings. As mentioned in the introduction, different ethnicities often define volunteering in different ways (Randle & Dolnicar 2007).
Conclusion
The findings indicate strong relationships between the selected measures of inequality and social capital. Differences in personal income, education levels, ethnic diversity and gender all contribute to social capital levels, as measured by levels of voluntary work in Victorian communities. Of the chosen indicators, education and ethnicity had the greatest effect on social capital levels according to the multivariate findings, suggesting that Putnamʼs (1995b) findings on education also apply to Australian communities, while the findings of Glaeser (2001), Leigh (2006), Healy (2007) and others apply with regard to ethnicity. Nevertheless, the contention that volunteering rates are higher in high-income areas was not supported by the high income indicator in the multivariate regression analysis. However, there is still some contention over this finding.
The study contained a number of limitations. These included not controlling for differences in age structure between LGAs or SLAs; no analysis of within-community
variations (or deviations) in the chosen indicators; and only measuring income at the personal income level. The latter shortcoming does not provide an adequate measure of poverty because the results do not take household income into account.
A noteworthy limitation was not being able to include additional measures of community participation, which is a significant drawback in using Australian census data. Further, the use of census data means that the chosen indicators of social capital can only measured at the population level. Therefore, future research should use both quantitative and qualitative research methodologies at the local level to better understand the processes influencing social capital at the community level.
Future investigations should also focus on the changing levels of volunteering within Australian communities. In Australia, such research is particularly relevant to the challenge of creating diverse communities which are, at the same time, cohesive.
References
Australian Bureau of Statistics (ABS) 2006, 2914.0 Census of Population and Housing - Fact Sheets, viewed 20 April 2014,
http://www.abs.gov.au/AUSSTATS/[email protected]/DetailsPage/2914.02006?OpenDocument
Australian Bureau of Statistics (ABS) 2009, 6365.3 Preferred working hours of wage and salary earners, Queensland, Oct 2006, viewed 6 October 2013,
http://www.abs.gov.au/AUSSTATS/[email protected]/productsbyCatalogue/FAD911478B3CBACECA2572 EB007639A8?OpenDocument
Australian Bureau of Statistics (ABS) 2012, 4441.0.55.002 A Comparison of Volunteering Rates from the 2006 Census of Population and Housing and the 2006 General Social Survey, Jun 2012, viewed 20 August 2013,
http://www.abs.gov.au/ausstats/[email protected]/Latestproducts/4441.0.55.002 Main%20Features6Jun%20 2012?opendocument&tabname=Summary&prodno=4441.0.55.002&issue=Jun%20 2012&num=&view=
Australian Bureau of Statistics (ABS) 2012, 4125.0 Gender Indicators, Australia, Jul 2012, viewed 20 September, 2013,
http://www.abs.gov.au/ausstats/[email protected]/Lookup/by%20Subject/4125.0~Jul%202012~Main%20 Features~Employment%20conditions~1120
Australian Bureau of Statistics (ABS) 2012, 5673.0.55.003 Wage and Salary Earner Statistics for Small Areas, Time Series, 2009-10, viewed 20 October 2013,
http://www.abs.gov.au/ausstats/[email protected]/mf/5673.0.55.003
Alesina, A & La Ferrara, E 2000, ʻParticipation in heterogeneous communitiesʼ, The quarterly journal of economics, vol. 115, no. 3, pp. 847-904
Conley, R & Uslaner, E 2003, ʻCivic engagement and particularized trust: the ties that bind people
to their ethnic communitiesʼ, American politics research, vol. 31, no. 4, pp. 331-360
Dolnicar, S & Randle, M 2007, ʻ”What motivates which volunteers?” Psychographic heterogeneity among Volunteers in Australiaʼ, Voluntas: International journal of voluntary and nonprofit organizations, vol. 18, no. 2, pp. 135-155
Foley, M & Edwards, B 1999, ʻIs it time to disinvest in social capital?ʼ Journal of Public Policy, vol.
19, no. 2, pp. 141-173
Glaeser, E 2001, ʻThe formation of social capitalʼ, Canadian journal of policy research, vol. 2, no. 1, pp. 34-40
Green, A 2007, Education, Equality and social cohesion: Presentation at National Chinan University, Institute of Education, viewed 10 May 2013,
http:// www.ced.ncnu.edu/tw_Andy/Green_at/Chinan/uni.pd
Hall, P 1999, ʻSocial capital in Britainʼ, British journal of political science, vol. 29, no. 3, pp. 417-461 Healy, E 2007, ʻEthnic diversity and social cohesion in Melbourneʼ, people and place, vol. 15, no. 4,
pp. 49-64
Helliwell, J & Putnam, R 2007, ʻEducation and social capitalʼ, Eastern economic journal, vol. 33, no. 1, pp. 1-20
Huang, J, Maassen van den Brink, H & Groot, W 2009, ʻA meta-analysis of the effect of education on social capitalʼ, Economics of education review, vol. 28, no. 4, pp. 454-464
Kawachi, I, Kennedy, B & Wilkinson, R 1999, ʻCrime: social disorganization and relative deprivationʼ, Social science and medicine, vol. 48, no. 6, pp. 719-731
Leigh, A 2006, ʻTrust, Inequality and Ethnic Heterogeneityʼ, Economic Record, vol. 82, no. 258, pp.
268-280. 82 (258), 268-280
Lin, N 2000, ʻInequality in social capitalʼ, Contemporary sociology, vol. 26, no. 6, pp. 785-804.
Onyx, J, Woods, C, Bullen, P & Osburn, L 2005, 'Social capital: A rural youth perspective', youth studies Australia, vol. 24, no. 4, pp. 21-27
Pardy, M & Lee, J 2011, ʻUsing buzzwords of belonging: everyday multiculturalism and social capital in Australiaʼ, journal of Australian studies, vol. 35, no. 3, pp. 297-316
Peter, S & Drobnic, S 2013, ‘Women and their Memberships: Gender Gap in Relational Dimension of Social Inequalityʼ, research in social stratification and mobility, vol. 13, pp. 32-48
Price, C 1996, ʻEthnic intermixture of migrants and indigenous peoples in Australiaʼ, People and Place, vol. 4, no. 4, pp. 12-16
Putnam, R 1995a, ʻBowling alone: Americaʼs declining social capitalʼ, Journal of democracy, vol. 6, no. 1, pp. 65-78
Putnam, R 1995b, ʻTuning in, tuning out: the strange disappearance of social capital in Americaʼ, Political science and politics, vol. 28, no. 4, pp. 664-683
Putnam, R 2001, ʻSocial capital: measurement and consequencesʼ, Isuma, vol. 2, no. 1, pp. 41-51 Rothstein, B & Uslaner, E 2005, ʻAll for all equality, corruption, and social trustʼ, World politics,
vol. 58, no. 1, pp. 41-72
Tonts, M 2005, ʻCompetitive sport and social capital in rural Australiaʼ, Journal of Rural Studies, vol. 21, pp. 137-149
Wilkinson, R & Pickett, K 2007, ʻThe problems of relative deprivation: why some societies do better than othersʼ, Social science and medicine, vol. 65, no. 9, pp. 1965-1978
Department of Education and Early Childhood Development (DEECD), summary statisitics, Victorian schools report 2013, viewed 4 June 2014,
http://www.education.vic.gov.au/about/GHSDUWPHQW3DJHVIDFWVDQG¿JXUHVDVS[
You, J 2005, Corruption and inequality as correlates of social trust: fairness matters more than similarity: The Hauser Centre for Non profit Organisations and The John F. Kennedy School of Government, Harvard University, Working Paper, No. 29, viewed 14 May 2013,
http://www.hks.harvard.edu/hauser/PDF_XLS/workingpapers/workingpaper_29.pdf