早稲田大学審査学位論文 博士(スポーツ科学)
Genome-wide Analysis of the Effect of Exercise on
Translational Regulation and Co-expressed Gene Network
翻訳調節と共発現遺伝子ネットワークに対する 運動効果の網羅的解析
2016年1月
早稲田大学大学院 スポーツ科学研究科
佐古 博皓 SAKO, Hiroaki
研究指導教員: 鈴木 克彦 教授
CONTENTS
PREFACE . . . 6
I. INTRODUCTION . . . . 9
I-i. Modification and Application of Ribosome Profiling to Investigate the Translational Regulation in Mouse Working Muscle . . . 9
I-i-i. Pros and Cons in Conventional Genome-wide Analysis and Translational Regulation
I-i-ii. Analysis of Translation/Protein Synthesis in Exercise Science
I-ii. Genome-wide Analysis of Translational Regulation: Alternative
Translation Physiological Significance of Translational Byproducts 14 I-ii-i. uORF
I-ii-ii. N-terminal extension/truncation I-ii-iii. Frameshift
I-iii. Genome-wide Analysis of Translational Regulation: Dynamic Change in Translation Speed of Ribosomes . . . 17
I-iii-i. Significance of Translation Speed and the Difficulty of the Investigation
I-iii-ii. Novel Analytical Approach to Examine Translation
I-iv. Genome-wide Gene Expression Analysis: Gene Co-expression Network Analysis . . . 21
I-iv-i. Big Data and Drawbacks in Conventional Gene Expression Analysis
I-iv-ii. Gene Co-expression Network Analysis
II. MATERIALS AND METHODS . . . 25
II-i. Modification and Application of Ribosome Profiling to Investigate the Translational Regulation in Mouse Working Muscle . . . . 26
II-i-i. Accession Number
II-i-ii. Animals and Endurance Exercise
II-i-iii. Total RNA Extraction for mRNA-Seq and Ribosome Profiling
II-i-iv. RNA fragmentation for mRNA-Seq
II-i-v. Monosome Extraction for Ribosome Profiling II-i-vi. Size Selection for Fragmented mRNA and RPF
II-i-vii. Ribosome RNA (rRNA) Removal, 5´ Phosphorylation, and 3´ Dephosphorylation from RPF
II-i-viii. Sequence Library Preparation, Sequencing, and Alignment II-i-ix. Reproducibility and Validity of Sequencing
II-i-x. Sequenced Data Analysis
II-i-xi. Real Time qPCR and Western Blotting
II-ii. Genome-wide Analysis of Translational Regulation: Alternative Translation . . . 36
II-ii-i. Accession Number II-ii-ii. Cell Culture
II-ii-iii. Detection of N-terminal Extension/Truncation and Translational Frameshift
II-ii-iv. Western Blotting
II-iii. Genome-wide Analysis of Translational Regulation: Dynamic Change in Translation Speed of Ribosomes . . . 38
II-iii-i. Validation of Binary Counts
II-iii-ii. TAC site and translational stall detection by metagene analysis
II-iv. Genome-wide Analysis: Gene Co-expression Network Analysis 42 II-iv-i. Data Collection and Pre-processing
II-iv-ii. Weighted Gene Co-expression Network Analysis (WGCNA)
II-iv-iii. Network Visualization
II-iv-iv. Module Preservation Analysis II-iv-v. Hub Gene Preservation
II-iv-vi. Preservation Analysis within Green Module Network in Acute Resistance Exercise (Post 4hr)
III. RESULTS AND DISCUSSION . . . 49
III-i. Modification and Application of Ribosome Profiling to Investigate the Translational Regulation in Mouse Working Muscle . . . . 49
III-i-i. Modification of Ribosome Profiling Using Cultured Cells III-i-ii. Application of the Modified Ribosome Profiling to Mouse Skeletal Muscle
III-i-iii. Discussion
III-ii. Genome-wide Analysis of Translational Regulation: Alternative
Translation . . . 63 III-ii-i. Validation of the currently developed analytical pipeline III-ii-ii. Novel Alternative Translation in RAW264 Macrophages III-ii-iii. Novel Alternative Translation in Mouse Skeletal Muscle III-ii-iv. Discussion
III-iii. Genome-wide Analysis of Translational Regulation: Dynamic Change in Translation Speed of Ribosomes . . . 71
III-iii-i. Reduced Bias in Ribosome Density by Binary Counts
III-iii-iii. Differentially Regulated Translational Stalls in a Stimuli-dependent Manner
III-iii-iv. The Effect of LPS-induced Alteration in Translational Stalls on Nascent Protein Folding
III-iii-v. Discussion
III-iv. Genome-wide Analysis: Gene Co-expression Network Analysis 82
III-iv-i. Research Design for the Analysis of Gene Co-expression Network Preservation across Exercise Types/Time-courses/Tissues III-iv-ii. Construction of PBMC Network after Acute Endurance Exercise III-iv-iii. PBMC Network Module Preservation in VL III-iv-iv. PBMC Network Hub Gene Status Preservation in VL III-iv-v. Muscle-Specific Network Preservation III-iv-vi. Exercise Type Specific Preservation III-iv-vii. Post Exercise Time-course Dependent Preservation III-iv-viii. Discussion IV. CONCLUSIONS . . . 108
ACKNOWLEDGEMENTS . . . 112
REFERENCES . . . 113
FIGURE LEGENDS . . . 139
PREFACE
The effect of exercise is highly sophisticated. To elucidate the mechanisms, intensive
researches, including physiological, biochemical, and molecular biological approaches,
have been conducted. However, there are still missing pieces in the approaches in
exercise/sports sciences, especially at genome-wide levels.
Genome-wide approach is a commonly used methodology to capture the global
regulatory mechanisms. Although genome-wide gene expression or proteomics analyses
have been carried out in exercise/sports sciences, there have been several limitations
(Graphical abstract): 1. Translational regulation has been little focused and 2.
Network-level dynamics of gene expression have never been investigated.
Translational regulation has been recently recognized as a critical determinant of the
followings (Graphical abstract): 1-a. Protein abundance, 1-b. Protein species (alternative
translation), and 1-c. Translation speed. Although they are hardly detected by
conventional analyses (e.g., gene expression or proteomics), they can exert pivotal
influences on cellular homeostasis. Again, however, in the field of exercise/sports
sciences, these genome-wide dynamics has never been investigated before.
Not only is it necessary to focus on genome-wide translational regulation, but also
conventional genome-wide gene expression analysis could need to be re-considered.
This is because conventional or widely recognized methods to analyze genome-wide
gene expression lack in network dynamics of co-expressed genes (Graphical abstract).
In nature, genes never work independently, but they do orchestrate together as a
network to maintain cellular homeostasis. Despite the significance of the network
dynamics, conventional gene expression analysis is unable to take into account of the
concept.
Thus, in my thesis here, I aim to fill in the gaps in exercise/sports sciences
particularly focusing on the following genome-wide analyses: 1. Translational
regulation and 2. Network dynamics (Graphical abstract).
Graphical abstract
I. INTRODUCTION
I-i. Modification and Application of Ribosome Profiling to Investigate the Translational Regulation in Mouse Working Muscle
Pros and Cons in Conventional Genome-wide Analysis and Translational Regulation
Recent technological improvements have advanced analytical methods in all the
fields of biology, including exercise/sports sciences. For example, proteomics and
microarray have derived a lot of benefits to analyze protein abundance and gene/micro
RNA (miRNA) expression in a genome-wide scale, respectively (1). The large-scale
analysis enables us to capture molecular dynamics from a systematic perspective.
However, it is also true that both proteomics and microarray have their own
drawbacks (1). As for proteomics, one limitation is the underestimation of
low-abundance proteins (2, 3). In mass spectrometry-based proteomics, for example,
two-dimensional gel electrophoresis and/or liquid chromatography are often used for
protein separation at a high-resolution level. On a two-dimensional gel, the spot of a
lowly expressed protein could be masked by other highly expressed proteins (2, 3).
Physiologically meaningful cytokines, including interleukin (IL)-6 and tumor necrosis
factor (TNF)-α, are produced at very low concentrations. Concentrations of other highly
abundant proteins, exemplified by serum albumin and α2-macroglobulin, are much
higher than those of IL-6 or TNF-α by up to 12 orders of magnitude (4-6). Even though
the removal of such highly abundant proteins using an immunoaffinity column may
improve the sensitivity to detect less abundant proteins, the removal efficiency is merely
80 to 90 %, indicating that there is still a large excess of 1011 the proteins (4, 7). Besides,
proteins physically interacting with the targets to be removed, might also be filtered out,
resulting in an unfavorable sample bias (7). Taken together, these issues may lower the
sensitivity to identify and underestimate low-abundance proteins in a large-scale
proteomics.
In a case of microarray, although such low-abundance gene expression can be
detected, post-transcriptional modification is ignored (8). Comparison between
microarray and protein abundance has indicated low correlations between them (R2 =
0.17 ~ 0.41), suggesting the insufficiency of mRNA expression as an indicator to
estimate the corresponding protein abundance (9-13). Intriguingly, one study revealed
that this low correlation is mainly caused by the ignorance of translational regulation
(14). Consideration of translation remarkably improved the correlation from R2 = 0.41
between mRNA and protein levels to R2 = 0.95 between measured translation rates and
protein levels (14). This finding indicates that translational regulation can exert
significant effect on protein abundance and also that post-translation, such as protein
degradation, has a weak effect (14). Thus, it is clearly evident that translational
regulation is a critical determinant of protein abundance and biological phenomenon.
Analysis of Translation/Protein Synthesis in Exercise Science
In the field of exercise/sports sciences, the regulation of protein synthesis and amino
acid metabolism is one of the major topics. Many researchers have intensively
investigated to understand the mechanisms of muscle adaptation to a variety of exercise
modes and types, such as acute and chronic exercise as well as endurance and resistance
exercise. Stable isotope tracers, for example, have enabled ones to examine the
regulation of overall protein synthesis in skeletal muscle (15-18). During acute
endurance exercise, overall muscular protein synthesis decreases in rodents and human
(19, 20). The decrease in protein synthesis can be regulated by activation of
AMP-activated protein kinase (AMPK) and decreased mammalian target of rapamycin
(mTOR) signaling (21, 22). However, in spite of the intensive observation of overall
muscular protein synthesis and widely recognized mTOR signaling cascades, little
attention has been paid to a genome-wide skeletal muscle protein synthesis or
translational regulation of individual genes. This is mainly attributable to the lack of
methodology for a genome-wide analysis of translational regulation (1).
Ribosome profiling has recently made it possible to conduct a genome-wide
translational regulation using a next generation sequencer (8). In ribosome profiling (8,
23), translating ribosomes can be stalled by translational inhibitor, followed by
enzymatic digestion of mRNA regions that are not protected by translating ribosomes.
On the other hand, mRNA regions that are under translation (i.e., protected by
translating ribosomes) cannot be digested. Therefore, these fragments are extracted and
deep-sequenced by a next generation sequencer. The extracted fragments are called
ribosome-protected fragments (RPF) with the length of approximately 30 nucleotides
(nt) in mammals. After sequencing the RPF, sequenced RPF (or sequenced reads) can be
mapped to a reference genome sequence to identify from which genes the RPF
originated. As in a typical high-throughput mRNA sequencing (mRNA-Seq), in which
highly expressed genes can be indicated by more mapped sequenced reads, genes with
more mapped RPF suggest more active translation. Therefore, ribosome profiling makes
it possible to conduct a genome-wide analysis of translational regulation focusing on
individual genes rather than overall protein synthesis. I adapted ribosome profiling
protocols to simpler ex vivo protocols using RAW264 macrophages (1), and I further
applied the simplified ribosome profiling for in vivo mouse model to investigate the
effect of a single bout of endurance exercise on translational regulation in mouse
working muscle (in revision).
I-ii. Genome-wide Analysis of Translational Regulation: Alternative Translation
There can be multiple distinct translational isoforms generated from a single mRNA.
Similarly to alternative splicing that results in multiple different mRNA isoforms
generated from a single gene, alternative translation can synthesize protein isoforms or
translational byproducts from a single mRNA. The isoforms include upstream open
reading frame (uORF), N-terminal extension/truncation, and frameshift. uORF is an
atypical ORF located in the upstream of the main ORF (mORF) and often much shorter
than the mORF. Extension/truncation of N-terminal can be attributable to alternative
translational initiation from the same main coding frame. Frameshift occurs outside of
the main coding frame (+1 or -1) and often synthesizes totally different polypeptides
compared with the mORF products.
Physiological Significance of Translational Byproducts uORF
uORFs are recognized as an important player in maintaining homeostasis. uORFs are
translated from canonical/non-canonical start codons. In mammals, at least one uORF
can be observed in roughly 50% of transcripts and often short in length (< 30 codons)
(24) (25). An uORF is also known as a translational regulator of the downstream mORF.
Most uORFs have negative effect on the downstream mORFs, in which translating
uORFs can reduce ribosomal re-initiation and therefore decrease the translation rate of
the mORF (26-28). For example, translation of β-site amyloid precursor protein cleaving
enzyme 1 (Bace1) mRNA, mediating the excessive accumulation of β amyloid seen in
Alzheimer’s disease, can be regulated by its uORFs (29). Under healthy conditions, the
4th uORF of 6 Bace1 uORFs is actively translated, decreasing the translation rate of
Bace1 mORF. This consequently represses β amyloid accumulation (29). These previous
studies support the physiological significance of uORFs.
N-terminal extension/truncation
Extension/truncation has direct impacts on the corresponding protein functions.
Diverse extensions and truncations, accounting for as much as 14 % of all the translated
products, have been discovered in mouse embryonic stem cells (28). N-terminal
truncation is of particular interest due to a possible lack of the functional domain,
leading to dysfunction of the protein. In a case of transcription factor, for example,
alternative translational initiation of CCAAT/enhancer binding protein (Cebpa)
produces an isoform shorter than the full length Cebpa protein by 12 kDa (30). It has
been reported that the truncated form has DNA-binding domain whereas it lacks in the
transactivation domain, resulting in prevention of the original function of Cebpa
anti-mitotic activity (30). This exhibits a clear evidence for the significant effect of
protein extension/truncation.
Frameshift
Frame-shifted translation generates proteins totally different from the main products
synthesized from the mORF. Although these byproducts can be degraded to prevent
them from aggregating and damaging the cells, such frame-shifted byproducts can
possess molecular function. One example is Ornithine decarboxylase (ODC) antizyme
(31). ODC antizyme is a negative feedback regulator of ODC, responsible for
polyamine synthesis (32). Increasing concentration of polyamine triggers a +1
frameshift, generating frame-shifted ODC antizyme which can promote the degradation
of ODC to maintain polyamine abundance (31).
Ribosome profiling also enables ones to detect these alternative translations. Here, to
develop a bioinformatics pipeline to screen all the reference genome sequence and to
identify such isoforms and byproducts, RAW264 macrophages were first used and I
established the pipeline to further analyze mouse skeletal muscle. Application of the
pipeline to RAW264 macrophages and mouse skeletal muscle revealed previously
unrecognized translational isoforms and byproducts.
I-iii. Genome-wide Analysis of Translational Regulation: Dynamic Change in
Translation Speed of Ribosomes
Significance of Translation Speed and the Difficulty of the Investigation
Genome-wide analysis of translational regulation can not only reveal translational
abundance or byproducts but also address whether the speed of translating ribosomes of
each gene is altered. Translation speed is now recognized as a critical determinant to
regulate protein conformation and even its function by affecting a nascent polypeptide
folding (33, 34). Therefore, it is of importance to understand how translating ribosomes
are stalled and where such stall occurs and also crucial to investigate whether
pathophysiological changes, such as inflammatory or exercise stimuli, can alter the
speed of translation.
However, it has been difficult to examine at a high resolution the effect of
pathophysiological changes on translation speed. In particular, in terms of where
translational stalls occur, there have been some discrepancies between in vitro and in
vivo analyses. In vitro, structural basis cryo-electron microscopy (cryo-EM) analysis has
revealed specific interaction at near-atomic-resolution between nascent amino acid
residues and ribosomal structure, such as nucleotide bases of ribosomal RNA (rRNA)
protruded out of the ribosomal exit tunnel wall (35-38). Despite the high resolution, the
effect of physiological changes is difficult to be examined in vitro.
Ex vivo, on the other hand, the use of ribosome profiling is suggested to estimate
translation speed. Ribosome profiling exhibits ribosome densities, where denser
ribosomes in a mRNA region suggest that these ribosome resided longer at the region,
indicating slower movement of the ribosomes (28). The use of ribosomes profiling has
discovered what factors affect translation speed, including codon bias/mRNA folding
energies (39), adaptation of secretory protein gene families to transfer RNA (tRNA)
pools (40), and specific nascent residues (28, 41, 42). However, the results addressing
where such stalls occur are often inconsistent to those in in vitro observation. Arginine
(Arg) residues, for example, have been widely recognized in vitro to induce
translational stall via electrostatic interaction between the positively charged Arg
residues and negatively charged ribosomal exit tunnel (43, 44). Ex vivo, however,
despite the detection of Arg-induced translational stalls (45), it has been difficult to
accurately identify the stall sites inside the ribosomal exit tunnel.
Novel Analytical Approach to Examine Translation
I speculated that the discrepancy between in vitro and ex vivo, especially where
inside the ribosomal exit tunnel stalls occur, could be attributable to the bias in
translation. Because ribosome profiling is so robust and sensitive that one can detect
unique translational events in a single mRNA (8, 28, 46), gene diversity (e.g., different
base composition and gene expression levels) might hamper a high-resolution analysis
of translational stalls. For example, in a case that small portion of highly abundant
mRNAs dominate the total sequenced reads, detected global signals of translation may
reflect only the small fraction of the mRNAs. This indicates that lowly expressed
mRNAs little contribute to the obtained signals of translation. The highly biased
observation might prevent the potentially interesting global characteristics and make it
difficult to detect where in ribosome translational stalls occur.
To minimize the inter- and intra-gene bias and to observe translational stall at a high
resolution, I developed a novel bioinformatics analysis, named binary count analysis.
The results showed the detection of translational stall at an unprecedented resolution ex
vivo and also in in vivo mouse skeletal muscle. The current approach further revealed
unexpected dynamics in translational stalls induced by acute inflammatory stimuli.
Taken together, in addition to the conventional view that different conditions (e.g.,
inflammatory or exercise stimuli) can change the expression levels of mRNAs or
proteins, now it can be implied that different pathophysiological conditions might cause
change in translation speed and therefore conformational/functional changes of nascent
proteins, consequently feeding back to the regulation of pathophysiological conditions.
I-iv. Genome-wide Gene Expression Analysis: Gene Co-expression Network Analysis
Big Data and Drawbacks in Conventional Gene Expression Analysis
Recently, it has been easier to conduct a genome-wide analysis. There has been an
increasing number of publicly available “big data”, including genomics, transcriptomics,
translatomics, and proteomics analyses. Using such freely accessible database, it is now
possible to take a systematic approach to further investigate genome-wide dynamics of
genes and their expression. Most commonly used analysis is to detect the differential
expression of mRNA. A standard workflow of differential expression analysis can be:
(i) Appropriate statistical model selection, (ii) Normalization of the expression values,
and (iii) Detection of differentially expressed genes (DEG). Comparing more than two
different conditions, ones can detect DEG, in which genes showing the largest
differences often have important pathophysiological impacts and therefore they are
likely to become further research targets.
However, despite the simple and widely recognized DEG approach as I used to
identify differentially regulated translation, there are several limitations. Major
drawbacks of detecting DEG can be a strict statistical threshold and the lack of network
and hub concepts (47, 48). Genes showing moderate expression changes but below a
statistical threshold (e.g., 2-fold changes in microarray) are often excluded from further
analysis. However, when these genes are enriched in a specific signaling pathway, the
pathway could be affected by the accumulated effects of the small expression changes
(48). In other words, the genes forming a network, where a specific biological pathway
is preserved, can have a biological importance even if their expression changes do not
exceed a statistically significant threshold.
Gene Co-expression Network Analysis
Gene co-expression network analysis, not restricted by a conventional statistical
threshold, can infer novel gene co-expression network from gene expression data by
clustering co-expression of genes (48-57). Using Weighted Gene Co-expression
Network Analysis (WGCNA) (47) and big data, such as microarray, it is possible to
construct de novo weighted-gene co-expression networks by calculating Pearson
correlations of the expression patterns of each pair of genes, followed by grouping
highly correlated genes together, defined as a network module. One module forms one
network and often specializes in a specific biological function (e.g., innate immune
response). Taken together with the expression changes of the genes in a network
depending on different conditions (e.g., control vs. treatment), one can investigate gene
regulation at a network level rather than an individual gene level (47).
Another beneficial aspect of gene co-expression network is the notion of “hub gene”.
In a scale-free network, for example, network of global flight paths, there are some hub
airports (e.g., New York, Tokyo, Paris). A hub airport is connected by many flight paths,
each of which is bound to a different airport. Therefore, such hub airports have
important roles in the flight network and the loss of a hub airport would be a huge
matter. Similarly in a gene co-expression network, a constructed co-expression network
can generate hub genes, which can have a strong influence on the network (47, 48,
58-60). Although the concept of hub genes lacks in a conventional DEG analysis, WGCNA is able to suggest functionally critical hub genes even if they are previously
uncharacterized.
Two distinct concepts, co-expression network and hub genes, generated by WGCNA
enables us to investigate network preservation in different conditions. This is suitable to
examine the effect of different modes of exercise in different tissues and different
time-courses. Because different modes of exercise derive highly diverse effects in many
different tissues and in different time-points after exercise, the conventional DEG
analysis has been difficult to understand the dynamics at a systematic level. Taking
advantage of the notion of co-expression network and hub genes, here using publicly
available microarray datasets, I investigated how different exercise modes affect the
network dynamics in different tissues and different time-courses and also analyzed to
what extent the affected networks can be preserved among different exercise modes,
tissues, and time-courses.
II. MATERIALS AND METHODS
II-i. Modification and Application of Ribosome Profiling to Investigate the Translational Regulation in Mouse Working Muscle
Accession number
The sequenced and processed files from the current study of mouse skeletal muscle
have been deposited in the National Centre for Biotechnology Information’s Gene
Expression Omnibus under the accession number GSE69699.
Animals and endurance exercise
Seven-week-old male C57BL/6J mice, purchased from Kiwa Laboratory Animals
(Wakayama, Japan), were first acclimated to the lab environment for a week
(temperature controlled at 23 °C with 12 hr light/12 hr dark cycle and fed with normal
chow). They were then acclimated to a motorized treadmill (Natsume, Kyoto, Japan) for
approximately 10 min. After another one week, mice were randomly assigned into five
different groups: no exercise (n = 6), immediately after exercise (n = 6), post 1 hr of
exercise (n = 6), post 2 hr of exercise (n = 6), and post 4 hr of exercise (n = 6). The
exercise group mice underwent treadmill running at 20 m/min for 1 hr. To accurately
identify where ribosome is located on mRNA, a translational inhibitor, cycloheximide,
was used to stall the movement of ribosomes. At the indicated time points, under
isoflurane anesthesia, 5 µl of 50 mg/ml cycloheximide (Sigma, St. Louis, MO) in PBS
was injected into right gastrocnemius of all the mice (aged 9 to 10 weeks) and the right
gastrocnemius was immediately harvested, followed by brief wash in 100 μg/ml
cycloheximide in PBS and flash-frozen in liquid nitrogen. The cycloheximide-treated
samples were further processed for mRNA-Seq and ribosome profiling as described
below. Left gastrocnemius was harvested for western blotting and real time qPCR
analyses. All the animal experiments were approved by the Institutional Animal Care
and Use Committee at Waseda University (approval number: 2014-A085) in accordance
with the guidelines of Ministry of Education, Culture, Sports, Science and Technology of
Japan for animal experimentation at research institutes.
Total RNA extraction for mRNA-Seq and ribosome profiling.
The right gastrocnemius was homogenized in 1.2 ml of ice-cold lysis buffer [20 mM
Tris HCl pH7.4, 150 mM NaCl, 5mM MgCl2, 1 mM DTT, 100 µg/mL cycloheximide
(Sigma), TURBO DNase I 25 U/mL (Ambion, Life Technologies, Carlsbad, CA), and
1% Triton X-100 (Sigma)], followed by centrifugation at 15,000 g for 10 min at 4 °C.
Supernatant from the lysate was separated in two 600 µl aliquots; one for mRNA-Seq
and the other for ribosome profiling. Three sets of 100 µl of the aliquot from 3 individual
mice were combined together to create 1 biological replicate (i.e., 1 biological replicate
was composed of 3 different mice both in mRNA-Seq and ribosome profiling).
RNA fragmentation for mRNA-Seq
Extracted total RNA was purified by miRNeasy Mini Kit (Qiagen, Hilden, Germany),
followed by poly(A) RNA extraction by Dynabeads mRNA DIRECT Micro Kit
(Ambion). For fragmentation, purified mRNA was mixed with 2x alkaline buffer (90mM
NaHCO3, 10mM Na2CO3, 2mM EDTA) and incubated at 80°C for 15 min. The reaction
was stopped by adding ice-cold solution (48.5µl RNase-free water, 1.5µl GlycoBlue
(Ambion), and 10µl 3M NaOAc), followed by 150µl isopropanol and precipitated by
standard protocols.
Monosome extraction for ribosome profiling
To extract the mRNA regions that were protected by ribosomes (i.e., mRNA fragments
under translation), total RNA lysate 300µl was mixed with 15µl RNase If (New England
Biolabs, Beverly, MA) and incubated for 45 min at room temperature to digest the
mRNA regions that were not protected by ribosome. Reaction was halted by 10µl
SUPERase·In (Ambion). To extract monosome with ribosome-protected mRNA
fragments (RPF), digested sample was loaded onto sucrose cushion buffer (34% sucrose,
20mM TrisHCl, 150mM NaCl, 5mM MgCl2, 1mM DTT, 100µg/ml cycloheximide, and
20U/ml SUPERase·In) with 1:3 ratio in a polycarbonate centrifuge tube (Beckman
Coulter, Palo Alto, CA), followed by centrifuge for 4hr at 400,000xg, 4°C in MLA130
rotor (Beckman Coulter). Pellet was purified by miRNeasy Mini Kit and then precipitated
by standard isopropanol precipitation protocols.
Size selection of fragmented mRNA and RPF
Purified RNA samples, small RNA II Marker (Funakoshi, Tokyo, Japan), and
synthesized oligo (Both 3’ ends were phosphorylated and both 5’ ends were
dephosphorylated. upper: 5’-AUGUACACGGAGUCGAGCUCAACCCGCAACGA,
lower: 3’-AUGUACACGGAGUCGACCCGCAACGA) (Greiner, Tokyo, Japan) were
each mixed with 2x Novex TBE-Urea sample buffer (Invitrogen, Life Technologies,
Carlsbad, CA) and denatured at 80°C for 90 sec. Samples were then loaded on a
denaturing 15% polyacrylamide TBE-urea gel (Invitrogen) and run for 65 min, followed
by SYBR Gold (Invitrogen) staining for 5 min. The gel regions of 26~32 nucleotides
(nt) were excised for RPF recovery. The gel regions of 25~45 nt for fragmented mRNA
were excised. Size-selected gel was disrupted and incubated in 360µl RNase-free water
at 70°C for 10 min. All liquid and gel were transferred into a Spin-X column (Corning,
NY) and centrifuged for 2 min at full speed, followed by standard isopropanol
precipitation protocols.
ribosomal RNA (rRNA) removal, 5′ phosphorylation, and 3′ dephosphorylation from RPF.
RiboMinus (Invitrogen, Life Technologies, Carlsbad, CA) was used to remove rRNA
from RPF samples. For both fragmented mRNA and rRNA-deleted RPF, 5′
phosphorylation and 3′ dephosphorylation were carried out. The 3′ ends were first
dephosphorylated at 37°C for 60 min in reaction mixture [10 U/µl T4 polynucleotide
kinase (New England Biolabs, Beverly, MA), T4 polynucleotide kinase buffer without
ATP, and 20 U/µl SUPERase·In (Ambion)], immediately followed by 5′ phosphorylation
for 30 min in the presence of 1 mM ATP (New England Biolabs) and then RNA was
participated.
Sequence library preparation, sequencing, and alignment.
I prepared sequence library using Ion Total RNA-Seq Kit v2 (Ion Torrent, Life
Technologies, Carlsbad, CA) according to the manufacturer’s protocols except that
reverse-transcribed cDNA was gel-purified to remove excess primer dimers. The region
(approximately 63 nt) was excised and recovered by the same protocols as described
above. Sequencing was carried out using Ion PGM Template OT2 200 Kit, Ion PGM
sequencer, Ion PGMSequencing 200 Kit v2, and Ion 318 Chip Kit v2, according to the
manufacturer’s instructions (Ion Torrent). Base-calling and alignment were conducted
using the built-in Ion torrent software (V4.0.1) and the reads shorter than 24 nt were
removed. Sequenced reads were mapped and aligned to coding DNA sequences extended
to 25 nt upstream of translational start site of each gene, retrieved from GRCm38 using
Biomart MartView (http://www.biomart.org/biomart/martview) (61). As for reads with
multiple hit, the best hit was aligned. All the figures and statistics below were created by
the R software, if not otherwise specified.
Reproducibility and validity of sequencing.
To compare the reproducibility of two independent biological replicates, aligned read
counts were normalized by total read count (RPM: Reads Per Million). For validation of
ribosome profiling, triplet periodicity was confirmed. For each gene, 5´ end position of
aligned reads was categorized into 0, -1, or +1 relative position to the main coding
frame and the ratios of each frame were calculated.
To determine minimum threshold of read counts for robust statistical analysis, read
counts of one replicate were divided by total read counts composed of both replicates to
calculate the fraction of one replicate. In a case of perfect reproducibility, the fraction
would be 0.5. Based on average read counts, genes were binned and SD of the fraction
was computed for each bin. The SD was predicted using binominal partitioning of the
read counts. The minimum read count, 125 RPM, was selected because variation
between biological replicates becomes stably larger than that predicted from counting
statistics approximately from 125 RPM.
Sequenced data analysis.
Focusing on 1011 genes (> 125 RPM), principal component analysis was carried out.
I plotted PC1 and PC3, well representing the differences between the profiles of
transcription/translation and no exercise/exercise, respectively. To detect differentially
regulated genes at transcriptional and translational levels, edgeR was used with TMM
normalization (62, 63). For the differentially regulated genes, pathway enrichment
analysis was conducted using InnateDB (64) with hypergeometric algorithm and
Benjamini Hochberg P-value correction where only the pathways in KEGG (65) were
focused. As for the known TOP motif genes, I focused only on highly expressed genes
(> 125 RPM). Translational efficiency was obtained by dividing normalized RPF counts
by normalized mRNA-Seq counts. Kolmogorov-Smirnov test was used for statistics.
Real time qPCR and western blotting.
Total RNA was extracted using TRIzol (Invitrogen), followed by cDNA synthesis
using High Capacity cDNA Reverse Transcription Kit (Applied Biosystems, Life
Technologies, Carlsbad, CA) according to manufacturer’s instruction. Solute carrier
family 25 (mitochondrial carrier; phosphate carrier), member 25 (Slc25a25) gene
expression was determined using SYBR Green (Applied Biosystems) with primers of
Slc25a25, Matrix metalloproteinase-2 (Mmp2), Nuclear Factor (erythroid-deived 2)-like
2 (Nrf2), Atrogin1, Muscle RING-Finger Protein-1 (MuRF1), Peptidase mitochondrial
processing alpha (Pmpca), YME1-like 1 ATPase (Yme1l1), and IMP2 inner
mitochondrial membrane peptidase-like (Immp2l) was used. Protein was extracted
using PARIS kit (Ambion) supplemented with protease inhibitor cocktails (Thermo
Fisher Scientific, Life Technologies, Carlsbad, CA) according to manufacturer’s
instruction. For western blotting, 5 µg of total protein was loaded into 4-12 % Bis-Tris
precast polyacrylamide gel (Thermo Fisher Scientific), followed by electrophoresis and
transferring to PVDM membrane using iBlot 2 system (Thermo Fisher Scientific).
Anti-SLC25A25 (GeneTex, Irvine, CA) and anti-GAPDH (Cell Signaling, Danvers,
MA) for internal control were used and ECL (GE Healthcare, Pittsburgh, PA) was used
for detection. The experiments were repeated to confirm the reproducibility. As for
statistics, one-way ANOVA with Tukey was used. Using the expression levels of real
time qPCR and western blotting, Pearson correlations were calculated between
Slc25a25 protein abundance and other gene expressions. The correlation patterns were
visualized by Cytoscape (66). I then carried out multiple linear regression analysis using
the expressions in the groups: no exercise, immediately after exercise, and post 1 hr of
exercise, in which all the genes were initially included to validate the model and then
the least significant gene was removed repeatedly at each validation (i.e., Slc25a25
mRNA, Atrogin1, MuRF1, and Yme1l1 were removed).
II-ii. Genome-wide Analysis of Translational Regulation: Alternative Translation
Accession number
The sequenced and processed data used in the current analysis of RAW264
macrophages have been deposited in the National Centre for Biotechnology
Information’s Gene Expression Omnibus under the accession number GSE60930. The
following analysis was carried out using in-house R scripts. As for the data of mouse
skeletal muscle, the same datasets described above were used.
Cell culture
RAW 264 cells (DS Pharma Biomedical, Osaka, Japan) were cultured at 3.0 × 10⁵
cells/mL in media (DMEM, 2 mM Glutamine, 10% FBS, 100 units penicillin and 100 µg
streptomycin/mL) 24 h prior to harvest. The confluency of cells was confirmed to never
exceed 80%–90%. Two independent biological replicates for both ribosome profiling
and mRNA-Seq were prepared. Sequence library preparation steps for both RAW264
and mouse skeletal muscle were carried out as described above. To induce acute
inflammation in RAW264, 100 ng/ml of lipopolysaccharide (LPS) was added into
media for 30 min.
Detection of N-terminal extension/truncation and translational frameshift
To identify alternative translation, an in-house analytical pipeline was created. For a
robust analysis, I focused only on highly translated transcripts, at least 1,000 RPK
(aligned reads per kb in a transcript). The aligned read positions in a reference gene and
the corresponding annotated CDS start/stop positions of the gene were combined into
one data file. The aligned read positions were allocated into one of three coding frames,
namely frame0, frame1, and frame2. Aligned read numbers and positions in each coding
frame were plotted as well as the annotated CDS position. Visually inspecting the
aligned read distributions and annotated CDS positions made it possible to identify
translational isoforms, including N-terminal extensions/truncations, uORFs, and
frameshifts.
Western blotting
To confirm the presence of RAC2 translational isoforms, western blotting was
conducted with anti-RAC2 antibody (Abcam, Cambridge, UK). Importantly, the epitope
of the RAC2 antibody (Abcam) was located at the C-terminal of RAC2 protein.
Because the newly identified RAC2 alternative translations were distinguished by the
N-terminal truncation, the C-terminal-specific antibody is able to detect both isoforms.
Western blotting was carried out as described above.
II-iii. Genome-wide Analysis of Translational Regulation: Dynamic Change in Translation Speed of Ribosomes
Validation of Binary Counts
After sequencing and aligning the sequenced reads to the reference genome, I
obtained the 5´ end positions relative to the start site in each gene. To normalize inter-
and intra-gene bias, I removed identical 5´ end positions in each gene and converted its
read counts into “1” count. The processed read count was named as “binary” count
because each base position in a gene takes only “0” or “1” read counts after the binary
conversion. To validate the binary approach, cumulated coefficient variations (CV) for
the main coding frame of RPF counts were calculated using all the detected genes.
CVaccum.: accumulated coefficient variation
L: length of genes k: position of genes
Kolmogorov-Smirnov test was used to compare CV before and after applying binary
density approach.
TAC site and translational stall detection by metagene analysis
To examine the effect of single residue of interest on translation speed, I defined
sequence windows for the genome-wide metagene analysis similarly used in a previous
study (41). In the sequence windows, there is only one amino acid of interest encoded.
Importantly, there is no additional residue of interest encoded in the 10 codons 5´ side
of the residue and similarly no extra residue of interest in the 25 codons 3´ side of the
residue. For example, when the effect of Glu residue on translation speed was examined,
I focused on the reference sequences encoding single Glu residue and there was no extra
Glu codon in 10 codons (30 nt) 5´ side of the target Glu as well as no additional Glu
codon in 25 codons (75 nt) 3´ side. The length, 10 codons, is roughly equal to the width
of ribosomal complex (67). Given the length of exit tunnel (100 Å) and single residue
(3.35 Å in length) (43, 68, 69), the 35 codons length (10 + 25 codons) indicates the
approximate distance from the entry of the ribosomal complex to the end of the exit
tunnel, which allows the presence of only single residue of interest (e.g., Glu) in the
ribosome. This can avoid the possible effect of the repeated occurrence of multiple Glu
residues. After finding such sequence windows genome-wide for Glu, relative position
(nt) to the Glu codons was assigned to each 5´ end of the aligned reads. I counted up the
number of the identical 5´ relative positions genome-wide for ribosome profiling and
mRNA-Seq and then divided the summed RPF counts by the counts from mRNA-Seq
to calculate and normalize the ribosome density at every single base position. If Glu
slows translation speed at a specific site in ribosomal complex, the stalled ribosome is
more likely to be captured as RPF in sequence windows. When all the genome-wide
sequence windows are piled up, the base position with higher likelihood of producing
RPF stochastically results in a higher ribosomal density peak compared to those in other
positions, which indicates translational stalling.
Differentially Regulated Translational Stall and Trypsin Assay
Similarly, to identify translational stalls induced by a codon, I conducted a metagene
analysis for 61 codons and additionally analyzed dynamics of the stalls derived from
inflammatory and exercise stimuli. Differentially regulated translational stalls were
identified by Student’s t-test (P < 0.05 and FDR < 0.1) and absolute Z score differences
(> 1.5). Absolute Z score differences were calculated as following: Z score difference =
| ZStm codon – ZBsl codon | (Stm: inflammatory or exercise stimuli, Bsl: basal, codon: codon
of interest). After trypsin assay, in which 2.5 μg of total protein was digested by 0, 10,
20, or 30 ng/μl of trypsin (Sigma) at room temperature for 30 min, western blot was
carried out with anti-Calreticulin (Abcam) and anti-GAPDH (Cell Signaling) to confirm
the effect of decreased translational stalls in Calreticulin with negative control GAPDH
in which much less translational dynamics was observed.
II-iv. Genome-wide Analysis: Gene Co-expression Network Analysis
Data Collection and Pre-processing
All the microarray raw data of human mRNA expression analyses was collected from
the National Centre for Biotechnology Information’s Gene Expression Omnibus. I first
screened 40 microarray datasets. To minimize the bias induced by batch effect, I mainly
focused on the data generated by Affymetrix platforms because most of the exercise
studies have been carried out by Affymetrix platforms (21 datasets). I also removed the
datasets that lacked in clear description of samples and narrowed down to 5 datasets that
suited for the current research design (database IDs: GSE1140, GSE28422, GSE45426,
GSE51837, and GSE59088). Two studies examined blood cells after acute endurance
exercise (immediate after and post 1hr). One study was for vastus lateralis (VL) after
acute endurance exercise (post 2.5hr and 5hr). Another study was for VL after acute
resistance exercise (post 4hr). The last study was for VL after acute resistance exercise
(post 24hr), in which subjects underwent resistance exercise in day 1 and day 3,
followed by sample collection in day 2 (here named as 24hr day2) and day 4 (named as
24hr day4).
For normalization, summarization, and removal of batch effect, frozen Robast
Multiarray Analysis (fRMA) (70) with quantile normalization and robust weighted
average summarization was applied to cel raw files, followed by ComBat (71) when
multiple batches were used (i.e., PBMC datasets). Probes that failed to correspond to
unique official gene symbol were filtered out. Log-transformed expression values were
further filtered by mean expression and the median expression values were selected
from the same gene IDs derived from different probes.
Weighted Gene Co-expression Network Analysis (WGCNA)
To construct gene co-expression network, WGCNA (47) was used with in-house R
scripts. An adjacency matrix was created by calculating the pairwise gene expression
correlation across samples. It is important to confirm that the calculated network
displays approximate scale-free topology (72). To this end, an adjacency function
parameter that leads to sufficient scale free topology fit (R2 > 0.8) was selected based on
the result of the pickSoftThreshold function (57). We focused on scale free topology fit
values rather than exponentially truncated power law in which 2 parameters are
involved and often results in overfitting irrespective of the adjacency function (57).
To identify the modules in which highly co-expressed genes were grouped, average
linkage hierarchical clustering based on topological overlap matrix and dynamic hybrid
tree cutting algorithm were applied (122). The highly correlated modules (correlation of
eigengene: r > 0.90 for PBMC, r > 0.85 for acute resistance post 4hr) were merged.
Notably, despite that there were two time points in acute endurance exercise (pre/post
2.5hr and 5hr), I considered them as one time point (i.e., combined GS values and kME
was not affected) because gene expression patterns were almost undistinguishable
between post 2.5hr and 5hr.
Network Visualization
For gene co-expression network visualization, I used the modules that showed
significant correlation (p < 0.05) to exercise traits (either Pre-0min, Pre-1hr, or
0min-1hr) both at eigengene and module levels and also showed significant pathway
enrichment in InnateDB (64) with hypergeometric algorithm and Benjamini Hochberg
P-value correction in which pathways in KEGG (123) were only focused. Top 1000
strongest edges for each selected module (blue, green, magenta, red, turquoise) were
then visualized by Cytoscape (124).
Module Preservation Analysis
Different preservation status was determined based on Zsummary (strong preservation:
Zsummary > 10, moderate preservation: 6 < Zsummary < 10, weak preservation: 2 < Zsummary
< 6, no preservation: Zsummary < 2). Z score-based analysis measures to what extent the
observed network differs compared with the randomly sampled background network.
Zsummary is the combined statistics of Zdensity and Zconnectivity. Zdensity measures whether the
network module is denser than randomly sampled background, whereas Zconnectivity
examines whether hub gene status in the module is preserved between the reference and
the test network. However, Zsummary is often affected by module size. To avoid such bias,
I also took into account of medinRank preservation, which measures relative
preservation in the module and independent of the module size.
Hub Gene Preservation
To investigate hub gene dynamics, three different hub gene groups were selected.
There were: 1) hub genes in the most preserved module (turquoise in PBMC), 2) hub
genes in the least preserved module (magenta in PBMC), and 3) least hub genes in any
module of PBMC. To select the hub genes in the turquoise module, genes with kME >
0.8 and GS > 0.5 were first selected. The genes were ranked by the order of the absolute
values of GS multiplied by kME. Top 20 genes were then selected as hub genes. To
select hub genes in the magenta module, genes with kME > 0.7 and GS > 0.5 were first
selected. Because the magenta module is much smaller than the turquoise module in
size, all the genes (13 genes) that met the criteria were selected as hub genes. The least
hub genes indicate the genes with GS < 0.1 and kME < 0.3 to any module in PBMC (n
= 284, that still remained connected to a gene in other conditions).
To examine the status of these selected genes in skeletal muscle, the GS and kME
values of these genes in a skeletal muscle condition were bi-plotted. Differently from
the connectivity preservation analysis (i.e., Zconnectivity) which measured whether hub
gene status (connectivity to the same module members) in a specific module is
preserved in another condition, here I focused on the highest kME, each selected gene
has irrespective of the module members in the reference network (e.g., turquoise
module members in PBMC). This allows us to investigate whether the genes playing a
role as a hub in one condition are naturally hub whatever the condition is or are nurtured
hub depending on conditions. As for statistics, ANOVA with TukeyHSD was used.
Preservation analysis within Green Module Network in Acute Resistance Exercise (Post 4hr)
The genes registered in three KEGG pathways (TGF signaling, Insulin signaling, and
MAPK signaling) were obtained from KEGG database (65). Two distinct networks, one
preserved between acute resistance exercise (post 4hr) and acute resistance exercise
(post 24hr) and the other preserved between acute resistance exercise (post 4hr) and
acute endurance exercise (post 2.5hr and 5hr), were detected based on: 1) the two node
genes of an edge were both present in the three KEGG pathway genes and 2) the edge
was commonly observed in both of the conditions. The networks were visualized by
Cytoscape (124).
The sub-network (TNFRSF1A, MYC, IL1R1, GADD45A, GADD45B, GADD45G,
CRK, and NR4A1) preserved between acute resistance exercise (post 4hr) and acute
resistance exercise (post 24hr) was focused and the connected genes to the sub-network
in acute resistance exercise (post 24hr) was examined. Top 500 strongest edges were
visualized by Cytoscape (124). Focusing on absolute GS values of the genes associated
with the top 500 strongest edges, Kolmogorov-Smirnov test was used to compare the
difference of GS values between acute resistance exercise (post 24hr, day2) and (post
24hr, day4).
III. RESULTS AND DISCUSSION
III-i Modification and Application of Ribosome Profiling to Investigate the Translational Regulation in Mouse Working Muscle
RESULTS
Modification of Ribosome Profiling Using Cultured Cells
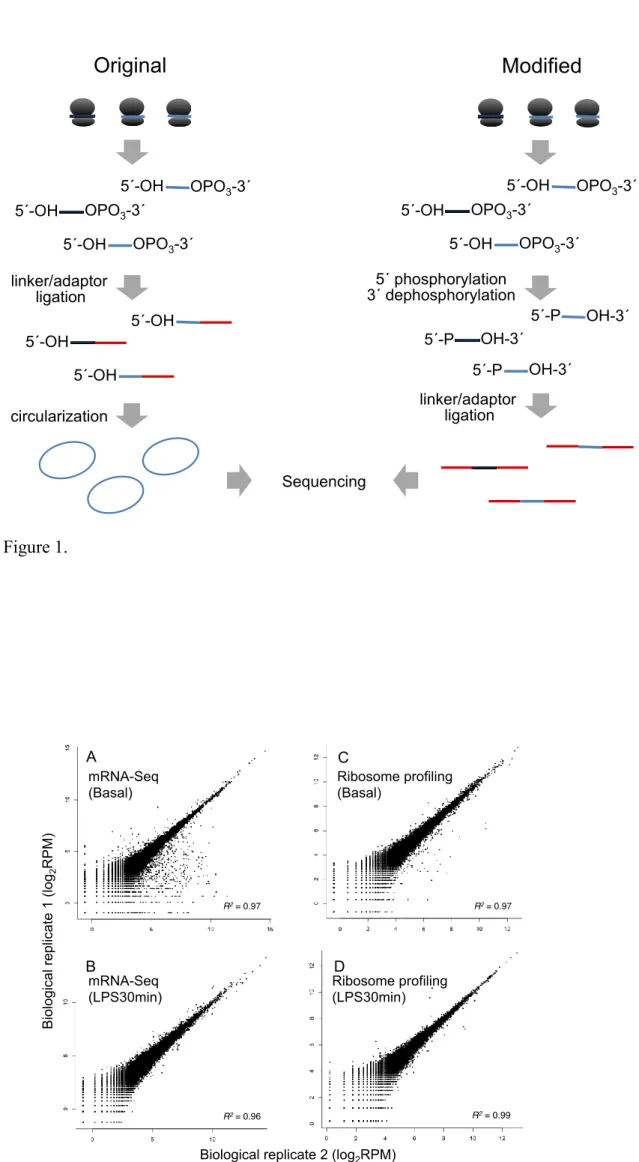
I modified the original ribosome profiling protocols (8, 67) to best suit for the
sequencing library preparation protocols for Ion PGM next gnegation sequencer. In the
original protocols, extracted RPF undergo 3´ dephosphorylation, linker/adaptor ligation,
and circularization for PCR amplification (Figure 1). However, the sequence library
preparation for Ion PGM sequencer requires adaptor ligations at both ends (3´ and 5´) of
the insert without circularization. Therefore, I conducted 3´ dephosphorylation and 5´
phosphorylation simultaneously (Figure 1, details are described in the Materials and
Methods).
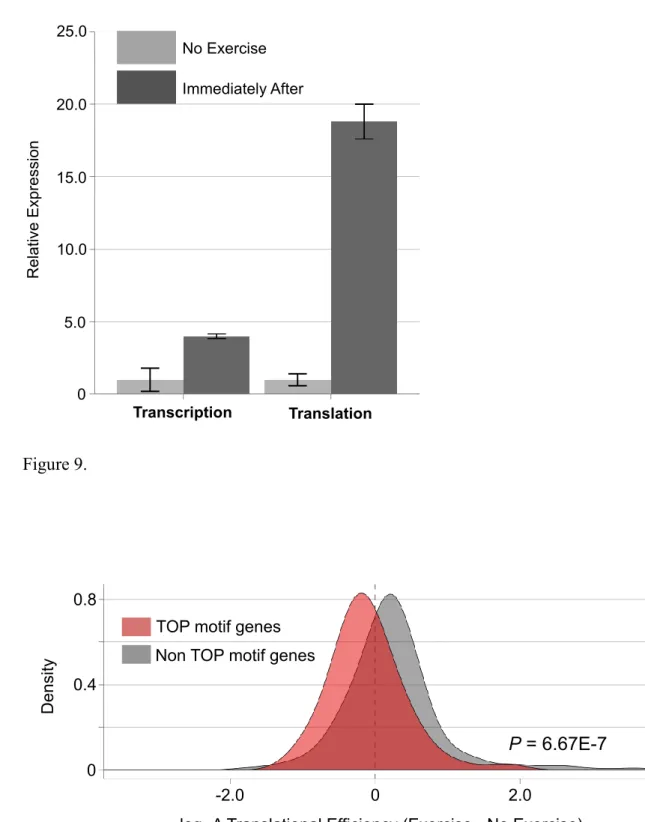
To confirm that the modified protocols can capture ribosome footprints, RAW264
macrophages were first used as an experimental model. As a control of ribosome
profiling, standard mRNA-Seq was also carried out. The results showed highly
reproducible sequenced read counts both in mRNA-Seq and ribosome profiling (Figure
2). Pearson correlations of two independent biological replicates in mRNA-Seq were R2
= 0.97 and R2 = 0.96, in basal and LPS-stimulated conditions, respectively (Figure
2A,B). In ribosome profiling, two independent biological replicates exhibited high
reproducibility, R2 = 0.97 and R2 = 0.99, in basal and LPS-stimulated conditions,
respectively (Figure 2C,D). Importantly, ribosome profiling shows unique features,
called triplet periodicity that is not observed in mRNA-Seq (8, 67). In the current study,
striking triplet periodicity of sequenced reads was found only in ribosome profiling, but
not in mRNA-Seq (Figure 3), clearly indicating that the modified ribosome profiling
successfully obtained the dynamics of translating ribosomes.
Application of the Modified Ribosome Profiling to Mouse Skeletal Muscle
I next applied the modified ribosome profiling and a standard mRNA-Seq to mouse
working muscle to investigate the effect of acute endurance exercise on the translational
regulation in gastrocnemius. Similarly to RAW264, high reproducibility was observed
in skeletal muscle under both of the conditions, basal resting condition (Basal) and
immediately after acute endurance running (Exercise). The Pearson correlations of
mRNA-Seq were R2 = 0.98 and R2 = 0.97 in Basal and Exercise, respectively (Figure
4A,B). Those in ribosome profiling were R2 = 0.95 and R2 = 0.84 in Basal and Exercise,
respectively (Figure 4C,D). Critically, footprints of ribosomes exhibited unambiguous
triplet periodicity only in ribosome profiling, but not in mRNA-Seq (Figure 5),
indicative of successful capture of the ribosomal profiles of mouse skeletal muscle in
Basal and Exercise.
I next determined a minimum expression threshold for the reliable and robust
quantification of transcription and translation. The threshold can be determined by
measuring the reproducibility of the independent biological replicates in ribosome
profiling and comparing the variation with that predicted by counting statistics (8, 73)
(Figure 6). As for the genes with less aligned reads, leading to lower statistical power,
the variation predicted from binominal partitioning dominated the variation seen in the
biological inter-replicates (i.e., the variations predicted by counting statistics and in the
inter-replicates were similar) (Figure 6). On the other hand, when sufficient amount of
sequenced reads was available (> 125 RPM), the effect of binomial partitioning
weakened and the variation in the inter-replicates was larger than that from counting
statistics (i.e., other sources of variation, such as biological differences, became larger)
(Figure 6). Therefore, to avoid the major effect of counting errors, an expression
threshold, 125 RPM, was selected for downstream analyses.
Targeting the genes more than 125 RPM (n = 1,011), principal component analysis
was conducted to examine the global characteristics of transcriptional and translational
profiles (Figure 7). There were striking differences observed between transcription and
translation as well as Basal and Exercise. Interestingly, clear distinction between
transcriptional and translational profiles was found even in Basal as well as Exercise,
suggesting that majority of translation and transcription can be regulated separately
under both conditions
To narrow down the focus from a global view to individual genes, I identified
differentially expressed genes at transcriptional and translational levels. To this end, I
normalized transcriptional and translational expression values using a statistical model,
in which a negative binomial distribution of sequenced read counts is estimated, and
further adjusted the expression bias by applying Trimmed Mean of M (TMM)
adjustment (63) (Figure 8). Acute endurance exercise induced differential expression (P
< 0.01) in 26 and 37 genes at transcriptional and translational levels, respectively.
Focusing on these genes, pathway enrichment analysis showed the statistically
significant enrichments in the pathway associated with amino acid metabolism both in
transcription and translation (Table 1,2). In translation but not in transcription,
enrichments were found in the pathways related to innate immunity, generic
transcription, ion channel transport, phagosome, and glucose metabolism (Table 1, 2).
From the differentially translated genes, I further focused on Slc25a25, a
mitochondrial protein residing on the mitochondrial inner membrane and having a
critical role in maintaining ATP homeostasis (74, 75). This is due to the facts: 1)
Slc25a25 is one of the most differentially regulated genes at translational level, 2)
Transcriptional and translational profiles of Slc25a25 showed a significant difference, 3)
Mice without Slc25a25 gene decreases endurance performance during treadmill running
(76), and 4) The effect of exercise, both endurance and resistance exercise, on Slc25a25
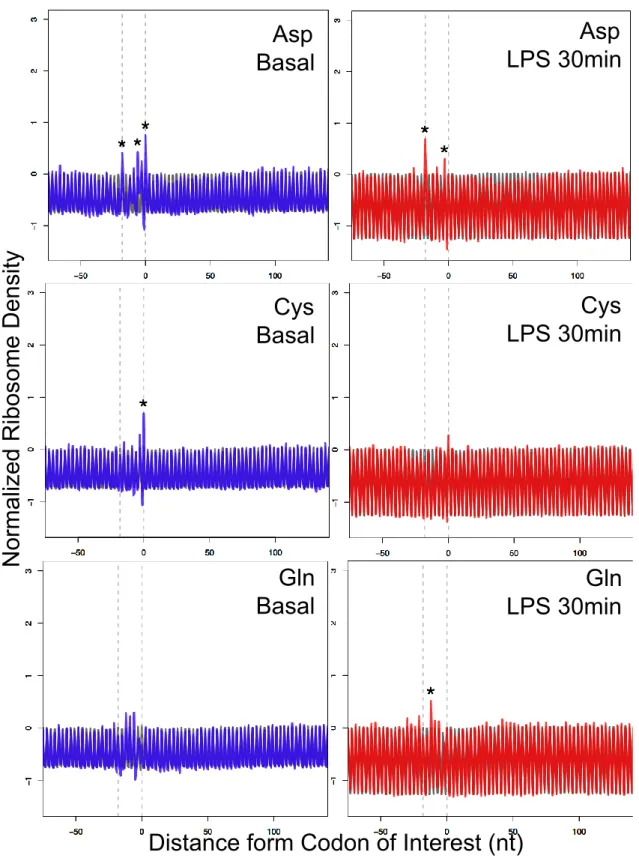
expression has never been studied. Although mRNA-Seq showed a moderate increase in
Slc25a25 mRNA by approximately 4 fold, ribosome profiling exhibited a much greater
raise in translation by approximately 18 fold (Figure 9). These results suggest that acute
endurance exercise in mouse can regulate Slc25a25 abundance predominantly by
translational regulation rather than that of transcription.
The mTOR signaling cascade is widely recognized as a translational regulator.
Activation of mTOR cascade can promote translational initiation and therefore increase
translation levels. Given this, one possible speculation is that Slc25a25 translational
up-regulation is mediated by mTOR even though previous studies have reported the
suppressive effect of endurance exercise on mTOR signaling. To see whether the effect
of endurance exercise on mTOR was negative or positive for translation, I focused on
TOP motif mRNA. TOP motif is represented by pyrimidine rich sequences immediately
after the 5´ cap of mRNA (77) and the TOP motif mRNAs were functionally enriched in
ribosome/translation (Table 3). It is known that TOP motif mRNAs are highly prone to
mTOR inhibition and easily loose the translational efficiency (77). Thus, analyzing the
translational changes in TOP motif mRNAs make it possible to infer whether mTOR
signaling is suppressed and has a negative impact on translational efficiency. In the
current study, the translation levels of known TOP motif genes decreased comparing
with that in the other genes (Figure 10). This result agrees with the previous studies
reporting the endurance exercise-induced decrease in overall protein synthesis (21, 78).
Considering the result and that Slc25a25 mRNA does not contain TOP motif, the
promoted Slc25a25 translation could be mediated by other factors rather than mTOR
signaling cascade.
Because the extent in the increase of Slc25a25 translation exceeded that in the
transcription, the extent in the raise of Slc25a25 protein abundance would be much
greater than that predicted by its transcriptional regulation. To confirm that Slc25a25
protein abundance is predominantly regulated by translation level rather than
transcription, I used western blotting and quantitative real time PCR to measure
Slc25a25 protein and transcript levels, respectively (Figure 11). Intriguingly, minor
increase (approximately 2 fold increase) was observed in Slc25a25 protein abundance
immediately after and post 1 hr of exercise compared with those in translation
(approximately 18 fold increase immediately after exercise) and transcription (roughly 7
fold and 4 fold increases in immediately after exercise and post 1 hr of exercise,
respectively). These results imply the influence of post-translational regulation, such as
protein degradation.
To explain the difference between the translation and protein levels, key players of
post-translational regulation, especially protein degradation, were examined. Atrogin1
and MuRF1, well-recognized regulators in muscle protein degradation, were examined.
Mmp2 and Nrf2 have been known as critical players in cation-mediated proteolysis and
proteasome-mediated protein degradation, respectively (79, 80). Given that Slc25a25
protein is a mitochondrial protein, genes regulating proteolysis in mitochondrial,
Yme1l1, Immp2l, and Pmpca, were also investigated. Yme1l1 is located in
mitochondrial inner membrane and functions as ATP-dependent protease. Immp2l and
Pmpca are both responsible for presequence cleavage, though Immp2l is present in
inner membrane and Pmpca is found in mitochondrial matrix (81). I observed that a
single bout of exercise immediately increased expression of Nrf2 (approximately 3 fold
increase) at statistically significant level and Mmp2 (approximately 2 fold increase) not
statistically significant, though Atrogin1 and MuRF1 showed decreased tendencies but
not at statistically significant levels (Figure 12). Although the mitochondrial genes,
Immp2l, significantly decreased its expression at 1 hr after exercise, the expressions of
Pmpca and Yme1l1 increased at 2 hr post exercise (Figure 12).
To further examine the association strength among Mmp2, Nrf2, Slc25a25 mRNA,
Atrogin1, MuRF1, Immp2l, Pmpca, Yme1l1 and Slc25a25 protein, I conducted a
correlation analysis and multiple regression analysis (Figure 13). Interestingly,
contribution of Slc25a25 mRNA to Slc25a25 protein abundance was weak throughout
the 3 different time points (Figure 13). On the other hand, multiple regression analysis
suggested that Nrf2 and Immp2l had negative effects on Slc25a25 protein abundance,
though Pmpca was positively associated with Slc25a25 protein abundance (Figure 13)
DISCUSSION
I conducted a genome-wide translational analysis using ribosome profiling to
investigate the effect of acute endurance exercise on mouse gastrocnemius. However,
there are some limitations in the current studies. One is that we could measure the