2016 年熊本地震の余震の確率予測
Probability aftershock forecasting of the M6.5 and M7.3 Kumamoto earthquakes of 2016
東京大学生産技術研究所 統計数理研究所 東京大学地震研究所 Institute of Industrial Science, University of Tokyo
The Institute of Statistical Mathematics Earthquake Research Institute, University of Tokyo
現在,余震の確率は調査委員会の報告書1)「余震の確率評価手法について」に基づいて計算 され気象庁で予報業務が行われているが,本震直後に対応するため,本震直後の不完全かつ不 均質なデータに対応した余震の検出率の時間変動を考慮して,大森・宇津の余震減衰則や Gutenberg-Richter 則のパラメータを推定する統計手法を提案した2)。この方法により,2016 年 4 月の M6.5 熊本地震の余震(第 1 図)及び引き続く M7.3 の余震確率分布(第 2 図)を,それ ぞれ本震後3時間から,リアルタイムで良く予測できる事を示した。また活発な余震活動を呈 した 2003 年新潟県中越地震(M6.8)の余震系列のレトロスペクティブな確率予測を再計算し た(第 3 図)。 さらに,M7.3 熊本地方の地震の余震の見通しのため最初の 1 日の観測を基にリアルタイムに 一ヶ月先までの中期予測3)を示した(第 4 図)。また CSEP 日本検証センターに登録中の HIST-ETAS モデル4)の M4 以上の余震に関する短期時空間確率予測(第 5 図)を示した。 本解析に関して気象庁一元化震源データ,防災科技研 Hi-net データを使用した。 (近江崇宏,尾形良彦,鶴岡弘,合原一幸) 文献. 1) 地震調査委員会 (1998) http://www.jishin.go.jp/main/yoshin2/yoshin2.htm 2) 東大生産研究所・統計数理研究所 (2014a) 連絡会報 91 (3-2), 66. 3) 東大生産研究所・統計数理研究所 (2014b) 連絡会報 92 (11-2), 386 4) 統計数理研究所(2010)連絡会報 83 (1-2), 5.
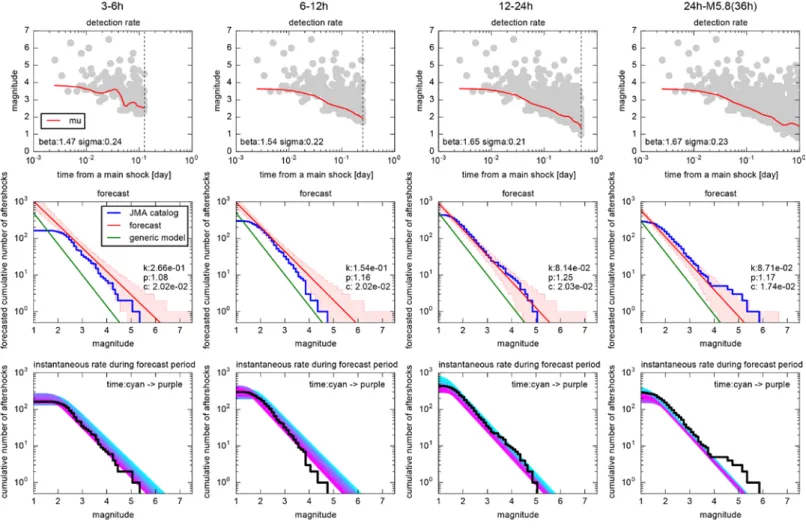
第1図. 2016/04/14 の熊本の地震(M6.5,前震)後の本震発生までの地震活動の確率予測。予測モデルとし て大森・宇津則と Gutenberg-Richter 則を用い,Hi-net 自動処理震源カタログを用いてパラメータの推定を行 った。一番上のパネルはそれぞれの学習期間における余震検出率の推定を表している。真ん中のパネルは予 測結果(赤色)と実際の観測値(黒:Hi-net カタログ,青:JMA カタログ)を比べている。参考のために 日本の余震活動の平均的なパラメータ値を用いた予測結果(緑)も示した。一番下のパネルは予測期間にお ける瞬間発生率の時間の変化をプロットしたものである。色は時間を表しており,シアンから紫へと時間が 経過する。
Fig. 1. Probabilistic earthquake forecasting after the Kumamoto M6.5 (14/04/2016) earthquake until the occurrence of the main shock (M7.3). We use the Omori-Utsu and Gutenberg-Richter models for our forecasts, and their parameters are estimated from the Hi-net automatic hypocenter catalog. The top panels show the estimate of the detection rate of aftershocks during respective learning periods. The middle panels show our forecasts (red) compared with the actual observation (black: Hi-net catalog, blue: JMA catalog). The forecast using the generic model that represents standard aftershock activity in Japan is also plotted as a green line as a reference. The bottom panels show the time variation of the instantaneous occurrence rate during each forecast period. The color of the line represents the time and the time evolves from cyan to purple.
第2図. 2016/04/16 の熊本の地震(M7.3,本震)後の余震活動の確率予測。図の様式は第一図と同じ。 Fig. 2. Probabilistic after forecasting after the Kumamoto M7.3 (16/04/2016) main shock.
第3図. 2003 年新潟県中越地震(M6.8)後の余震活動の確率予測。図の様式は第一図と同じ。ただしここでは 予測は JMA カタログを用いて行われている。
Fig. 3. Probabilistic after forecasting after the 2003 Chuetsu earthquake (M6.8). A format is the same as the Fig. 1. Here the forecasts are prepared based on the JMA catalog.
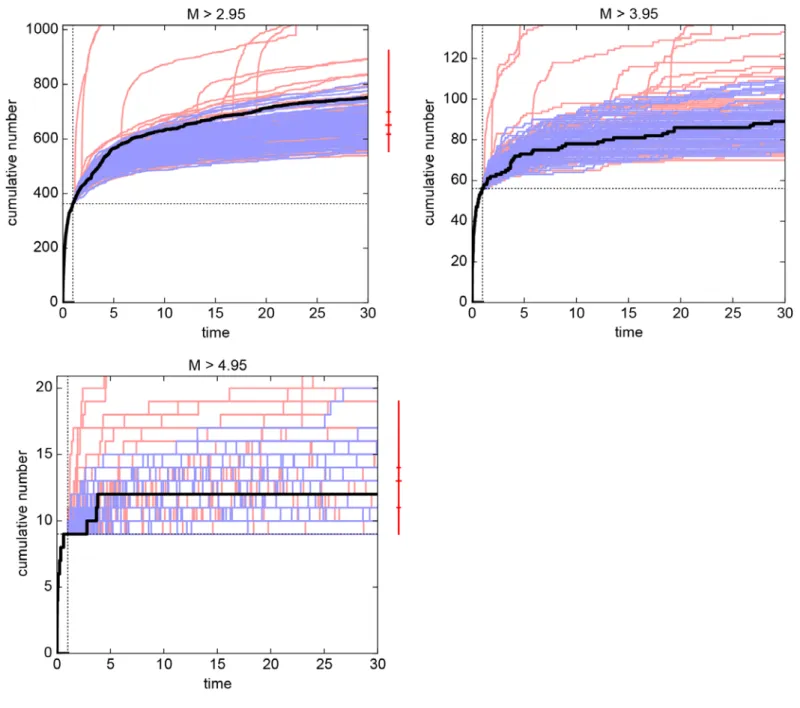
第4図. ETAS モデルを用いた 2016 年熊本地震の本震以降の余震活動の中期予測。本震後1日間のデータ (JMA カタログ)から ETAS モデル及び GR 則のパラメータを推定し,その後一ヶ月間の活動の予測をシ ミュレーションを用いて行った。ETAS モデルのパラメータは事後分布からサンプルされた 1000 のパラメ ータ値を用い,シミュレーション一回ごとにパラメータ値を変えて予測を行った(ベイズ予測)。マグニチ ュードの分布としては GR 則を用いているが,青線は学習期間に起きた最大の余震のマグニチュードに 0.3 を足したものよりも大きな余震は起こらないような制限を加えてシミュレーションを行ったものである。赤 線は本震と同じマグニチュードまでの余震を許容してシミュレーションを行った結果である。この異なるマ グニチュード分布からの予測を組み合わせて得られる予測分布の 2.5%, 25%, 50%, 75%, 97.5%点を示したも のがパネルの右側の赤いバーである。黒線は JMA カタログからの観測値を示している。なお中期予測にお ける ETAS モデルの有用性は 202 回予知連にて報告を行っている。
Fig. 4. Intermediate-term forecast of aftershocks after the 2016 Kumamoto M7.3 main shock by using the ETAS model. We estimated the parameters in the ETAS and GR models from the first 1 day aftershock data in the JMA catalog, and
forecasted the following 1-month aftershock activity using the stochastic simulation. We first sampled 1000 ETAS parameter sets from the posterior probability distribution, and changed the parameter sets sequence by sequence in the simulation (Bayesian forecasting). We used the GR model for the magnitude distribution with the upper limit at the maximum magnitude of aftershocks during the learning period plus 0.3 (blue lines), and at the main shock magnitude (red lines). By combining the simulations from the two different magnitude distribution, we obtained the predictive distribution. The red bar in the right to the panel represents the 2.5%, 25%, 50%, 75%, 97.5% points of the predictive distribution.
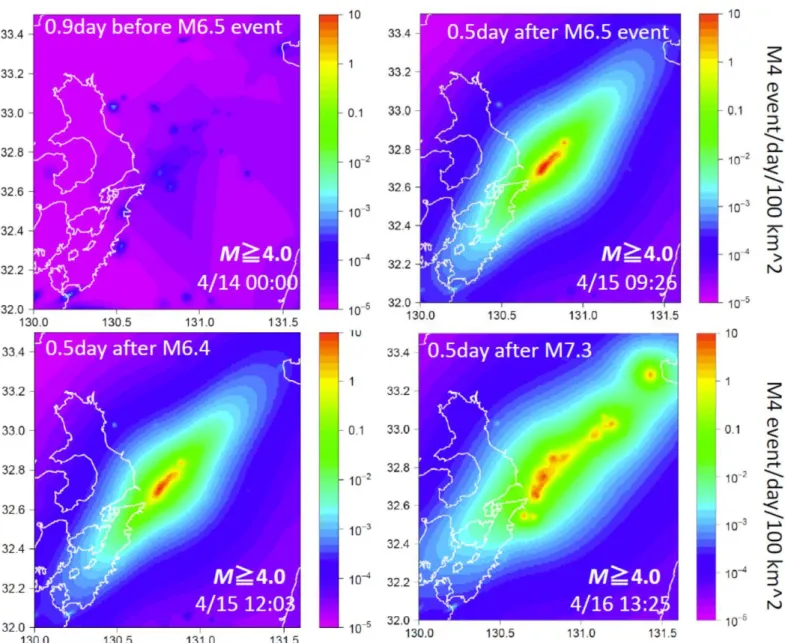
第5図. HIST-ETAS モデルを用いた 2016 年熊本地震系列の地震活動の空間分布予測。パラメータ値は CSEP 日本検証センターに提出された値を用いている。
Fig. 5. The spatial forecast of earthquakes during 2016 Kumamoto earthquake sequence by using the HIST-ETAS model. The parameters values that had been submitted to the CSEP Japan testing center are used.