20
|
wileyonlinelibrary.com/journal/rmb Reprod Med Biol. 2018;17:20–28. DOI: 10.1002/rmb2.12074O R I G I N A L A R T I C L E
Assisted reproductive technology in Japan: a summary report
for 2015 by The Ethics Committee of The Japan Society of
Obstetrics and Gynecology
Hidekazu Saito
1| Seung Chik Jwa
2,3| Akira Kuwahara
4| Kazuki Saito
5|
Tomonori Ishikawa
5| Osamu Ishihara
2| Koji Kugu
6| Rintaro Sawa
7,8|
Kouji Banno
9| Minoru Irahara
4This is an open access article under the terms of the Creative Commons Attribution-NonCommercial License, which permits use, distribution and reproduction in any medium, provided the original work is properly cited and is not used for commercial purposes.
© 2017 The Authors. Reproductive Medicine and Biology published by John Wiley & Sons Australia, Ltd on behalf of Japan Society for Reproductive Medicine. 1Division of Reproductive Medicine, Center of
Maternal-Fetal, Neonatal, and Reproductive Medicine, National Center for Child Health and Development, Tokyo, Japan
2Department of Obstetrics and Gynecology, Saitama Medical University, Saitama, Japan
3Sora no Mori Clinic, Okinawa, Japan 4Department of Obstetrics and
Gynecology, Graduate School of Biomedical Sciences, Tokushima University, Tokushima, Japan
5Department of Comprehensive Reproductive Medicine, Graduate School, Tokyo Medical and Dental University, Tokyo, Japan 6Department of Obstetrics and Gynecology, Tokyo Metropolitan Bokutoh Hospital, Tokyo, Japan
7Department of Obstetrics and
Gynecology, Nippon Medical School, Tokyo, Japan
8Japan Medical Association Research Institute, Tokyo, Japan
9Department of Obstetrics and Gynecology, School of Medicine, Keio University, Tokyo, Japan
Correspondence
Seung Chik Jwa, Department of Obstetrics and Gynecology, Saitama Medical University, Morohongo, Moroyama, Saitama, Japan. Email: [email protected]
Abstract
Purpose: The Japan Society of Obstetrics and Gynecology (JSOG) implemented an assisted reproductive technology (ART) registry system in 1986. Here are reported the characteristics and treatment outcomes of ART cycles that were registered in 2015. Methods: JSOG has requested all participating ART facilities to register cycle- specific information for all ART cycles since 2007. A descriptive analysis was performed by using the registry database for 2015.
Results: In total, 424 151 cycles and 51 001 neonates (1 in 19.7 neonates born in Japan) were registered in 2015. The patients’ mean age was 38.2 years (standard de-viation = 4.5). Among the fresh cycles, 94 158 of 244 718 (38.5%) egg retrieval cycles were cycles with freeze- all embryos or oocytes, while fresh embryo transfer (ET) was performed in 70 254 cycles, signaling a decrease from 2014. There were 169 898 frozen- thawed ET cycles, resulting in 56 355 pregnancies and 40 599 neonates. Single ET was performed at a rate of 79.7% for fresh and 81.8% for frozen cycles and the singleton pregnancy/live birth rates were 96.9%/96.5% and 96.8%/96.4% for the re-spective cycles.
Conclusion: The total ART cycles and live births resulting from ART has been increas-ing in Japan. Sincreas-ingle ET was performed at a rate of almost 80% and ET cycles have shifted from fresh to frozen cycles.
K E Y W O R D S
assisted reproductive technology, in vitro fertilization, intracytoplasmic sperm injection, single embryo transfer, The Japan Society of Obstetrics and Gynecology
1 | INTRODUCTION
Since the first baby was born as a result of in vitro fertilization (IVF) in the UK in 1978,1 assisted reproductive technology (ART) has been
used as infertility treatment globally. More than 1 million babies worldwide were reportedly born as a result of ART between 2008 and 2010.2 In Japan, the first baby born after IVF was reported by
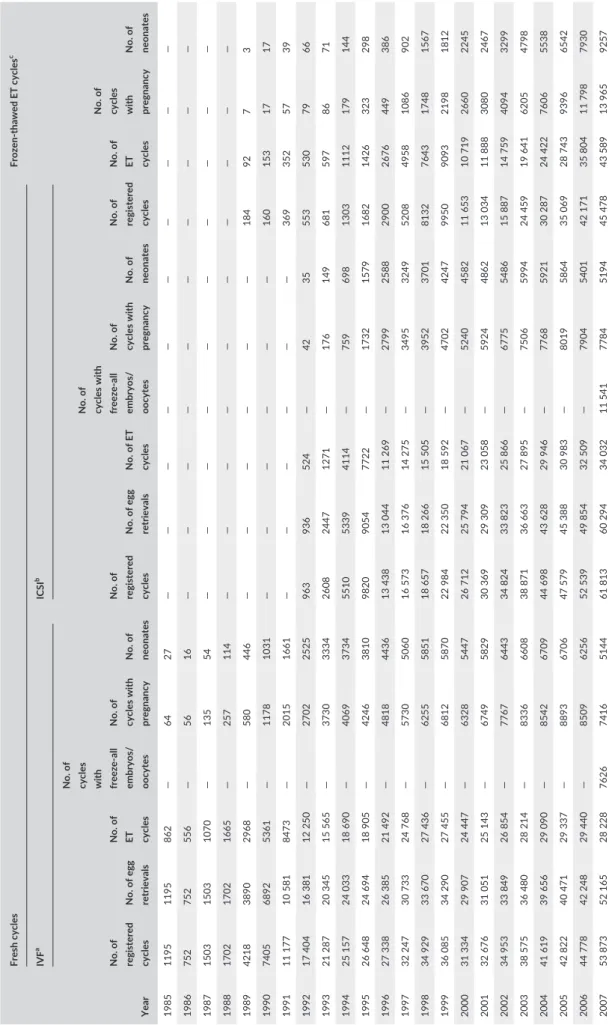
TABLE 1
Trends in the number o
f registered c
ycles, egg retrievals, pregnancies, and neonates by in vitro fertilization (IVF), intracytoplasmic
sperm injection (ICSI), and
thawed embryo transfer cycle in Japan from 1985 to 2015
Year Fresh cycles thawed ET c ycles c IVF a ICSI b
No. of registered cycles No. of egg retrievals No. of ET cycles No. of cycles with
all
embryos/ oocytes No. of cycles with pregnancy No. of neonates No. of registered cycles No. of egg retrievals No. of ET cycles No. of cycles with
all
embryos/ oocytes No. of cycles with pregnancy No. of neonates No. of registered cycles No. of ET cycles No. of cycles with pregnancy No. of neonates 1985 1195 1195 862 — 64 27 — — — — — — — — — — 1986 752 752 556 — 56 16 — — — — — — — — — — 1987 1503 1503 1070 — 135 54 — — — — — — — — — — 1988 1702 1702 1665 — 257 114 — — — — — — — — — — 1989 4218 3890 2968 — 580 446 — — — — — — 184 92 7 3 1990 7405 6892 5361 — 1178 1031 — — — — — — 160 153 17 17 1991 11 177 10 581 8473 — 2015 1661 — — — — — — 369 352 57 39 1992 17 404 16 381 12 250 — 2702 2525 963 936 524 — 42 35 553 530 79 66 1993 21 287 20 345 15 565 — 3730 3334 2608 2447 1271 — 176 149 681 597 86 71 1994 25 157 24 033 18 690 — 4069 3734 5510 5339 4114 — 759 698 1303 1112 179 144 1995 26 648 24 694 18 905 — 4246 3810 9820 9054 7722 — 1732 1579 1682 1426 323 298 1996 27 338 26 385 21 492 — 4818 4436 13 438 13 044 11 269 — 2799 2588 2900 2676 449 386 1997 32 247 30 733 24 768 — 5730 5060 16 573 16 376 14 275 — 3495 3249 5208 4958 1086 902 1998 34 929 33 670 27 436 — 6255 5851 18 657 18 266 15 505 — 3952 3701 8132 7643 1748 1567 1999 36 085 34 290 27 455 — 6812 5870 22 984 22 350 18 592 — 4702 4247 9950 9093 2198 1812 2000 31 334 29 907 24 447 — 6328 5447 26 712 25 794 21 067 — 5240 4582 11 653 10 719 2660 2245 2001 32 676 31 051 25 143 — 6749 5829 30 369 29 309 23 058 — 5924 4862 13 034 11 888 3080 2467 2002 34 953 33 849 26 854 — 7767 6443 34 824 33 823 25 866 — 6775 5486 15 887 14 759 4094 3299 2003 38 575 36 480 28 214 — 8336 6608 38 871 36 663 27 895 — 7506 5994 24 459 19 641 6205 4798 2004 41 619 39 656 29 090 — 8542 6709 44 698 43 628 29 946 — 7768 5921 30 287 24 422 7606 5538 2005 42 822 40 471 29 337 — 8893 6706 47 579 45 388 30 983 — 8019 5864 35 069 28 743 9396 6542 2006 44 778 42 248 29 440 — 8509 6256 52 539 49 854 32 509 — 7904 5401 42 171 35 804 11 798 7930 2007 53 873 52 165 28 228 7626 7416 5144 61 813 60 294 34 032 11 541 7784 5194 45 478 43 589 13 965 9257
Year Fresh cycles thawed ET c ycles c IVF a ICSI b
No. of registered cycles No. of egg retrievals No. of ET cycles No. of cycles with
all
embryos/ oocytes No. of cycles with pregnancy No. of neonates No. of registered cycles No. of egg retrievals No. of ET cycles No. of cycles with
all
embryos/ oocytes No. of cycles with pregnancy No. of neonates No. of registered cycles No. of ET cycles No. of cycles with pregnancy No. of neonates 2008 59 148 57 217 29 124 10 139 6897 4664 71 350 69 864 34 425 15 390 7017 4615 60 115 57 846 18 597 12 425 2009 63 083 60 754 28 559 11 800 6891 5046 76 790 75 340 35 167 19 046 7330 5180 73 927 71 367 23 216 16 454 2010 67 714 64 966 27 905 13 843 6556 4657 90 677 88 822 37 172 24 379 7699 5277 83 770 81 300 27 382 19 011 2011 71 422 68 651 27 284 16 202 6341 4546 102 473 100 518 38 098 30 773 7601 5415 95 764 92 782 31 721 22 465 2012 82 108 79 434 29 693 20 627 6703 4740 125 229 122 962 40 829 41 943 7947 5498 119 089 116 176 39 106 27 715 2013 89 950 87 104 30 164 25 085 6817 4776 134 871 134 871 41 150 49 316 8027 5630 141 335 138 249 45 392 32 148 2014 92 269 89 397 30 414 27 624 6970 5025 144 247 141 888 41 437 55 851 8122 5702 157 229 153 977 51 458 36 595 2015 93 614 91 079 28 858 30 498 6478 4629 155 797 153 639 41 396 63 660 8169 5761 174 740 171 495 56 888 40 611 aIncludes gamete in trafallopian transfers; bincludes split ICSI cycles;
cincludes cycles using
increased dramatically and Japan has reportedly become one of the largest contributors of ART worldwide in terms of the annual number of procedures done.2
In order to record the characteristics and clinical outcomes of ART that are implemented in Japan, The Japan Society of Obstetrics and Gynecology (JSOG), Tokyo, Japan, developed an ART registry system in 1986. In 2007, JSOG launched an online registration system to collect cycle- specific information for all ART treatment cycles. Here are re-ported the characteristics and treatment outcomes of the ART cycles that were performed between 1 January and 31 December, 2015.
2 | MATERIALS AND METHODS
Since 2007, JSOG has requested that all ART clinics and hospitals register cycle- specific information for all ART cycles, including pa-tient characteristics, information on ART treatment, and pregnancy and obstetric outcomes. Details on the information that has been collected in the registry have been reported previously.4 For the
pe-riod from 1 January to 31 December, 2015, JSOG requested that information on each treatment cycle that was performed at all par-ticipating institutions be registered via an online registry system by the end of November, 2016. This study was approved by the Institutional Review Board at the National Center for Child Health and Development, Tokyo, Japan, and the Ethical Review Board at JSOG.
Using the ART registry database in 2015, a descriptive analysis was performed to investigate the characteristics and treatment outcomes of registered fresh and frozen cycles. The number of registered cycles, egg retrievals, embryo transfer (ET) cycles, fresh cycles with freeze- all embryos or oocytes, pregnancies, and neonates was compared with that in previous years. The characteristics of the registered cycles and treatment outcomes were described for the fresh and the frozen cy-cles. The treatment outcomes included the pregnancy, miscarriage, and live birth rates, multiple pregnancies, and pregnancy outcomes for an ectopic pregnancy, intrauterine pregnancy coexisting with an ectopic pregnancy, artificial abortion, stillbirth, and fetal reduction. Furthermore, the treatment outcomes of pregnancy and the live birth
and miscarriage rates were analyzed by patient age finally; the treat-ment outcomes for frozen- thawed ET using frozen- thawed oocytes also were investigated.
3 | RESULTS
There were 607 registered ART facilities in 2015, of which 603 par-ticipated in the ART registration system. The number of facilities that actually provided information on cycle- specific information for ART treatment in 2015 was 574; the number of implemented cycles was zero at 29 facilities. The trends in the number of registered cycles, egg retrievals, pregnancies, and neonates for IVF, intracytoplasmic sperm injection (ICSI), and frozen- thawed ET cycles from 1985 to 2015 are shown in Table1. In 2015, 424 151 cycles were registered and 51 001 neonates, accounting for 1 in 19.7 neonates who were born in Japan, were recorded. The total number of registered cycles showed an in-creasing trend from 1985 to 2015 for both fresh and frozen cycles. In 2015, the number of cycles that was registered for fresh IVF, fresh ICSI, and frozen cycles was 93 614, 155 797, and 174 740, respec-tively. The total number of fresh cycles with freeze- all embryos or oocytes showed an increasing trend both for IVF and ICSI cycles and 30 498 IVF (32.6%) and 63 660 ICSI (40.9%) cycles were cycles with freeze- all embryos or oocytes in 2015, resulting in fewer fresh ET cycles in 2015 than in 2014. In terms of frozen cycles, 171 495 fro-zen ETs were performed, resulting in 56 888 pregnancies and 40 611 births in 2015.
The age distribution of the women who were treated with ART in 2015 is shown in Figure 1. The patients’ mean age for the registered cycles was 38.2 years (standard deviation [SD] = 4.5), while the mean age for pregnancy and live birth cycles was 36.2 years (SD = 4.1) and 35.7 years (SD = 4.0), respectively.
The characteristics and treatment outcomes of the registered fresh cycles are shown in Table2. There were 89 780 registered IVF cycles, 22 860 split ICSI cycles, 130 132 ICSI cycles using ejac-ulated sperm, 2803 ICSI cycles using testicular sperm extraction (TESE), 50 gamete intrafallopian transfer (GIFT) cycles, 374 cycles with oocyte freezing based on medical indications, and 3410 other
F I G U R E 1 Age distribution of the
registered cycles, cycles with embryo transfer, pregnancies, and live births in Japan in 2015, according to the Assisted Reproductive Technology registry. Adapted from The Japan Society of Obstetrics and Gynecology ART Databook 2015 (http://plaza.umin.ac.jp/~jsog-art/2015data_201709.pdf) (in Japanese)
cycles. Single ET was performed at a rate of 79.7%. The pregnancy rate per ET was 22.6% for IVF, 24.4% for split ICSI, 18.9% for ICSI using ejaculated sperm, 16.7% for ICSI with TESE, and 10.3% for GIFT. The miscarriage rate per pregnancy was 26.0% for IVF, 21.6% for split ICSI, 28.7% for ICSI using ejaculated sperm, and 32.5% for
ICSI with TESE, resulting in the respective live birth rate per ET of 15.7%, 18.0%, 12.8%, and 10.5%, respectively. The singleton preg-nancy rate and live birth rate were 96.9% and 96.5%, respectively. The characteristics and treatment outcomes of the frozen cycles are shown in Table3. There were 172 946 registered frozen- thawed
Variable IVF- ET Split ICSI
ICSI
GIFT
Oocyte
freezing Othersa
Ejaculated
sperm TESE Total
No. of registered cycles 89 780 22 862 130 132 2803 50 374 3410 249 411
No. of egg retrievals 87 425 22 679 128 160 2800 50 366 3238 244 718
No. of fresh ET cycles 28 388 6597 33 807 992 39 0 431 70 254
No. of cycles with freeze- all embryos or
oocytes 29 541 13 173 49 291 1196 4 312 641 94 158
No. of cycles with a pregnancy 6403 1609 6394 166 4 — 71 14 647
Pregnancy rate per ET 22.6% 24.4% 18.9% 16.7% 10.3% — 16.5% 20.8%
Pregnancy rate per egg retrieval 7.3% 7.1% 5.0% 5.9% 8.0% — 2.2% 6.0%
Pregnancy rate per egg retrieval excluding
cycles with freeze- all embryos 11.1% 16.9% 8.1% 10.3% 8.7% — 2.7% 9.7%
SET cycles 22 947 5677 26 457 573 9 — 308 55 971
Pregnancy following SET cycles 5234 1414 5054 105 0 — 57 11 864
Rate of SET cycles 80.8% 86.1% 78.3% 57.8% 23.1% — 71.5% 79.7%
Pregnancy rate following SET 22.8% 24.9% 19.1% 18.3% 0.0% — 18.5% 21.2%
Miscarriages 1666 348 1838 54 3 — 16 3925
Miscarriage rate per pregnancy 26.0% 21.6% 28.7% 32.5% 75.0% — 22.5% 26.8%
Singleton pregnanciesb 6003 1536 5991 142 3 — 69 13 744
Multiple pregnanciesb 190 40 200 8 1 — 1 440
Twin pregnanciesb 186 40 198 8 1 — 1 434
Triplet pregnanciesb 3 0 2 0 0 — 0 5
Quadruplet pregnanciesb 1 0 0 0 0 — 0 1
Multiple pregnancy rate 3.1% 2.5% 3.2% 5.3% 25.0% — 1.4% 3.1%
Live births 4448 1185 4316 104 1 — 51 10 105
Live birth rate per ET 15.7% 18.0% 12.8% 10.5% 2.6% — 11.8% 14.4%
Total number of neonates 4577 1220 4432 109 1 — 51 10 390
Singleton live births 4285 1147 4167 99 1 — 51 9750
Twin live births 143 35 131 5 0 — 0 314
Triplet live births 2 1 1 0 0 — 0 4
Quadruplet live births 1 0 0 0 0 — 0 1
Pregnancy outcomes
Ectopic pregnancies 103 24 70 2 0 — 1 200
Intrauterine pregnancies coexisting with
an ectopic pregnancy 0 0 1 0 0 — 0 1
Artificial abortions 15 6 26 0 0 — 1 48
Stillbirths 25 10 22 1 0 — 2 60
Fetal reductions 6 0 1 0 0 — 0 7
Unknown cycles for pregnancy outcomes 112 24 89 4 0 — 0 229
a”Others” includes zygote intrafallopian transfer; bSingleton, twin, triplet, and quadruplet pregnancies were defined according to the number of gestational
sacs in utero. ET, embryo transfer; GIFT, gamete intrafallopian transfer; ICSI, intracytoplasmic sperm injection; IVF- ET, in vitro fertilization- embryo transfer; SET, single embryo transfer; TESE, testicular sperm extraction.
ET cycles, of which 169 898 were performed and from which 56 355 pregnancies resulted (the pregnancy rate per frozen- thawed ET = 33.2%). The miscarriage rate per pregnancy was 26.4%, resulting in a 23.0% live birth rate per ET. Single ET was performed at a rate of 81.8% and the singleton pregnancy rate was 96.8%. Among the live births, 96.4% were singletons.
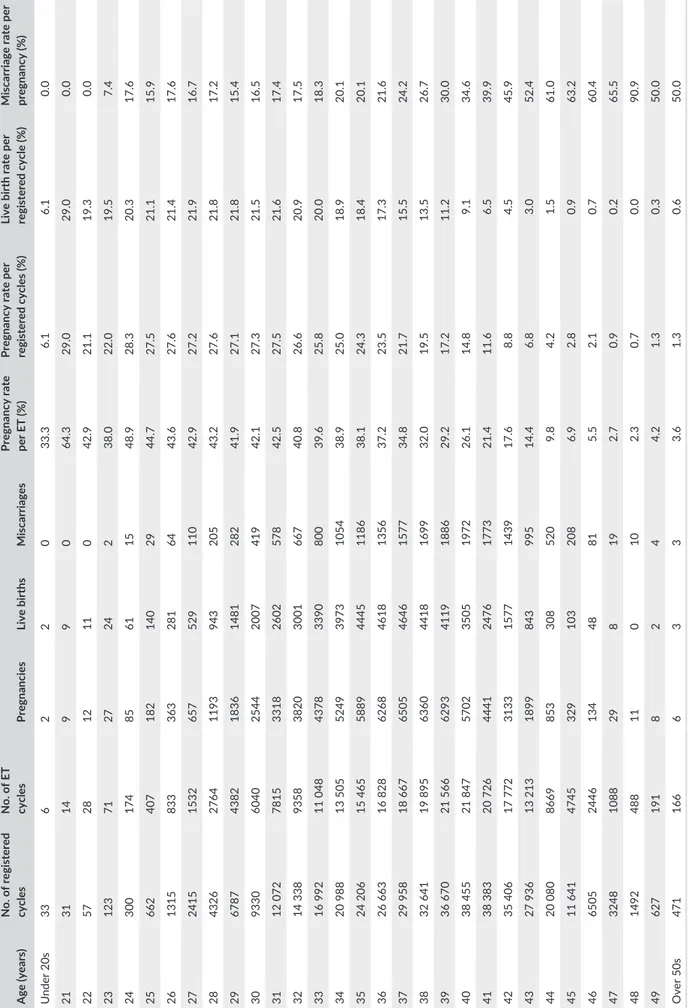
The total number of registered ET cycles, the number and rate of pregnancies, and the rate of live births and miscarriages by patient age in 2015 are shown in Table4. The distribution of the pregnancy, live birth, and miscarriage rates for each age is shown in Figure2. The pregnancy rate per ET exceeded 40% up to 32 years of age and gradually fell below 30% after 39 years of age and below 10% after 44 years of age. The miscarriage rate per pregnancy was 17% for those who were under 32 years of age and it gradually increased with an increase in patient age. The miscarriage rate was 34.6% for those who were 40 years of age and 52.4% for those who were 43 years of age. The live birth rate per registered cycle was ~20% up to 33 years of age and it decreased to 9.1% by 40 years of age and 3.0% by 43 years of age.
The treatment outcomes for ET using frozen- thawed oocytes are shown in Table 5. The total number of ETs using frozen oocytes was 135 cycles, of which 15 cycles resulted in a pregnancy (the pregnancy rate per ET = 11.1%). The miscarriage rate per pregnancy was 26.7%, resulting in an 8.1% live birth rate per ET.
4 | DISCUSSION
Using the ART registry system, this study demonstrated that the total number of registered ART cycles (424 151 cycles) and resultant live births (51 001 neonates, or 1 in 19.7 neonates who were born in Japan) were largest in 2015. Single ET was performed at a rate of almost 80% for both fresh and frozen cycles, resulting in a singleton live birth rate of 96%. The number of fresh cycles with freeze- all embryos or oocytes increased, resulting in a reduction in the number of fresh ET cycles. These results represent the latest clinical practice of ART in Japan.
One of the reasons for the increasing number of ART cycles is the age of the patients who are receiving ART. In the registered cycles, the mean age of the patients was 38.2 years (SD = 4.5) and the mean age for the cycles with live births was 35.7 years (SD = 4.0). Both fig-ures were very high, compared with the mean age of Japanese women who have given birth. According to a 2015 report from the Ministry of Health, Labour and Welfare, the mean maternal age at the time of the first birth is 30.7 years.5 Maternal age was the most important factor
to determine the probability of a live birth after ART. As the pregnancy and live birth rates decreased as the maternal age increased (Table 4), the number of ET cycles resulting in a live birth theoretically would exceed that in mothers of a younger age.
Single ET was performed at a rate of almost 80%, both for fresh and frozen cycles. In 2008, JSOG recommended restricting the num-ber of ETs to one in order to prevent multiple pregnancies but double ET was allowed for women who are older than 35 years of age or for women who have experienced recurrent implantation failure. As a result, the number of single ETs has increased from 49.9% in 2007 to 73.0% in 2010, while multiple pregnancies have decreased from 11.5% in 2007 to 4.8% in 2010.6 The single ET policy has been
cred-ited with improving other indicators of perinatal outcomes in Japan.7
There was a significant increasing trend in the number of fresh cy-cles with freeze- all embryos and oocytes (Table 1). Frozen- thawed ET
T A B L E 3 Characteristics and treatment outcomes of frozen
cycles using assisted reproductive technology in Japan in 2015
Variable
Frozen- thawed
embryo transfer Others Total
Total number of registered cycles
172 946 1563 174 509
Total number of FETs 169 898 1462 171 360
Number of cycles with a pregnancy
56 355 518 56 873
Pregnancy rate per embryo transfer 33.2% 35.4% 33.2% SET cycles 139 027 1078 140 105 Pregnancy following SET cycles 47 582 377 47 959
Rate of SET cycles 81.8% 73.7% 81.8%
Pregnancy rate following SET
34.2% 35.0% 34.2%
Miscarriages 14 877 147 15 024
Miscarriage rate per pregnancy 26.4% 28.4% 26.4% Singleton pregnanciesa 53 520 404 53 924 Multiple pregnancies 1770 33 1803 Twin pregnanciesa 1736 33 1769 Triplet pregnanciesa 33 0 33 Quadruplet pregnanciesa 1 0 1 Multiple pregnancy rate 3.2% 7.6% 3.2%
Live birth rate per embryo transfer
23.0% 23.1% 23.0%
Total number of neonates
40 242 357 40 599
Singleton live births 37 740 315 38 055
Twin live births 1233 21 1254
Triplet live births 12 0 12
Ectopic pregnancies 348 1 349 Intrauterine pregnancies coexisting with an ectopic pregnancy 6 6 12 Artificial abortions 219 0 219 Stillbirths 203 3 206 Fetal reductions 4 20 24
aSingleton, twin, triplet, and quaduplet pregnancies were defined
TABLE 4
Treatment outcomes of
registered cy
cles according to the patients’ age in Japan in 2015
Age (years)
No. of registered cycles No. of ET cycles
Pregnancies
Live births
Miscarriages
Pregnancy rate per ET (%) Pregnancy rate per registered cycles (%) Live birth rate per registered cycle (%) Miscarriage rate per pregnancy (%)
Under 20s 33 6 2 2 0 33.3 6.1 6.1 0.0 21 31 14 9 9 0 64.3 29.0 29.0 0.0 22 57 28 12 11 0 42.9 21.1 19.3 0.0 23 123 71 27 24 2 38.0 22.0 19.5 7.4 24 300 174 85 61 15 48.9 28.3 20.3 17.6 25 662 407 182 140 29 44.7 27.5 21.1 15.9 26 1315 833 363 281 64 43.6 27.6 21.4 17.6 27 2415 1532 657 529 110 42.9 27.2 21.9 16.7 28 4326 2764 1193 943 205 43.2 27.6 21.8 17.2 29 6787 4382 1836 1481 282 41.9 27.1 21.8 15.4 30 9330 6040 2544 2007 419 42.1 27.3 21.5 16.5 31 12 072 7815 3318 2602 578 42.5 27.5 21.6 17.4 32 14 338 9358 3820 3001 667 40.8 26.6 20.9 17.5 33 16 992 11 048 4378 3390 800 39.6 25.8 20.0 18.3 34 20 988 13 505 5249 3973 1054 38.9 25.0 18.9 20.1 35 24 206 15 465 5889 4445 1186 38.1 24.3 18.4 20.1 36 26 663 16 828 6268 4618 1356 37.2 23.5 17.3 21.6 37 29 958 18 667 6505 4646 1577 34.8 21.7 15.5 24.2 38 32 641 19 895 6360 4418 1699 32.0 19.5 13.5 26.7 39 36 670 21 566 6293 4119 1886 29.2 17.2 11.2 30.0 40 38 455 21 847 5702 3505 1972 26.1 14.8 9.1 34.6 41 38 383 20 726 4441 2476 1773 21.4 11.6 6.5 39.9 42 35 406 17 772 3133 1577 1439 17.6 8.8 4.5 45.9 43 27 936 13 213 1899 843 995 14.4 6.8 3.0 52.4 44 20 080 8669 853 308 520 9.8 4.2 1.5 61.0 45 11 641 4745 329 103 208 6.9 2.8 0.9 63.2 46 6505 2446 134 48 81 5.5 2.1 0.7 60.4 47 3248 1088 29 8 19 2.7 0.9 0.2 65.5 48 1492 488 11 0 10 2.3 0.7 0.0 90.9 49 627 191 8 2 4 4.2 1.3 0.3 50.0 Over 50s 471 166 6 3 3 3.6 1.3 0.6 50.0
cycles reportedly result in better pregnancy and perinatal outcomes than fresh cycles,7-9 and recently, strategies for fresh cycles using
freeze- all embryos has been suggested.10 In order to avoid the risk of
ovarian hyperstimulation syndrome, fresh cycles with freeze- all em-bryos probably will increase in the future.
The strengths of the ART registry system in Japan are its man-datory reporting system and high compliance rate. Patients cannot receive a government subsidy for a cycle if their ART facility does not register the procedure. As almost all participating ART clinics and hospitals register cycle- specific information (99.3%), information on the latest clinical practices of ART in Japan are available. In contrast, the registry has several limitations. First, it includes multiple cycles for each patient over the years and it is impossible to distinguish cy-cles for a given patient; therefore, the correlations within a single patient could bias the clinical outcomes. Second, the registration of cycle- specific information and pregnancy outcomes depends on each ART facility; therefore, standardization of the data registration is im-portant. Although JSOG publishes frequently asked questions and answers about registering data online and periodically scrutinizes these data in order to maintain their integrity, assessing the validity of the registry will continue to be very important in the future.11,12
In conclusion, this analysis of the ART registry for 2015 demon-strated that the total number of ART cycles increased and resulted in 51 001 neonates (1 in 19.7 neonates who were born in Japan). The pa-tients’ age when they received an ART procedure was higher than the mean age of primiparae in Japan. Single ET was performed at a rate of almost 80% and 96% of live births were singletons. The ET cycles have shifted from fresh to frozen cycles as fresh cycles with freeze- all em-bryos have increased. These data represent the latest clinical practices of ART in Japan and the registry has greatly contributed to improving the success and safety of ART in Japan.
ACKNOWLEDGEMENTS
We thank all of the registered facilities for their cooperation in provid-ing their responses. We also would like to encourage these facilities to continue to promote the use of the online registry system and to assist us with our research.
T A B L E 5 Treatment outcomes of embryo transfers using
frozen- thawed oocytes and assisted reproductive technology in Japan in 2015
Variable Embryo transfer using frozen- thawed oocytes
Total number of registered cycles 231
Total number of embryo transfers 135
Number of cycles with a pregnancy 15
Pregnancy rate per embryo transfer 11.1%
SET cycles 88
Pregnancy following SET cycles 10
Rate of SET cycles 65.2%
Pregnancy rate following SET 11.4%
Miscarriages 4
Miscarriage rate per pregnancy 26.7%
Singleton pregnanciesa 10
Multiple pregnancies 1
Twin pregnanciesa 1
Triplet pregnanciesa 0
Quadruplet pregnanciesa 0
Multiple pregnancy rate 9.1%
Live births 11
Live birth rate per embryo transfer 8.1%
Total number of neonates 12
Singleton live births 10
Twin live births 1
Triplet live births 0
Ectopic pregnancies 0
Intrauterine pregnancies coexisting with an ectopic pregnancy
0
Artificial abortions 0
Stillbirths 0
Fetal reduction 0
Unknown cycles for pregnancy outcomes
0
aSingleton, twin, triplet, and quadruplet pregnancies were defined
ac-cording to the number of gestational sacs in utero. SET, single embryo transfer.
F I G U R E 2 Rates of pregnancy,
live,births, and miscarriage by patient age in Japan in 2015, according to the assisted reproductive technology registry. Adapted from The Japan Society of Obstetrics and Gynecology ART Databook 2015 (http://plaza.umin.ac.jp/~jsog-art/2015data_201709.pdf) (in Japanese). ET, embryo transfer
Conflict of interest: The authors declare no conflict of interest. Human and Animal Rights: All the procedures accorded with the ethical
stand-ards of the relevant committees on human experimentation (institu-tional and na(institu-tional) and with the Helsinki Declaration of 1964 and its later amendments. Informed consent was obtained from all the pa-tients in the study. This study was approved by the Institutional Review Board at the National Center for Child Health and Development and the Ethical Review Board at the JSOG. This article does not contain any study that was performed by any of the authors that included animal participants.
ORCID
Seung Chik Jwa http://orcid.org/0000-0002-8815-5714
Kazuki Saito http://orcid.org/0000-0002-0597-9479
Tomonori Ishikawa http://orcid.org/0000-0002-1012-1557
REFERENCES
1. Steptoe PC, Edwards RG. Birth after the reimplantation of a human embryo. Lancet. 1978;2:366.
2. Dyer S, Chambers GM, de Mouzon J, et al. International committee for monitoring assisted reproductive technologies world report: as-sisted reproductive technology 2008, 2009 and 2010. Hum Reprod. 2016;31:1588-1609.
3. Suzuki M, Hoshi K, Hoshiai H, et al. Pregnancy achieved through in vitro fertilization and embryo transfer. Jpn J Fert Steril. 1983;28:439-443. 4. Irahara M, Kuwahara A, Iwasa T, et al. Assisted reproductive
tech-nology in Japan: a summary report of 1992–2014 by the Ethics Committee, Japan Society of Obstetrics and Gynecology. Reprod Med Biol. 2017;16:126-132.
5. Annual Report for Viatal Statistics. 2015. Ministry of Health, Labour and Welfare, Japan. Available at: http://www.mhlw.go.jp/toukei/ saikin/hw/jinkou/kakutei15/index.html Accessed December 5, 2016 (in Japanese).
the national registry system. J Assist Reprod Genet. 2014;31:477-484. 7. Takeshima K, Jwa SC, Saito H, et al. Impact of single embryo
trans-fer policy on perinatal outcomes in fresh and frozen cycles – analysis of the Japanese Assisted Reproduction Technology registry between 2007 and 2012. Fertil Steril. 2016;105:e3.
8. Pinborg A, Wennerholm UB, Romundstad LB, et al. Why do single-tons conceived after assisted reproduction technology have adverse perinatal outcome? Systematic review and meta- analysis. Hum Reprod Update. 2013;19:87-104.
9. Pinborg A, Loft A, Aaris Henningsen AK, Rasmussen S, Andersen AN. Infant outcome of 957 singletons born after frozen embryo replace-ment: the Danish National Cohort Study 1995- 2006. Fertil Steril. 2010;94:1320-1327.
10. Roque M, Valle M, Guimaraes F, Sampaio M, Geber S. Freeze- all policy: fresh vs. frozen- thawed embryo transfer. Fertil Steril. 2015;103:1190-1193.
11. Toner JP, Coddington CC, Doody K, et al. Society for Assisted Reproductive Technology and assisted reproductive technology in the United States: a 2016 update. Fertil Steril. 2016;106:541-546. 12. Stern JE, Gopal D, Liberman RF, Anderka M, Kotelchuck M, Luke
B. Validation of birth outcomes from the Society for Assisted Reproductive Technology Clinic Outcome Reporting System (SART CORS): population- based analysis from the Massachusetts Outcome Study of Assisted Reproductive Technology (MOSART). Fertil Steril. 2016;106:e2.
How to cite this article: Saito H, Jwa SC, Kuwahara A, et al.
Assisted reproductive technology in Japan: a summary report for 2015 by The Ethics Committee of The Japan Society of Obstetrics and Gynecology. Reprod Med Biol. 2018;17:20-28.