Single-cell nanobiopsy reveals
compartmentalization of mRNA in neuronal cells
著者(英) Eszter Toth year 2018 その他のタイトル シングルセルナノバイオプシーによる神経細胞の mRNA局在に関する研究 学位授与大学 筑波大学 (University of Tsukuba) 学位授与年度 2018 報告番号 12102甲第8767号 URL http://doi.org/10.15068/00156442
筑 波 大 学
University of Tsukuba博 士 (人間生物学) 学 位 論 文
PhD dissertation in Human Biology
2
Single-cell nanobiopsy reveals
compartmentalization of mRNA in
neuronal cells
(
シングルセルナノバイオプシーによる神経細胞の mRNA
局在に関する研究)
2018
筑波大学グローバル教育院
School of the Integrative and Global Majors in University of Tsukuba
Ph.D. Program in Human Biology
ESZTER TÓTH
4
In highly polarized cells such as neurons, compartmentalization of mRNA and of local protein synthesis enables remarkably fast, precise, and local responses to external stimuli. These responses are highly important for neuron growth cone guidance, synapse formation, and regeneration following injury. Because an altered spatial distribution of mRNA can result in mental retardation or neurodegenerative diseases, subcellular transcriptome analysis of neurons could be a useful tool for studying these conditions, but current techniques, such as in
situ hybridization, bulk microarray, or RNA-Seq, impose tradeoffs between
spatial resolution and multiplexing. To obtain a comprehensive analysis of the cell body versus neurite transcriptome from the same neuron, our group has recently developed a label-free, single-cell nanobiopsy platform based on scanning ion conductance microscopy (SICM), that uses electrowetting within a quartz nanopipette to extract cellular material from living cells with minimal disruption of the cellular membrane and milieu. In this study, I used this platform to collect samples from the cell bodies and neurites of human neurons and analyzed the mRNA pool with multiplex RNA-Seq. The minute volume of a nanobiopsy sample allowed me to extract samples from several locations in the same cell and to map the various mRNA species to specific subcellular locations. In addition to previously identified transcripts, I discovered new sets of mRNAs localizing to neurites, including nuclear genes such as Eomes and
Hmgb3. In summary, my single-neuron nanobiopsy analysis provides
opportunities to improve our understanding of intracellular mRNA transport and local protein composition in neuronal growth, connectivity, and function.
6
mRNA compartmentalization in neurons
Compartmentalization of proteins provides a way for cells to respond to extracellular stimuli with great spatial resolution. Neurons are highly polarized cells. Intracellular distances between the cell body and the axon terminals can be as long as one meter, thus transporting proteins or other cellular materials from the soma to the peripheries may take days. Therefore, neurons can greatly benefit from subcellular localization of mRNAs and local translation. Local mRNA translation enables rapid, remarkably precise, local responses to external stimuli, allowing tight/accurate regulation of subcellular composition/content (Jung et al., 2014).
Subcellular localization of mRNAs is a highly prevalent and evolutionary conserved phenomenon. Indeed, a large-scale, in situ hybridization study in Drosophila embryos revealed, that 71% of mRNAs of the genes examined localize to distinct subcellular compartments (Lécuyer et al., 2007). Evidence for local protein synthesis in axon was shown as early as 1968 (Giuditta et al., 1968), and, as proved later, severed axons are capable of responding to guidance cues in a protein synthesis-dependent manner (Campbell and Holt, 2001).
Components of the protein synthesis, posttranslational modification and folding machinery, such as rough endoplasmic reticulum, polyribosomes and Golgi apparatus can be found in dendrites, and can be easily visualized using electron microscopy (Job and Eberwine, 2001). On the other hand, in axons,
ultrastructural analysis does not reveal any typical morphological features corresponding to rough endoplasmic reticulum or Golgi. In fact, resident RER and Golgi proteins show puncta-like localization, as shown by immunofluorescence, indicating the presence of functionally equivalent, ER and Golgi-like vesicles, respectively (Merianda et al., 2009).
One advantage of mRNA compartmentalization and local translation in axons and dendrites can be that, one mRNA molecule can be translated to several protein molecules, making molecular transport more economic and avoiding crowding of cargo molecules. This greatly resonates with the fact, that the amount of protein in the cells depends on the rate of translation rather than the amount of mRNA (i.e transcription) (Schwanhäusser et al., 2011). This indicates that the local protein composition and amount depends on what kind of mRNA transcripts localize to that subcellular area and at what rate they are translated. In theory fast axonal transport could, at 50–200 mm/day, maintain the baseline level of membrane and secreted proteins (Merianda et al., 2009). Therefore, local protein synthesis may be implemented in fast, remarkably precise, local response to external stimuli or metabolic changes, allowing tight regulation of subcellular composition. In addition, newly synthetized proteins that have not undergone any posttranslational modification may harbor some unique information.
8
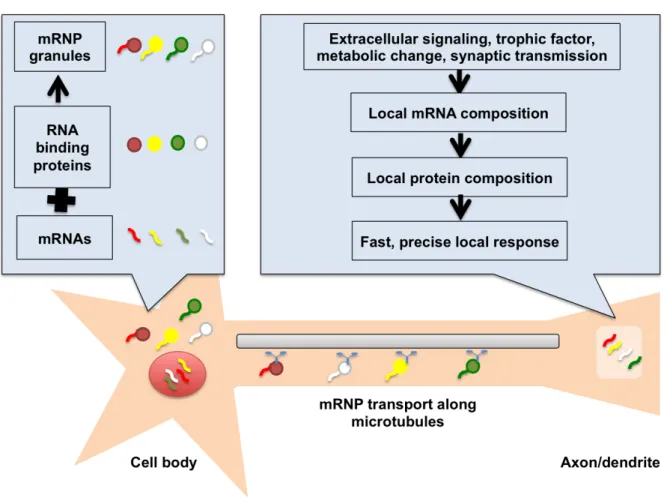
Figure 1. Schematic of mRNA compartmentalization in neuronal cells.
mRNAs bind specific RNA binding proteins in the cell body and are transported along the microtubulues to neuronal extensions. Various extracellular signals or synaptic transmission can trigger the local translation of mRNAs in the axons/dendrites enabling a fast, precise and localized response.
So far, analysis of mRNA species in dendrites and axons revealed thousands of transcripts that are differentially localized (Gumy et al., 2011; Cajigas et al., 2012; Ainsley et al., 2014; Minis et al., 2014; Shigeoka et al., 2016). Some sequence motifs at the 3’UTR, 5’UTR and retained intron regions of the mRNA have been found to regulate the localization of transcripts to neuronal processes (Buckley et al., 2011; Jung et al., 2012a) in the translationally repressed state during mRNA trafficking (Jung et al., 2014) (Fig. 1).
Compartmentalization and local translation of mRNAs are involved in different aspects of neuronal homeostasis. Neuronal growth cones respond to attractive (BDNF, netrin) and repulsive (SEM3A, Slit2b) guidance cues, by regulating the local translation of the cytoskeletal protein β-actin (Bassell et al., 1998; Zhang et al., 1999, 2001; Brittis et al., 2002; Leung et al., 2006; Yao et al., 2006; Huebner and Strittmatter, 2009; Kundel et al., 2009) and the actin cytoskeleton remodeling proteins cofilin (Piper et al., 2006) and RhoA (Wu et al., 2005). In the developing retina, the mRNA encoding the activated leukocyte cell adhesion molecule (ALCAM) localizes to axons, where it mediates homophilic adhesion of axons from the same neuronal subtype, thus formation of axon bundles (Thelen et al., 2012). In vivo data in Drosophila melanogaster shows that the axonal synthesis of the Slit2 receptor Robo-3/Rig-1 is necessary for axon guidance and midline crossing (Kuwako et al., 2010).
In rat and mouse dorsal root ganglions target-derived neurotrophic factors induce the transcription, anterograde transport and axonal translation of Bclw, that, by inhibiting caspase6 apoptotic cascade, prevents axonal degeneration and promotes axon maintenance (Cosker et al., 2013). In Xenopus laevis retinal ganglion cells lamin B2 protein is translated in axon, binds mitochondria, and it is required for the maintenance of mitochondrial function and axonal integrity (Yoon et al., 2012). Neurotrophic factor stimulation induces the synthesis of SMAD 1/5/8 (Ji and Jaffrey, 2012) and CREB (Cox et al., 2008) proteins in
10
axon, that, after retrograde transport and phosphorylation, act as transcription factors and promote neuron survival. Thus, transcription factors synthesized in the periphery and interacting with the local signaling environment may carry some unique information.
Following neuron injury, local translation is required for neurite regeneration (Twiss et al., 2000; Zheng et al., 2001; Verma et al., 2005; Yoo et al., 2010; Donnelly et al., 2011). Locally synthesized proteins include importin (Hanz et al., 2003), vimentin (Perlson et al., 2005), RanBP1 (Yudin et al., 2008), STAT3 (Ben-Yaakov et al., 2012) and CREB3 (Ying et al., 2014). In fact, the ability of axons to synthesize proteins decreases as they mature, in parallel with their reduced ability to re-grow after axotomy (Jung et al., 2012b).
mRNAs localized to dendrite include those of encoding CAMPKIIα, Protein kinase Mζ, and neurotransmitter receptors of the AMPA (GluR1 and 2) and NMDA (NR1) families. (Doyle and Kiebler, 2011) Their presence and translation is necessary for synapse maturation, long term potentiation, memory formation and learning. (Miller et al., 2002; Muslimov et al., 2004; Piper et al., 2005). On the other hand, mRNAs encoding neurotransmitters, such as oxytocin and vasopressin, localize to axons (Jirikowski et al., 1990; Trembleau et al., 1995; Prakash, 1997).
It has been shown that mRNAs encoding capsaicin and κ-opioid receptors are transported to the processes of sensory neurons (Tohda et al., 2001; Bi et al.,
2003), thus mRNA transport and local receptor synthesis may be involved in sensitization and nociception.
It has been shown that altered mRNA transport and translation lead to devastating consequences, as mental retardation or neurodegenerative disease, such as amyotrophic lateral sclerosis (Liu-Yesucevitz et al., 2011; Ramaswami et al., 2013; Alami et al., 2014).
Fragile-X mental retardation protein is an mRNA transporter protein, that also acts as a negative regulator of translation, by repressing the translation of the cargo mRNA during transport. Mutations in the human FMRP-coding gene (Fmr1) cause fragile X mental retardation, a disease characterized by intellectual disability, disruptive and autistic-like behavior, epileptic seizures and language deficits (Darnell et al., 2001, 2011; Dictenberg et al., 2009). Mutations of mTORC1 cause upregulated translation, associated with autism (Kelleher and Bear, 2008) and Down-syndrome (Troca-Marín et al., 2012).
Taken together, mRNA transport and spatially precise protein synthesis is of high importance for growth cone guidance, neuron maintenance, survival, synapse formation, long-term potentiation, memory formation and nociception.
12
Subcellular transcriptome analysis in neurons
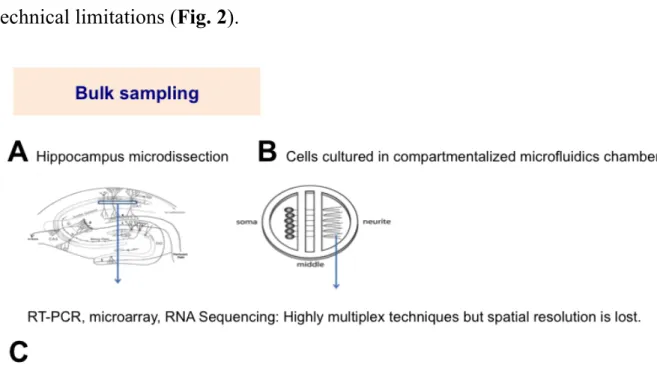
Comparative subcellular transcriptome analysis of neurons has faced many technical limitations (Fig. 2).
Figure 2. Schematic of the currently available techniques for the study of mRNA compartmentalization in neuronal cells. Bulk neurite samples can be
collected by A. dissecting specific brain areas that have very ordered neuron arrangement or by B. culturing neurons in compartmentalized microfluidics chambers and harvesting the neurite compartment. The bulk sample can be used to prepare RNA for RT-PCR, microarray or RNA Sequencing analysis. Thus, expression values can be obtained for several thousand genes at the same time, but spatial resoluation is lost. Image courtesy: Wikipedia. C. In situ hybridization can reveal the precise spatial location of transcripts. However, it can be used to study only a few genes at a time, thus cannot be multiplexed.
Multiplexed mRNA localization data can be obtained by RT-PCR, microarray or more recently, RNA sequencing. To detect genes specific for axon or dendrite, the processes must be separated from the soma. This can be achieved either by culturing neurons in compartmentalized chambers (Gumy et al., 2011; Minis et al., 2014), microdissection of specific brain areas where the cells have highly ordered, uniform arrangement, e.g. the CA1 region of the hippocampus (Cajigas et al., 2012), or by laser microdissection and glass micropipette aspiration of neurites of cultured neurons (Crino and Eberwine, 1996; Poon et al., 2006; Zivraj et al., 2010b; Francis et al., 2014). Although, these isolation methods have the advantage of the ability to detect several thousands of mRNA species at the same time, their major drawback is that bulk input sample is used. This way, information about mRNA composition of individual cells, and spatial resolution is lost. Fluorescent in situ hybridization using RNA probes is capable of resolving the accurate localization of mRNA species. However, this method cannot be used on live cells, and is capable of detecting only a few genes at a time.
In addition, previous studies used different cell types for axonal and dendritic transcriptome analysis, making data comparison very difficult. Thus, previously, there was no available method for multiplexed, neurite transcriptome analysis at the single-cell-level.
14
Nanopipette technology
To address the challanges of subcellular transcriptome analysis, our group has recently developed a label-free, single-cell nanobiopsy platform.
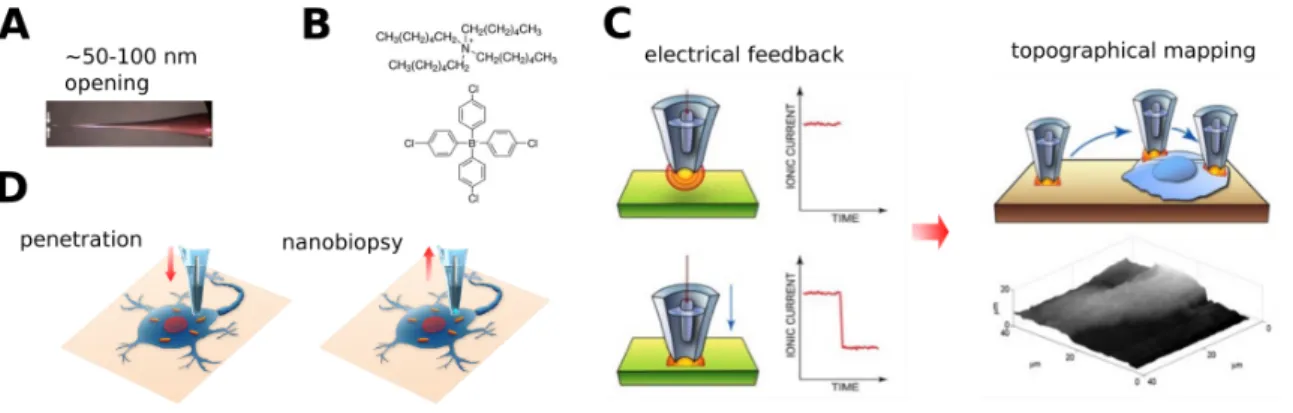
Figure 3. Schematic of the nanopipette setup and the application for single-cell sampling. A. Nanopipettes are fabricated from quartz capillaries to produce
a tip diameter of ~100 nm. B. The nanopipettes are then filled with a solution of of 1,2-dichloroethane (DCE) containing tetrahexylammonium tetrakis-(4-chlorophenyl)borate (THATPBCl). C. Nanopipettes are connected to an electrical circuit involving the cell culture medium and are used as a Scanning Ion Conductance Microscopes (SICM) to map the cell topography by measuring the electrical feedback. D. Our custom-coded control software enables automatic cell surface finding, penetration and aspiration of cellular material through electrowetting. The aspiration volume corresponds to ∼1% of cell volume.
I fabricate nanopipettes from quartz capillaries to produce nanopipettes with a diameter of ~100 nm (Fig. 3A). The nanopipettes are then filled with a solution of of 1,2-dichloroethane (DCE) containing tetrahexylammonium tetrakis-(4-chlorophenyl)borate (THATPBCl) (Fig. 3B), a salt with large organic functional groups. The nanopipettes are then connected to an electrical circuit involving the cell culture medium. I use the nanopipette as a Scanning Ion Conductance
Microscope (SICM) to map the cell surface by measuring the ion current flowing through the nanopipette (Fig. 3C).
Since the nanopipette backfilling solution is not miscible with the cell culture medium due to its apolarity, we can take advantage of the phenomena of electrowetting in small capillaries. By applying different voltage to the electrode we can change the surface tension of the liquid. The change in the surface tension results in the curvature of the nanopipette solution, and aqueous solution can enter the pipette. Thus, by applying different voltage we can aspirate material into the nanopipette. Our group wrote a control software enabling automatic cell surface finding, penetration and aspiration of cellular material through electrowetting (Fig. 3D). From electron microscopic measurements and geometrical calculations this volume was estimated to be ∼50 fL, which corresponds to ∼1% of the volume of a cell. This method of sampling causes minimal disruption of the membrane and cellular milieu such that cell viability is maintained, and thus several samples can be collected repeatedly from the same cell (Actis et al., 2014).
16
In this study, my objective was to use the nanobiopsy platform developed by our laboratory to extract samples from the soma and neurites of human Induced Pluripotent Cell-derived iCell® Neurons, and analyze the mRNA pool by multiplex RNA Sequencing (Fig. 4).
Figure 4. Outline of the objective of this study. My purpose is to extract
several miniscule cytosolic samples from the cell body and neurites of human neurons using nanopipette technology and analyze the mRNA by RNA Sequencing. After RNA-Sequencing read alignment, I will compare the transcriptomes of neuron cell bodies and neurites and I will analyze the elaborate subcellular distribution of mRNA by comparing the mRNA composition of small subcellular samples.
Due to the minute volume of a nanobiopsy sample, it was possible to extract cytoplasm from multiple locations in one cell. I aimed to compare the
18
transcriptomes of neuron cell bodies and neurites, and to demonstrate the functional difference between the two subcellular compartments. I also intended to study the elaborate pattern of mRNA compartmentalization in neurons by comparing the mRNA composition of small subcellular samples. This analysis may shed light on how neurons take advantage of compartmenatlizing specific mRNA molecules to small subcellular areas and how that may contribute to the fast, local responses to extracellular signaling or metabolic changes, contributing to the establishment of neuron cell polarity, synapse development and neuronal cell network formation.
20
Neuronal Cell Culture
The neuronal cells cultured for this study were hiPSC-derived neurons (iCell Neurons) obtained from Cellular Dynamics International (Madison, WI). The cryopreserved cells were a more than 95% pure population of GABAergic and glutamatergic neurons, with less than 1% of dopaminergic neurons (CDI, Madison, WI). Cells were plated at 20,000 cells/cm2 density in 3.5 cm diameter,
CELLview™ Cell Culture Dishes (Greiner Bio-One GmbH, Rainbach im Mühlkreis, Austria) pre-treated with 0.05% poly-ethylene-imine (PEI) (Sigma-Aldrich, St. Louis, MO) for 1h and coated with 5.0 µg/ml laminin (Sigma-Aldrich, St. Louis, MO) for 1h. Cells were grown in media provided by Cellular Dynamics supplemented with 1% PenStrep (Lonza, Basel, Switzerland), at 37°C, with 5% CO2/95% air. To better visualize axons, the cells were
transfected with pEGFP-c1-Tau (Kan resistance) plasmid using GeneJuice® transfection reagent (Merck Millipore, Billerica, MA), according to manufacturer’s instructions. The plasmid was a generous gift of Steve Finkbeiner's laboratory from the Gladstone Institute at UCSF.
Electrowetting in Nanopipettes
Nanopipettes were fabricated as previously described (Actis et al., 2014). Briefly, nanopipettes with a mean diameter of 106 ±16 nm were made from quartz capillaries (Sutter Instrument, Novato, CA) using a P-2000 laser puller (Sutter Instrument, Novato, CA). Quartz nanopipettes were filled with a 10 mM
tetrahexylammonium tetrakis-(4-chlorophenyl)borate (THATPBCl) solution in 1,2-dichloroethane (DCE). An Ag/AgCl wire was then inserted into the barrel of the nanopipette, and an Ag/AgCl wire was submerged in the media of the cell culture acting as a reference electrode.
SICM Setup
The scanning ion conductance microscope was set up as described previously (Actis et al., 2014). The scanning ion conductance microscope (SICM) consisted of an Axopatch 200B low-noise amplifier (Molecular Devices, Sunnyvale, CA) for nanopipette bias and current measurement. The nanopipette was spatially manipulated with a MP-285 micromanipulator (Sutter Instrument, Novato, CA) for coarse control and with a Nano-piezo actuator (Physik Instrumente, Irvine, CA) for fine control. A PCIe-7851R Field-Programmable-Gate-Array (FPGA) (National Instruments) was used for hardware control of the system. A custom-coded software written in LabVIEW(National Instruments) was used to operate the system, enabling automatic cell surface finding, penetration and collection of cellular material. The volume of aspirated cellular material was ∼50 fL, which corresponded to ∼1% of the total volume of an average cell.
22
RNA-seq; cDNA Synthesis and Sequencing
cDNA was synthesized from aspirated RNA samples using the ultra low RNA input SMART-Seq system (Takara Bio USA, Mountain View, CA). The cDNA was prepared for each individual nanobiopsy for library preparation. All samples were supplemented with 0.5 µl 1:5,000 diluted ERCC Spike-In Mix 1 (Ambion) for quality control. cDNA was amplified by KAPA HiFi HotStart ReadyMix PCR Kit (KAPA Biosystems, Wilmington, MA), using SMART-Seq PCR primers. cDNA was purified by AmPure XP beads (Beckman Coulter Genomics, Danvers, MA). The quality and quantity of single-aspiration cDNA was assessed using the Agilent Bioanalyzer 2100 High Sensitivity DNA Assay (Agilent, Palo Alto, CA).
Tagmentation of cDNA for the preparation of RNA-Seq libraries was performed by Nextera XT DNA Library preparation kit (Illumina, San Diego, CA). Multiplexed sequencing adapters were ligated to tagmented cDNA by limited-cycle polymerase chain reaction (10 limited-cycles), according to manufacturer's instructions. The final, amplified libraries were purified by AmPure XP beads (Beckman Coulter Genomics, Danvers, MA), and size-selected in the range of 200-600 bp using the Caliper LabChip XT system (PerkinElmer, Waltham, MA). The final RNA-Seq libraries were quantified using the Agilent Bioanalyzer 2100 High Sensitivity DNA Assay and KAPA Library
Quantification Kit. The pooled, multiplexed libraries were sequenced for 2 × 150 bp paired-end or 2 × 80 bp paired-end reads on Illumina MiSeq (Illumina, San Diego, CA).
RNA Sequencing Read Mapping
RNA-seq reads were aligned to the hg38 UCSC human reference genome using STAR aligner (Dobin et al., 2013). Genes were scored positive for expression if at least one read mapped uniquely to an annotated transcript. Gene expression was quantified using HTSeq (Anders et al., 2014). Venn diagrams were created by the BioVenn web application (Hulsen et al., 2008).
Gene Ontology Enrichment Analysis
Gene Ontology Enrichment Analysis was performed using the DAVID Functional Annotation tool (Huang et al., 2008). Relevant Gene Ontology (GO) terms were visualized as tree-maps using the REVIGO server (Supek et al., 2011).
Self-organizing Maps
Self-organizing Maps can be used to reduce the dimensionality of a large gene expression dataset. This machine learning-based technique can be used to visualilly examine the transcriptome of each nanobiopsy sample.
Self- 24
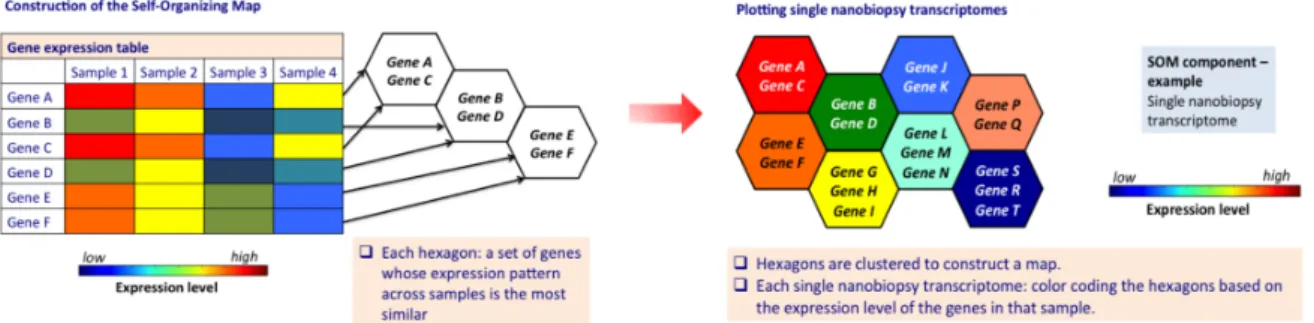
organizing maps (SOM) were constructed as described (Kim et al., 2015), (Fig. 5). Before constructing the Self-Organizing Map, each gene expression value was normalized on a gene-by-gene basis by subtracting each gene expression mean and dividing by its standard deviation across libraries. A self-organizing map was trained with the 1,000 genes of the highest variance among the nanobiopsy samples, using the R package ‘‘kohonen’’(Wehrens and Buydens, 2007).
Figure 5. Schematic of gene expression data visualization using a Self-Organizing Map. For the illustration, a small dataset of a few samples and
genes is depicted. Each hexagon represents a set of genes whose expression pattern across samples is the most similar Hexagons are clustered to construct a map and have fixed positions. Each single nanobiopsy transcriptome can be visualized by color-coding the hexagons based on the expression level of the genes in that sample.
The total number of map units (hexagons) was set to 3*sqrt(N), where N corresponds to the number of genes used for the training. Initial values were assigned to the grid by multiplying the first two principal components of the data by a sinusoidal function, and the training lasted 200 epochs. The local minima of the u-matrix was used to seed each cluster, with a value for each
hexagon set as the average of the vector difference between that hexagon’s prototype and its six neighbors on the grid. All other unit prototypes were then given to clusters based on the minimum vector distance to a seed unit. Thus, each hexagon represents a group of genes that have very similar expression patterns to one another. These units are clustered to generate a 2D heatmap, where each unit has fixed position across all single-nanobiopsy components of the SOM, and spatial proximity corresponds to similarity in gene expression pattern. I mapped all expressed genes onto the SOM, and visualized them as components of the SOM using a custom Python code. The lists of clustered genes were submitted to the DAVID Functional Annotation tool (Huang et al., 2008) in order to determine enriched terms.
26
Nanobiopsy sampling of neuronal cells
To study the spatial pattern of mRNA compartmentalization within neuronal cells, I extracted samples from the cell bodies and neurites of human Induced Pluripotent Cell-derived iCell® Neurons using our nanobiopsy platform. I
collected 43 nanobiopsy samples from 33 cells in total, of which 13 samples were derived from cell bodies, and 30 from neurites (Fig. 6, Table 1,
Supplementary Table 1).
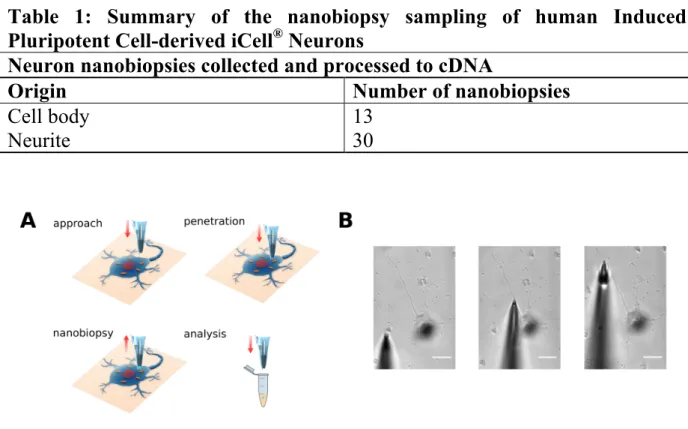
Table 1: Summary of the nanobiopsy sampling of human Induced Pluripotent Cell-derived iCell® Neurons
Neuron nanobiopsies collected and processed to cDNA
Origin Number of nanobiopsies
Cell body 13 Neurite 30
Figure 6. Schematic nanobiopsy sampling of human iPS-derived neuronal cells. A Illustration of automated approach to cell surface, penetration in the cell
cytosol, followed by controlled aspiration of cytoplasmic material by electrowetting B Optical micrographs of a neuronal cell projection nanobiopsy procedure illustrating the cell membrane penetration and aspiration via electrowetting. Two nanobiopsy samples were collected from the same neuronal projection. Scale bars 25 µm.
28
The cDNA was prepared from each individual sample for library preparation. Together, I generated 43 single-nanobiopsy RNA-sequencing libraries. Due to the minute amount of input RNA used, the sequencing depth ranged between 10-2900 mapped reads per nanobiopsy sample (Supplementary Table 2).
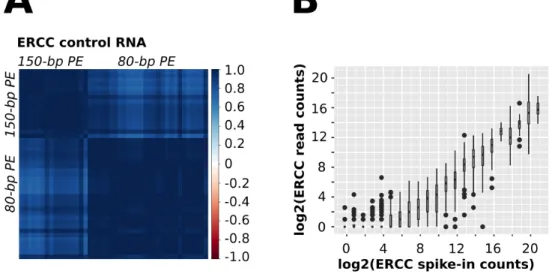
To assess the quality of the sequencing libraries, ERCC RNA Spike-In Mix, a standard mix of poly-adenylated RNAs was added to each sample. After mapping and quantification the ERCC reads, I found that there was a high correlation between the samples, especially the ones that were sequenced in the same batch using the same sequencing kit. This demonstrated the high quality and reproducibility of our RNA Sequencing library preparation (Fig. 7A).
Figure 7: Quality assessment of nanobiopsy RNA Sequencing. A: Pairwise
correlation coefficients calculated for ERCC spike-in controls (Ambion). First round of sequencing: 150-bp paired end Illumina MiSeq sequencing, second round of sequencing: 80-bp paired end Illumina MiSeq sequencing. B: Dose-response curve of ERCC spike-in detection in nanobiopsy samples. Data points are shown as Tukey box plots.
The dose-response curve of ERCC spike-in RNA quantification showed that the lower limit of reliable mRNA detection is around 50-100 mRNA copies (Fig. 7B). Thus, if a nanobiopsy sample contains less than 50-100 copies of a transcript, it is likely that it will not be detected and it will be a false negative. Nanobiopsy sampling targets a very small subcellular region, with practically no contamination from other sources, thus even genes displaying a low number of reads mapped uniquely to an annotated transcript may be scored positive for expression. My negative control sample was an aliquot of cDNA synthesis buffer supplemented with ERCC Spike-in without the addition to nanobiopsy sample (Sample_NC, Supplementary Table 1). Mapping of the RNA Sequencing reads resulted in only 2 reads mapped to human genome (Sample_NC, Supplementary Table 2). Thus, this can be regarded as background noise. On the other hand, my nanobiopsy samples had ~10-2,900 reads mapped to human genome (Supplementary Table 2), proving that these reads, indeed originate from the mRNA sampled from the neuronal cells. I considered genes to have higher expression level if they had at least 4 reads mapped in a nanobiopsy sample. Mapping of the sequencing reads to the human genome identified 10-1000 genes expressed in each sample (Fig. 8A and B,
Supplementary Table 2). This very wide range indicates that the concentration
and/or homogeneity of mRNA transcripts vary greatly depending on the precise subcellular location.
30
Figure 8. Neuronal cell nanosurgery RNA Sequencing read mapping. A, B Histogram of the number of mRNA transcripts mapped by analyzing the
nanobiopsy samples taken from A cell body B neuronal processes of neuronal cells. C The total number of mRNA transcripts detected in all nanobiopsy samples, all cell body and all neurite samples D Schematic illustration of nanobiopsy sampling from neurons and RNASeq analysis using the self-organizing map (SOM). Briefly, the 1,000 genes with the greatest variance among the libraries were used for training a self-organizing map, where each hexagon represents a group of genes whose expression patterns across samples are most similar. These units are clustered and are located in the same positions across all nanobiopsy components of the SOM. Thus in this 2D heat map, spatial proximity corresponds to expression pattern similarity. Each nanobiopsy transcriptome can be visualized as a component of SOM, thus by mapping the
genes expressed onto the SOM. Four representative nanobiopsy transcriptome SOM components are shown for each subcellular compartment.
The total number of genes found in all 43 nanobiopsy samples was 2011, of which approximately ~ 1300 mRNA transcripts were identified in cell bodies and ~ 930 in neuronal processes (Fig. 8C, Supplementary Table 3). The list of the most abundant transcripts based on the number of nanobiopsies in which they were detected can be seen in Table 2.
Previously, other groups have used laser microdissection or aspiration by glass pipette to collect individual neurites from cultured neurons for transcriptome analysis. Zivraj et.al (Zivraj et al., 2010a) used laser-capture microdissection to collect axon segments. After pooling 250 axon segments and microarray analysis, they identified ~5,000 transcripts that localize to axon. Francis et.al. (Francis et al., 2014) used glass micropipette to collect a pool of 100-400 dendrites for microarray analysis, and found ~11,000 genes in dendrites. The advantage of neurite microdissection compared to bulk sampling was that contamination from cell body could be reduced very significantly. The most important difference between microdissection and nanobiopsy sampling is the amount of sample being collected. When hundreds of whole neurites are dissected and pooled, a large amount of input material is present, therefore a high number of transcripts can be identified.
32
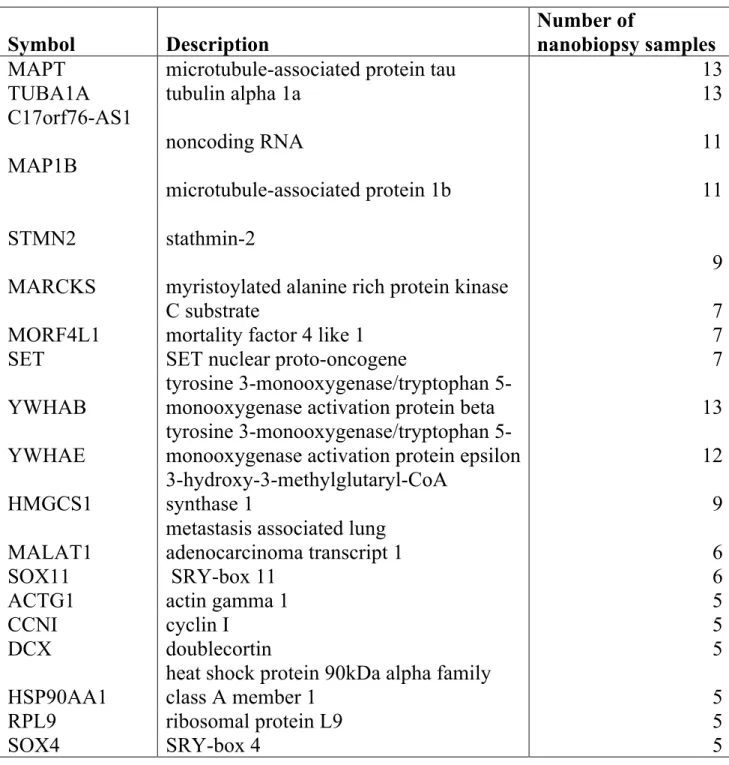
Table 2: The most abundant transcripts in neuronal cells based on the number of nanobiopsy samples in which they were found.
The total number of nanobiopsies was 43.
Symbol Description
Number of
nanobiopsy samples
MAPT microtubule-associated protein tau 13 TUBA1A tubulin alpha 1a 13 C17orf76-AS1 noncoding RNA 11 MAP1B microtubule-associated protein 1b 11 STMN2 stathmin-2 9 MARCKS myristoylated alanine rich protein kinase
C substrate 7
MORF4L1 mortality factor 4 like 1 7 SET SET nuclear proto-oncogene 7 YWHAB
tyrosine 3-monooxygenase/tryptophan
5-monooxygenase activation protein beta 13 YWHAE
tyrosine 3-monooxygenase/tryptophan
5-monooxygenase activation protein epsilon 12 HMGCS1
3-hydroxy-3-methylglutaryl-CoA
synthase 1 9
MALAT1
metastasis associated lung
adenocarcinoma transcript 1 6
SOX11 SRY-box 11 6
ACTG1 actin gamma 1 5
CCNI cyclin I 5
DCX doublecortin 5
HSP90AA1
heat shock protein 90kDa alpha family
class A member 1 5 RPL9 ribosomal protein L9 5
SOX4 SRY-box 4 5
A single nanobiopsy, however, collects approximately 1% of the volume of a cell. This enables us to collect samples from very small, targeted area. The number of transcripts sequenced is smaller compared to microdissection
sampling, but we can get a much higher spatial resolution. In addition, the cell viability does not decrease after the procedure, allowing us to collect multiple small samples from the same cell.
I analyzed this high dimensional data using a self-organizing map (SOM), described by Kim et al. (2015). The SOM provides an intuitive way to visualize and examine the particular repertoire of genes in each nanobiopsy sample. I mapped 2011 genes onto a SOM, where each hexagon represents a set of genes whose expression patterns are most similar to one another. These units are clustered and are located in the same positions across all nanobiopsy components of the SOM. Thus in this 2D heat map, spatial proximity corresponds to expression pattern similarity. Each nanobiopsy transcriptome was visualized as a component of SOM (Fig. 8D, four representative nanobiopsy components shown for each cellular compartment type).
Nanobiopsy is an unbiased and sensitive way of neurite transcriptome sampling
Nanobiopsy can sample repeatedly from cell bodies and neurites of the same cell, and since we can collect sample from a very small subcellular area, the transcript sets do not need to undergo any data filtering. To examine the sensitivity of nanobiopsy sampling, I compared the mRNA repertoire in my nanobiopsy samples to all genes detected in axon or dendrite by bulk microarray
34
analysis, RNA sequencing, and in situ hybridization in previous studies (Fig. 9A, Supplementary Table 4.)
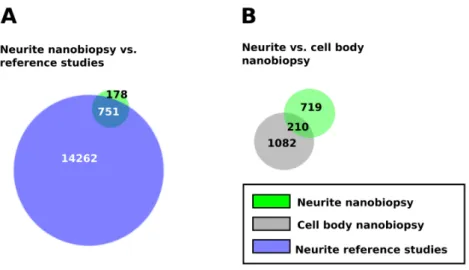
Figure 9. Nanobiopsy sampling/RNA-seq is able to collect and identify rare transcripts that are not detected via bulk sampling methods
A Venn diagram of the genes detected by neurite nanobiopsy, and the genes
identified in axon and dendrite by previous bulk microarray, RNA Sequencing or in situ hybridization studies B Venn diagram of the genes detected by cell body and neurite nanobiopsy of neuronal cells. References in A: (Jirikowski et al., 1990; Crino and Eberwine, 1996; Steward and Schuman, 2001; Brittis et al., 2002; Eberwine et al., 2002; Moccia et al., 2003; Muslimov et al., 2004; Zhong et al., 2006; Lein et al., 2007; Willis et al., 2007; Bramham and Wells, 2007; Andreassi and Riccio, 2009; Hengst et al., 2009; Merianda et al., 2009; Taylor et al., 2009; Kuwako et al., 2010; Aschrafi et al., 2010; Zivraj et al., 2010b; Gumy et al., 2011; Cajigas et al., 2012; Ainsley et al., 2014; Kratz et al., 2014; Minis et al., 2014; Pfeiffer-Guglielmi et al., 2014; Francis et al., 2014; Shigeoka et al., 2016). All Venn diagrams area proportional; the labels indicate the number of genes.
Sampling from 30 neurites enabled the identification of 929 transcripts that localize to neuronal processes. Although the total number of genes was smaller compared to bulk sampling, I found 178 transcripts in neurites that were not detected in previous studies (Fig. 9A, Supplementary Table 4). When
performing bulk sampling the relative number of rare transcripts is very low, partly because the fragments can be lost during purification steps, and their sequencing read signal intensities may be regarded as noise. Our nanobiopsy platform can collect a miniscule amount of cytosolic material and a rare transcript could be present in a relatively higher amount in a smaller sample. Nanobiopsy samples are directly reverse transcribed and the cDNA is amplified, without cell lysis or RNA purification steps, thus further reducing the loss of rare transcripts.
The new discovered transcripts localizing to neurites belong to various functional categories, such as neuron development, immune system, cell signaling and even proteins annotated as nuclear. Some of the new genes I found encode proteins involved in immune response. My highly sensitive nanobiopsy sampling of neuronal cells has shown for the first time that the mRNA encoding the Toll-like receptor 5 (Tlr5) are part of the mRNA repertoire of neurites. I was surprised to see that many of the new transcripts I sampled from neuronal processes encode proteins that function in the nucleus. This includes transcription factors, which are important in nervous system development, such as EOMES Nanobiopsy sampling has also shown that mRNA encoding many histone-remodeling enzymes are transported to neurites as well; such as the lysine demethylase Kdm5c, and general constituents of the DNA replication or the transcription machinery such as the double-stranded DNA unwinding protein
36
HMGB3, the Mini-chromosome maintenance binding protein MCMBP and the transcription elongation factor TCEAL7. There is very little known about the function of nuclear proteins that are synthesized or transported to the peripheral areas of neurons. My report is the first to show that transcripts encoding DNA-unwinding or histone remodeling proteins are part of the mRNA repertoire of neurites.
The cell body is a transport hub of neuronal mRNA and protein compartmentalization
I next compared the list of genes I identified in the cell body and neurite nanobiopsy samples (Fig. 9B, Supplementary Table 5). The two gene sets showed little overlap ( ~200 genes) demonstrating the functional difference between the two subcellular compartments. To get a general overview of the repertoire mRNAs that localize to neuronal cell bodies I analyzed the pooled expression data from all cell body nanobiopsy samples (13 samples, 1292 genes). (Fig. 10A, Table 3, Supplementary Table 6,). This gene set was significantly enriched for the Gene Ontology (GO) terms ”Cellular localization” (p-val: 2.23E-26), “Intracellular transport” (p-val: 9.66E-22) and “Cellular protein localization” (p-val: 1.17E-20).
Table 3: Gene Ontology Enrichment analysis of all transcripts identified in all nanobiopsy samples taken from cell bodies and neurites of human iPS-derived neuronal cells
Cell body P-val Neurite P-val
Cellular localization 2.23E-26 Translation initiation 3.83E-15 Intracellular transport 9.66E-22 Nuclear transcribed mRNA catabolic process, nonsense mediated decay 5.66E-14 Cellular protein localization 1.17E-20 Establishment of protein localization to endoplasmic reticulum 7.52E-14 Translational initiation 3.97E-14 Cellular localization 2.32E-11 Cellular component biogenesis 2.34E-13 Cellular component biogenesis 2.34E-11 Cytoskeleton organization
2.64E-11 mRNA metabolic process
4.96E-11
RNA processing 1.76E-11
301, 206 and 274 genes were annotated to these three GO terms, including mRNA encoding the microtubule tethering protein HOOK3, the anchoring protein AKAP12, which regulates the subcellular compartmentation of protein kinase A (PKA) (Radeva et al., 2014), the GABA(A) receptor-associated protein
38
(GABARAP), as well as the RNA-binding protein RANBP1. The Gene Ontology (GO) term “Cellular component biogenesis” was also significantly enriched (p-val: 2.34E-13). 288 genes were annotated to this term, the big majority of them are cytoskeletal or nuclear proteins, including components of the microtubule cytoskeleton or chromatin. Additionally, cell-body transcripts exhibited strong upregulation of genes involved in translational initiation
(p-val: 3.97E-14) and RNA processing (p-(p-val: 1.76E-11).
When I looked at the genes that had at least 4 reads mapped uniquely to an annotated transcript (259 genes), thus can be considered higher expression level, “Neuron projection development” (p-val: 4.25E-7) was the most highly enriched GO term, followed by “Microtubule-based process” (p-val: 1.08E-5) (Fig. 10B, Table 4, Supplementary Table 6). Genes involved in neuronal projections
development include Rtn4, a developmental neurite growth regulatory factor and
Stmn2 that controls neurite length in neuronal cells.
Taken together, my data suggest that the neuron cell body is mainly involved in regulating gene expression, synthesizing mRNA and proteins, transporting and redistributing them to the neurites, creating a complex, modular, fine-tunable supply network for axon and denrites.
40
Figure 10. The cell body is a transport hub of neuronal mRNA and protein
compartmentalization. Neurites are enriched for mRNA encoding genes related to mRNA processing and translation.
Gene Ontology Enrichment analysis of all transcripts identified in all nanobiopsy samples taken from human iPS-derived neuronal cells. A: cell body genes B: cell body genes that had at least 4 reads mapped to human genome
C: neurite genes. Gene Ontology (GO) terms were visualized as a treemap using the REVIGO server.
Table 4: Gene Ontology Enrichment analysis of all transcripts that had at least 4 reads mapped to the human genome in cell body nanobiopsy samples taken from human iPS-derived neuronal cells
Cell body P-val
Neuron projection development
4.25E-7 Nervous system development 1.78E-6 Microtubule-based process 1.08E-5 Neuron differentiation 1.58E-5
The neurite mRNA repertoire is enriched in transcripts related to mRNA processing, protein synthesis and transport
To get a general comparison of the mRNA profile of the neuronal processes I examined the pooled expression data from all neurite nanobiopsy samples (30 samples, 932 genes) (Fig. 10C, Table 3, Supplementary Table 6). I found that neurite transcripts are highly enriched for Gene Ontology (GO) categories related to protein synthesis, such as “Translational initiation” (p-val: 3.83E-15). 40 genes were annotated to this GO term, including genes encoding ribosomal
proteins. Neuronal processes also showed enrichment for the GO term “mRNA metabolic process” (p-val: 4.96E-11). 73 genes mapped to this GO term, including the mRNA splicing gene Ddx5. Furthermore, neurites showed enrichment for the Gene Ontology terms “Establishment of protein localization to endoplasmic reticulum” val: 7.52E-14) and “Cellular localization”
(p-val: 2.32E-11). 29 and 190 genes mapped to these GO terms, including genes
involved in microtubule-mediated transport or protein targeting to ER.
mRNA shows a mosaic pattern of localization in neuronal cells
To get a deeper insight into the spatial dynamics of mRNA compartmentalization/distribution in neuronal cells, I analyzed single-nanobiopsy components of the SOM (Fig. 11). As the amount of cytosolic material collected during each biopsy sampling is only about 1% of the cell’s total volume, we could compare very small segments of the cellular space to each other. Nanobiopsy samples showed great variability in terms of the number (Fig. 8A-B) and the identity of transcripts (Fig. 11) they contained. This indicated that the cellular mRNA pool cannot be considered well-mixed and homogeneous, and that subcellular areas fundamentally differ from each other in terms of their mRNA composition. The two most commonly found gene clusters (Cluster 1 and Cluster 2) (Supplementary Table 7) did not show any significant enrichment for any Gene Ontology term. These clusters included genes such as the large ribosomal subunit protein Rpl8, the DNA-unwinding protein Hmgb3,,
42
the mitochondrial import inner membrane translocase subunit Timm10 or the E3 ubiquitin ligase complex substrate adapter protein Keap1.
mRNAs encoding functionally related proteins often localize to the same subcellular place
To dissect the functional significance of the elaborate mRNA compartmentalization pattern in neuronal cells, I examined the gene clusters that showed similar expression patterns across samples (Fig. 11,
Supplementary Table 7). Most gene clusters contained functionally unrelated
trancripts. However, I was surprised to see that a subset of the gene clusters were enriched for a common Gene Ontology (GO) term
(Supplementary Table 8). Cluster 4, found in one cell body nanobiopsy sample
was significantly enriched for the GO term “Intracellular transport”
(p-val: 4.29E-11). 120 genes were annotated to this GO term, including the
Kinesin-like protein Kif13a (Nakagawa et al., 2000), or the protein transport gene Sec24d (Pagano et al., 1999). Cluster 3, another cell body nanobiopsy sample, showed enrichment for the GO term “Protein dephosphorylation”
(p-val: 1.31E-3). Seven protein phosphatases mapped to this GO term, including Ptprb (Ratcliffe et al., 2000) and Dusp1 (Tanoue et al., 2001). Cluster 7, found
in one of the neurite nanobiopsy samples showed enrichment for the GO term “Respiratory electron transport chain” (p-val: 4.44E-7).
Figure 11. Analysis of mRNA compartmentalization pattern in neuronal cells by nanobiopsy sampling and RNASeq analysis using the Self-Organizing Map
The Self-Organizing map consists of units representing a group of genes whose expression patterns across samples are most similar. The units are clustered and
44
have fixed positions across all nanobiopsy components of the SOM. Individual nanobiopsy transcriptomes can be plotted by mapping the genes expressed in the sample onto the SOM. Gene clusters are defined as groups of units that are next to each other, and are often co-expressed in cells. Above, representative single-nanobiopsy transcriptomes depicted as individual components of the self-organizing map (SOM) are shown. Boxes represent individual nanobiopsy samples taken from A neuronal cell bodies or B neurites. Gene clusters are outlined in grey.
Five mitochondrial genes were annotated to this term, including NADH-dehydrogenase subunits and Cytochrome c-oxidase subunits. Cluster 14, found in another of the neurite nanobiopsy samples showed significant enrichment for the GO term “Translational initiation” (p-val: 7.60E-6). Nine genes were annotated to this GO term, including the ribosomal proteins Rpl39, Rpl10, Rpl11 and Rpl7. Overall, these results suggest that neuronal cells take advantage of sophisticated mRNA-transport mechanisms to establish defined mRNA compartmentalization patterns to fine-tune the molecular functions of the subcellular segments in response to extracellular stimuli.
46
My analysis has shown that the repertoire of mRNAs that localized to neuronal cell bodies is highly enriched for genes related to intracellular transport
including genes regulating cytoskeleton organization, protein and RNA-transport, vesicle trafficking and transcription activation. This indicates the importance of distributing the mRNA and protein to the peripheral sites of the neuronal cell through highly regulated and sophisticated transport mechanisms.
The neurite transcriptome was highly enriched for genes related to protein synthesis, protein targeting to ER, ribosome biogenesis, and RNA metabolism. It has been reported before that neuronal growth cones respond to attractive (BDNF, netrin) and repulsive (SEM3A, SLIT2B) guidance cues by regulating the local translation of the cytoskeletal protein β-actin and the actin cytoskeleton remodelling proteins cofilin and RhoA (Campbell and Holt, 2001; Piper et al., 2006; Yao et al., 2006). Newly synthesized β-actin has higher polymerization ability compared to old, covalently modified β-actin, thus, it significantly affects growth cone dynamics (Condeelis and Singer, 2005). Neurotrophic factors also induce the axonal translation of Bclw that prevents axonal degeneration and promotes axon maintenance (Cosker et al., 2013). Following neuron injury, local translation is required for neurite regeneration (Verma et al., 2005). Taken together, regulating local translation of mRNA and regulation of protein levels is one of the major ways that axons respond to extracellular stimuli, and maintain a physiologically accurate composition.
My highly sensitive nanobiopsy sampling approach enabled the detection in neurites of ~200 very low expression level transcripts that could not be found by using previously employed bulk sampling methods. To my great surprise, many of these transcripts encode nuclear proteins, such as the transcription factor EOMES, the double-stranded DNA unwinding protein HMGB3, the Mini-chromosome maintenance binding protein MCMBP and the transcription elongation factor TCEAL7..
Although unexpected, there is a growing body of evidence indicating the presence of transcripts encoding nuclear proteins in axons and dendrites. Nuclear genes can have additional functions, unrelated to nucleus. The nuclear scaffolding protein Lamin B2 is translated in axons, where it binds mitochondria, and is required for the maintenance of axonal integrity (Yoon et al., 2012). Some transcription factors (e.g. CREB and SMAD 1/5/8) are translated in axons following neurotrophic factor stimulation or injury, retrogradely transported to nucleus and act as transcription factors to promote neuron survival (Cox et al., 2008; Ji and Jaffrey, 2012). Up to now there was only limited evidence showing the importance of the dendritic synthesis of transcription factors in the dendrite-soma signaling (Crino et al., 1998; Barrett et al., 2006). Ainsley et al. have shown that H4 histone and Mediator complex member mRNAs are localized to dendrites (Ainsley et al., 2014). Thus, transcription factors synthesized in the periphery and interacting with the local
48
signaling environment may carry some unique information or function, allow a local response, and contribute to the synapse-axon-nucleus signaling axis. In addition, the time delay required for these transcription factors to be translated in the axon and retrogradely transported to the nucleus may be an essential part of the temporal dynamics of neuronal cell physiology. Alternatively, the signal for transport to the nucleus may depend upon other environmental cues encountered at the periphery. Thus, my study can help establish the comprehensive list of nuclear genes that localize to neurites and help us shed light on the possible function of these genes.
I have also definitively shown that the neuronal mRNA pool cannot be considered well-mixed and homogeneous, in that subcellular areas fundamentally differ from each other in terms of their mRNA composition. This is in agreement with a previous study showing that in Drosophila embryos > 70% of the mRNA transcripts analyzed appeared to be regionally distributed (Lécuyer et al., 2007). Nanobiopsy samples showed great variability in the number and the kind of transcripts they contained. Analyzing gene clusters that showed similar expression pattern across samples I found that some gene clusters showed functional enrichment. For example, mRNAs encoding genes related to cytoskeleton remodeling or protein translation localized to the same subcellular space. Recent reports have shown the presence of translationally active hotspots in cells (Katz et al., 2016; Wang et al., 2016; Yan et al., 2016),
and that in primary neurons, mRNAs display “bursting” translation (Wu et al., 2016). Translation machinery components are often anchored to the plasma membrane and are being relaesed upon activation of transmembrane receptors and initiation of local signalling, enabling local translation of mRNA (Tcherkezian et al., 2010). Furthermore, proteins synthesized at distal sites are more likely to be rich in assembly-promoting domains and are often regulated by posttranslational modification sites (Weatheritt et al., 2014). Thus, compartmentalizing mRNAs encoding proteins of related function to the same subcellular area can contribute to the coordinated, local synthesis of these proteins, and the formation of cellular multi-protein assemblies in response to extracellular stimuli. Some sequence motifs located in the 3’UTR, 5’UTR, intron or coding sequence of an mRNA as well as RNA-binding proteins regulating the transport of mRNAs to neuronal processes have been identified (Jung et al., 2012a; Gomes et al., 2014; Taliaferro et al., 2016). However, the mechanisms by which most of the several thousand mRNAs that localize to neuronal axons and dendrites are transported are still unkown.
50
Neurons are highly polarized cells that take great advantage of compartmentalizing mRNA and locally translating it wherever and whenever it is needed. To examine the pattern of mRNA compartmentalization in neuronal cells, I extracted miniscule cytosolic samples from cell bodies and neurites using my label-free, single-cell nanobiopsy platform, prepared the cDNA and performed Next Generation RNA-Sequencing. My easy-to-operate, flexible platform allowed me to sample from any subcellular compartment of neural cells with high spatial resolution and precision. Due to the minute volume of a nanobiopsy sample, it was possible to extract cytoplasm from multiple locations in one cell. I collected 43 nanobiopsy samples in total and identified more then 2000 transcripts.
I found that the subcellular mRNA pools showed great mosaicity, and that cell regions are fundamentally different from each other in terms of their mRNA composition. Neuronal cell bodies showed enrichment for transcripts encoding proteins involved in transcriptional regulation and protein transport, while neurites were enriched in genes related to protein synthesis, protein targeting to endoplasmic reticulum (ER), and mRNA metabolism. In addition to the previously identified transcripts, I report a new set of mRNAs that specifically localize to neurites, including mRNAs encoding proteins that were previously believed to localize exclusively to the nucleus such as EOMES and HMGB3.
52
My nanobiopsy sampling and analysis revealed that neuronal cells take advantage of sophisticated mRNA-localization mechanisms to establish defined mRNA compartmentalization patterns. This allows neuronal cells to fine-tune the molecular functions of the subcellular segments according to an endogenous program as well as in response to extracellular stimuli. Here I provide evidence that single-neuron nanobiopsy studies can deepen our understanding of mRNA compartmentalization and open the possibility to study the molecular mechanism for specific neuronal functions, cellular circuitry, neuronal growth, and network formation.
Nanopipette technology can be used for further probing of neuronal cell function and connectivity. Since we collect miniscule samples, we can easily target very specific subcellular areas. For instance, we can label a protein of interest with a fluorescent tag, sample the fluorescent spots by nanobiopsy, and prepare RNA-Sequencing libraries to identify the RNAs that bind to the protein of interest. This protein can be a constituent of RNA-binding granules or it can have other function influencing the storage, stability, transport or translation of RNA. Nanopipette sampling causes minimal damage to the cell, the cell stay alive after sampling, thus we can collect several samples from the same cell. This allows us to track the same cell over time. For example, we can collect samples from neurite terminals at different stages of synapse maturation: from the neurotrophic factor-induced growth of the neurites, to the establishment of
synapses until the maturation and strengthening of the synapse by long-term potentiation. This way, we can follow what kinds of changes in the RNA composition occur at the synapse during maturation. We can sample from both the pre- and post-synaptic cells of the same synapse, thus we can follow the maturation of both the pre- and post-synaptic cells.
Nanobiopsy sampling coupled with the temporal analysis of a single cell can be also applied to study the differentiation of iPS cells to neurons. We can analyze the mRNA composition of the same cell during various stages of differentiation, thus we can decipher what determine what determines the success of differentiation and what are the branching points where cells choose alternative differentiations paths.
The above analysis can also be applied to study stem cells derived from patients with genetic disorders, mental dieseases or neurodegenerative diseases. We can use nanopipette to sample from these cells, compare to cells derived from healthy patients and to analyze differentiation defects. Furthermore, by sampling from neurite terminals, we can get a deeper insight into why the cells of these patients cannot develop properly functioning synapses.
We can use nanopipette to sample individual mitochondria and sequence mitochondrial genome as well. Thus, we can analyze the frequency of mitochondrial genome mutations in healthy and disease patient-derived neuronal cells. We can also decipher how the mutation of mitochondrial genome affects
54
the synthesis of mitochondrial genes and how it changes the function of the mitochondria. This can shed light on the mechanism of neurological disorders caused by mitochondrial genome mutation.
We can also modify the quartz surface of the nanopipette by functionalizing it with small molecules or antibodies. These functionalized nanopipettes can bind specific subcellular analytes, e.g. glucose, metal ions, proteins. Upon binding of the target molecule, the current flowing through the nanopipette changes, thus the nanopipette can be used as a sensor. We can then combine sensing and RNA sampling by first measuring the subcellular concentration of our target molecule in live cells, and then sample and analye RNA by RNA-Sequencing.
Taken together, nanopipette technology is an easy-to-use, precise, highly sensitive and flexible platform that allows us to collect miniscule cytosolic samples from live cells and analyze gene expression and mRNA compartmentalization with unparalled spatial and temporal precicision. I sincerely hope, this technology will be later implemented to study RNA expression and transport in cells derived from patients suffering from neurological disorders and that it will contribute to our understanding of these conditions.
56
I acknowledge the University of Tsukuba and Human Biology Program for providing me the chance to complete my Doctoral Studies.
I would like to express my sincere gratitude to Prof. Akiyoshi Fukamizu for supervising me and for his continuous support and patience.
My sincere thanks goes to Prof. Nader Pourmand (University of California at Santa Cruz) for teaching me single-cell genomics analysis and for his encouragement.
I would like to extend my gratitude to Prof. Béla Gyurcsik (University of Szeged, Hungary) for teaching me coordination chemistry and for his very insightful questions and expert advice on genomics that contributed to a much improved manuscript and thesis.
I would also like to thank Prof. Tadashi Baba and Kazuko Shibuya, members of my committee for providing me constructive criticism and helping me improve the quality of my dissertation.
I would like to thank Mr Akshar Lohith (University Of California at Santa Cruz) for his continuous help and support with my nanobiopsy and RNA-Sequencing experiments.
I express my sincere gratitude to Dr. Jia Guo and Mr. Manas Mondal (Arizona State University) for helping me with fluorescent in situ hybridization experiments.
I acknowledge Gepoliano Chaves and Thomas Boser (University of California at Santa Cruz) for helping me with bioinformatics analysis. I thank Shirley Pepke and Daniel Kim (California Institute of Technology and University of California at Santa Cruz, respectvely) for their expert advice on constructing Self-Organizing Maps.
I also thank Kazue Okubo (Genostaff, Tokyo), Kenzo Bamba (University of Tsukuba, Japan), Yasu-Yuki Kida, Yuzo Takayama (National Institute of Advanced Industrial Science and Technology, Japan) and Misuzu Hashimoto (University of Tsukuba, Japan) for their helpful discussions.
This work was supported in part by grants from the National Institutes of Health [P01-35HG000205], National Institute of Neurological Disorders and Stroke [R21NS082927], and NIH’s “Follow The Same Cell Prize”.
58
Actis P, Maalouf MM, Kim HJ, Lohith A, Vilozny B, Seger RA, Pourmand N (2014) Compartmental genomics in living cells revealed by single-cell nanobiopsy. ACS Nano 8:546–553.
Ainsley JA, Drane L, Jacobs J, Kittelberger KA, Reijmers LG (2014)
Functionally diverse dendritic mRNAs rapidly associate with ribosomes following a novel experience. Nat Commun 5:4510–4520.
Alami NH, Smith RB, Carrasco MA, Williams LA, Winborn CS, Han SSW, Kiskinis E, Winborn B, Freibaum BD, Kanagaraj A, Clare AJ, Badders NM, Bilican B, Chaum E, Chandran S, Shaw CE, Eggan KC, Maniatis T, Taylor JP (2014) Axonal Transport of TDP-43 mRNA Granules Is Impaired by ALS-Causing Mutations. Neuron 81:536–543 Available at:
http://dx.doi.org/10.1016/j.neuron.2013.12.018.
Anders S, Pyl PT, Huber W (2014) HTSeq—a Python framework to work with high-throughput sequencing data. Bioinformatics 31:166–169.
Andreassi C, Riccio A (2009) To localize or not to localize: mRNA fate is in 3’UTR ends. Trends Cell Biol 19:465–474.
Aschrafi A, Natera-Naranjo O, Gioio AE, Kaplan BB (2010) Regulation of axonal trafficking of cytochrome c oxidase IV mRNA. Mol Cell Neurosci 43:422–430.
Barrett LE, Sul JY, Takano H, Van Bockstaele EJ, Haydon PG, Eberwine JH (2006) Region-directed phototransfection reveals the functional significance of a dendritically synthesized transcription factor. Nat Methods 3:455–460. Bassell GJ, Zhang H, Byrd a L, Femino a M, Singer RH, Taneja KL, Lifshitz
LM, Herman IM, Kosik KS (1998) Sorting of beta-actin mRNA and protein to neurites and growth cones in culture. J Neurosci 18:251–265.
Ben-Yaakov K, Dagan SY, Segal-Ruder Y, Shalem O, Vuppalanchi D, Willis DE, Yudin D, Rishal I, Rother F, Bader M, Blesch A, Pilpel Y, Twiss JL, Fainzilber M (2012) Axonal transcription factors signal retrogradely in lesioned peripheral nerve. EMBO J 31:1350–1363 Available at:
http://dx.doi.org/10.1038/emboj.2011.494.
Bi J, Hu X, Loh HH, Wei L-N (2003) Mouse kappa-opioid receptor mRNA differential transport in neurons. Mol Pharmacol 64:594–599.
60
Bramham CR, Wells DG (2007) Dendritic mRNA: transport, translation and function. Nat Rev Neurosci 8:776–789.
Brittis PA, Lu Q, Flanagan JG (2002) Axonal protein synthesis provides a mechanism for localized regulation at an intermediate target. Cell 110:223– 235.
Buckley PT, Lee MT, Sul J, Miyashiro KY, Bell TJ, Fisher SA, Kim J, Eberwine J (2011) Cytoplasmic intron sequence-retaining transcripts (CIRTs) can be dendritically targeted via ID element retrotransposons. Neuron 69:877–884.
Cajigas IJ, Tushev G, Will TJ, tom Dieck S, Fuerst N, Schuman EM (2012) The Local Transcriptome in the Synaptic Neuropil Revealed by Deep
Sequencing and High-Resolution Imaging. Neuron 74:453–466.
Campbell DS, Holt CE (2001) Chemotropic responses of retinal growth cones mediated by rapid local protein synthesis and degradation. Neuron 32:1013– 1026.
Condeelis J, Singer RH (2005) How and why does beta-actin mRNA target? Biol Cell 97:97–110.
Cosker KE, Pazyra-Murphy MF, Fenstermacher SJ, Segal RA (2013) Target-derived neurotrophins coordinate transcription and transport of Bclw to prevent axonal degeneration. J Neurosci 33:5195–5207.
Cox LJ, Hengst U, Gurskaya NG, Lukyanov KA, Jaffrey SR (2008) Intra-axonal translation and retrograde trafficking of CREB promotes neuronal survival. Nat Cell Biol 10:149–159.
Crino P, Khodakhah K, Becker K, Ginsberg S, Hemby S, Eberwine J (1998) Presence and phosphorylation of transcription factors in developing dendrites. Proc Natl Acad Sci U S A 95:2313–2318.
Crino PB, Eberwine J (1996) Molecular characterization of the dendritic growth cone: Regulated mRNA transport and local protein synthesis. Neuron
17:1173–1187.
Darnell JC, Jensen KB, Jin P, Brown V, Warren ST, Darnell RB (2001) Fragile X mental retardation protein targets G quartet mRNAs important for