Original
Food Poisoning Incidents in Workplaces in Japan from 2004 to 2015
Ryoichi Inaba1)
and Atsushi Hioki1)2)
1)Department of Occupational Health, Gifu University Graduate School of Medicine
2)Clinical Division, Matsunami General Hospital
(Received: August 12, 2016)
Abstract
The objective of this study was to examine food poisoning incidents at workplaces in Japan between 2004 and 2015. Information on food poisoning incidents was collected mainly from the national food poisoning statis-tics along with other sources.
The numbers of food poisoning incidents during the 12-year period were confirmed as follows: 246 oc-curred in workplace cafeterias, 37 in workplace dormitories, and 88 from delivered lunches. Some workers were also included in the incidents involving hospital meals, school lunches, school events, and welfare facility meals. Norovirus was the most frequent causative agent for food poisoning among all food service facilities. The proportion of norovirus increased in 2010―2015 as compared with that in 2004―2009. These results suggest that it is necessary for workplaces to select a meal provider that performs thorough hygienic control, and to prepare for outbreaks of food poisoning and infectious diseases. The crude incidences of food poisoning were higher in workplace cafeterias and dormitories, and the proportion of incidents caused by Clostridium
perfrin-genswas relatively high in workplace dormitories, for hospital meals, and in workplace cafeterias. Thus, we concluded that in order to prevent food poisoning, it is useful to share information about incidents in facilities with similar environments.
(JJOMT, 66: 75―81, 2018)
―Key words―
workplace, food service facility, food poisoning
Introduction
The annual number of food poisoning incidents during the last 20 years in Japan decreased from a peak of 3,010 in 1998 to 931, 976, and 1,202 in 2013, 2014 and 2015, respectively. Nevertheless, approximately 20,000 peo-ple were still affected annually by food poisoning in these three years1)
. Outbreaks of food poisoning in work-places can have detrimental effects on the continuation of business activities2)3)
. Preventive measures against secondary infections are needed when the causative agent of the food poisoning is contagious4) 6)
. Outbreaks of food poisoning in workplaces are caused mainly by the food supply facility or the lunch supplier, with the for-mer including schools and hospitals.
The national food poisoning statistics1)
provide insufficient information regarding facilities responsible for food poisoning in workplaces because not all food supply facilities in workplaces were set up by that company. In other words, facilities that are set up by another provider are categorized as restaurants , similar to gen-eral restaurants located in public. The responsible facilities in cases of delivered lunches are categorized as ca-terers without discrimination of the delivery destination, but these lunches are often delivered from restau-rants. Moreover, categories such as schools, hospitals and welfare facilities represent the number of poi-soned cases occurring chiefly among customers, not among workers.
In this study, we collected information on food poisoning cases in workplaces primarily based on the above-mentioned national statistics1)
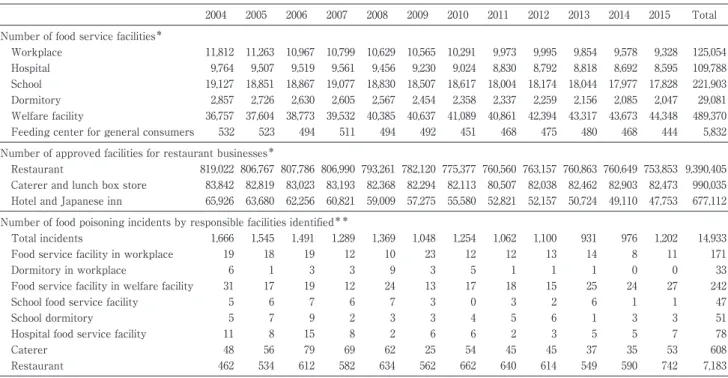
re-Table 1 Numerical information relating to food poisoning in workplaces according to the national statistics
2004 2005 2006 2007 2008 2009 2010 2011 2012 2013 2014 2015 Total Number of food service facilities*
Workplace 11,812 11,263 10,967 10,799 10,629 10,565 10,291 9,973 9,995 9,854 9,578 9,328 125,054 Hospital 9,764 9,507 9,519 9,561 9,456 9,230 9,024 8,830 8,792 8,818 8,692 8,595 109,788 School 19,127 18,851 18,867 19,077 18,830 18,507 18,617 18,004 18,174 18,044 17,977 17,828 221,903 Dormitory 2,857 2,726 2,630 2,605 2,567 2,454 2,358 2,337 2,259 2,156 2,085 2,047 29,081 Welfare facility 36,757 37,604 38,773 39,532 40,385 40,637 41,089 40,861 42,394 43,317 43,673 44,348 489,370 Feeding center for general consumers 532 523 494 511 494 492 451 468 475 480 468 444 5,832 Number of approved facilities for restaurant businesses*
Restaurant 819,022 806,767 807,786 806,990 793,261 782,120 775,377 760,560 763,157 760,863 760,649 753,853 9,390,405 Caterer and lunch box store 83,842 82,819 83,023 83,193 82,368 82,294 82,113 80,507 82,038 82,462 82,903 82,473 990,035 Hotel and Japanese inn 65,926 63,680 62,256 60,821 59,009 57,275 55,580 52,821 52,157 50,724 49,110 47,753 677,112 Number of food poisoning incidents by responsible facilities identified**
Total incidents 1,666 1,545 1,491 1,289 1,369 1,048 1,254 1,062 1,100 931 976 1,202 14,933
Food service facility in workplace 19 18 19 12 10 23 12 12 13 14 8 11 171
Dormitory in workplace 6 1 3 3 9 3 5 1 1 1 0 0 33
Food service facility in welfare facility 31 17 19 12 24 13 17 18 15 25 24 27 242
School food service facility 5 6 7 6 7 3 0 3 2 6 1 1 47
School dormitory 5 7 9 2 3 3 4 5 6 1 3 3 51
Hospital food service facility 11 8 15 8 2 6 6 2 3 5 5 7 78
Caterer 48 56 79 69 62 25 54 45 45 37 35 53 608
Restaurant 462 534 612 582 634 562 662 640 614 549 590 742 7,183
*Report on public health administration and services by Ministry of Health, Labour and Welfare **Statistics of food poisoning by Ministry of Health, Labour and Welfare
ports and websites.
Methods
First, we listed all recorded food poisoning cases between 2004 and 2015 from the food poisoning statis-tics1)
. In these statistics, the responsible facilities for food poisoning are roughly categorized into home, work-place, school, hospital, hotel, restaurant, food-store, food-manufacturer, caterer, natural environment, and oth-ers. Food supply facilities in the workplace, or workplace cafeterias, are included in the subcategory of food service facilities in the workplace under the category of workplace.
Additional information regarding food poisoning was surveyed from PubMed, Ichushi-Web7)
, the Infec-tious Agents Surveillance Report8)
, the Database of Health Crisis Management9)
, prefectural government web-sites10) 12)
and other websites, using the terms food poisoning and workplace cafeteria, worker, employee, workplace or company in English and Japanese. Incidents in schools were also available from the Japan Sport Council s website13)
. Patients poisoned at a banquet or while eating with friends or co-workers were not included in this study.
Work-related food poisoning can be approved as an occupational accident under some circumstances. Thus, we surveyed the statistics on occupational accidents by food poisoning recorded in national public of-fices14)
, local public offices15)
and other sources16)
.
The number of food service facilities attached to a workplace, hospital, school, or welfare facility, and the number of approved restaurant business facilities were obtained from the Report on Public Health Administra-tion and Services17)
.
The statistical significance of differences in the proportions of the investigated variables was assessed by the Pearson s chi-squared test using Microsoft Office Excel 2007 SP3 (Microsoft, Seattle, WA, USA).
Results
According to the food poisoning statistics, the numbers of food poisoning incidents in workplace cafeterias and dormitories during the 12 years between 2004 and 2015 were 171 and 33, respectively (Table 1). The num-ber of incidents at school dormitories in this period was 51. The rough estimates of the incidence of food
poi-Table 2 Accumulated numbers of food poisoning incidents and patients in workplaces according to the responsible facilities 2004 2005 2006 2007 2008 2009 2010 2011 2012 2013 2014 2015 Total Number of food poisoning incidents by responsible facilities identified
Workplace cafeterias 25 29 27 21 12 27 15 28 17 15 16 14 246
Workplace dormitories 6 2 3 3 10 3 6 1 2 1 0 0 37
Lunch boxes delivered to workplaces 6 11 19 6 4 5 11 5 7 7 2 5 88
Lunch boxes of unknown delivery destination 72 83 116 111 103 61 93 64 78 78 65 81 1,005
Hospital meals 11 10 15 9 3 6 6 2 4 6 4 7 83
School meals 7 5 6 6 4 4 1 5 6 4 3 3 54
School events 18 30 29 18 23 13 22 14 18 13 10 12 220
Welfare facilities 33 20 19 16 25 17 19 18 22 25 24 28 266
Number of food poisoned patients by responsible facilities identified
Workplace cafeterias 1,504 1,783 1,233 502 562 1,285 841 1,185 493 825 625 536 11,374
Workplace dormitories 63 25 53 33 373 22 90 13 19 12 0 0 703
Lunch boxes delivered to workplaces 707 2,477 3,406 595 122 95 1,746 1,126 3,872 258 88 1,489 15,981 Lunch boxes of unknown delivery destination 3,194 5,139 8,765 8,203 5,454 3,176 7,031 2,610 4,189 4,987 3,326 3,736 59,810
Hospital meals 660 362 598 365 84 211 137 74 107 306 149 253 3,306
School meals 776 588 1,607 1,565 926 620 138 2,080 960 372 1,591 445 11,668
School events 898 1,253 890 971 1,200 519 741 335 812 379 379 419 8,796
Welfare facilities 1,438 727 732 955 717 368 575 554 789 801 649 716 9,021
soning calculated from the number of facilities and food poisoning incidents was 1.37 per 1,000 facilities (p< 0.001 vs. others) in workplace cafeterias, 2.89 (p<0.001) in dormitories (including both workplace and school dormitories), 0.71 (p>0.05) in hospital food service facilities, 0.21 (p<0.001) in school food service facilities, 0.61 (p<0.001) for meals from caterers, and 0.76 (p<0.001) in restaurants, compared to 0.74 in total.
By adding the acquired information in this study, the total number of food poisoning incidents occurring in workplace cafeterias and dormitories during the 12 years reached 246 and 37, respectively (Table 2), including 81 and 4 cases, respectively, occurring in facilities that were operated by restaurant business providers. Twelve incidents that occurred at cafeterias for hospital staffs were also included. The mean number and per-centage of food poisoning cases at workplace cafeterias were 45.6 (standard deviation, 58.5; 95% confidence in-terval, 38.1 to 53.2) and 42.2%, respectively. In one case where a food service provider had undertaken 13 work-place cafeterias, the number of food poisoning patients amounted to 580.
The number of food poisoning incidents in workplaces caused by delivered lunches during the 12 years was 88, including 20 incidents occurring when the lunches were provided for a meeting. The destination was unknown in another 1,005 cases of delivered lunch-related food poisonings. Lunch boxes are often delivered from one provider to many workplaces; for example, in one major incident, 2,035 workers in 551 workplaces developed food poisoning18)
.
In the incidents occurring from school lunches, other school events (including school dormitories), hospital meals, and welfare facility meals, the poisoned people were not workers, but rather students, patients, and us-ers. However, in some hospitals and welfare facilities, prepared foods for patients and users were also served to the staff members.
In terms of the food poisoning causative agents, the proportion of norovirus as the causative agent was the highest, at 50.3%, followed by 10.5% for Salmonella species, 8.1% for Staphylococcus aureus, and 7.2% for
Clos-tridium perfringens. The proportion of norovirus increased in 2010―2015 in comparison with that in 2004―2009 (p <0.001) (Fig. 1). The percentage of the food poisoning causative agents being diarrheagenic Escherichia coli,
Ba-cillus cereus, and Salmonella species and Clostridium perfringens were relatively high at workplace cafeterias in 2010―2015, at workplace dormitories in 2004―2009, and at hospitals in 2004―2009, respectively, while norovirus and histamine were high at schools; Campylobacter jejuni/C. coli were high at school events, including school dormitories; and histamine at welfare facilities.
Regarding the month of occurrence, the frequency of food poisoning was higher in January and December and lower in April and May (Fig. 2). The frequency according to the responsible facilities was higher in Janu-ary for workplace cafeterias, in FebruJanu-ary for workplace dormitories, in JanuJanu-ary and December for delivered
Fig. 1 Number of food poisoning incidents in workplaces according to the causative agents and responsible facilities
Fig. 2 Number of food poisoning incidents in workplaces according to the month and responsible facilities 0% 20% 40% 60% 80% 100% 2010-2015 Total 2004-2009 2010-2015 Welfare facility 2004-2009 2010-2015 School event 2004-2009 2010-2015 School meal 2004-2009 2010-2015 Hospital meal 2004-2009 2010-2015 Lunch box 2004-2009 2010-2015 Lunch box to workplace 2004-2009 2010-2015 Workplace dormitory 2004-2009 2010-2015 Workplace cafeteria 2004-2009
January February March April
May June July August
September October November December
lunches to workplaces, in January for school lunches, and in July for school events. In contrast, incidences were lower in July and August for school lunches.
The category food poisoning was not included in either the industrial accident statistics or government employees accident compensation statistics. The numbers of food poisoning cases approved as an accident in local government workers between the 2008 and 2014 fiscal years were as follows: 36 police officers in fiscal year 2008; one cook in fiscal year 2009; one fire defense personnel and two child welfare officers in fiscal year
2012; one fire defense personnel in fiscal year 2013; and one child welfare officer in fiscal year 2014.
Discussion
There is currently no accurate information on food poisoning cases in workplaces in Japan. Here, we col-lected data regarding food poisoning cases from existing information. However, the ratios of actual cases ac-cording to the different workplaces and sources of food remain unknown. For example, there are likely more cases that occurred in workplaces but were categorized into restaurants or caterers. In addition, there may be many cases in which it was not possible to determine whether the symptoms were due to food poisoning or infection from infected person, but were nonetheless determined to be caused by infection. Using this limited information, we tried to analyze the trends of food poisoning in the workplace.
Norovirus was found to be the most frequent causative agent of food poisoning. Prevention of norovirus-mediated food poisoning is difficult, because asymptomatic carriers can cause food poisoning19)
. Even in terms of the incidents with school lunches, where the incidence of food poisoning was the lowest, the ratio of norovi-rus was the highest. Thus, we consider it difficult to avoid food poisoning caused by supplied food, such as norovirus-contaminated bread, as well as histamine-generated food, and it is consequently necessary to care-fully check the food providers used. Further, preventive measures against secondary infection by all workers are necessary when food poisoning by norovirus or diarrheagenic E. coli occurs. The incidents of food poison-ing tended to be higher in workplace cafeterias and dormitories. In the workplace dormitories, the frequency of the causative agent being Bacillus cereus was relatively high in 2004―2009. Moreover, it should also be noted that special caution must be taken regarding the period of time between cooking and consumption and the preservation methods of food. This is especially true for hospital meals, workplace dormitories, and welfare fa-cilities, in which the incident ratio of Clostridium perfringens tended to be high. In addition, the ratio of diar-rheagenic E. coli tended to be higher in workplace meals. This finding was largely due to one outbreak in 13 workplace cafeterias operated by the same company20)
. Based on these findings, for the prevention of food poi-soning, we consider it useful to share information about incidents among the same functional facilities such as workplace cafeterias, hospital food services, and dormitories.
The number of workers who had received accident compensation was low during the study period. It is not known whether this is due to the number of applications or the rate of approval being low, and we specu-late that one potential reason may be that food providers and food-respecu-lated businesses use food poisoning insur-ance against poisoned patients.
In Japan, the Ministry of Labour announced their recommendation on the prevention of infection to work-places with food supply facilities when facing a nationwide outbreak of enterohemorrhagic E. coli (O157) infec-tion in 199621)22)
. The hygienic control manual for large-scale cooking facilities22)
was later revised following an outbreak of norovirus infection and food poisoning. In some cases, the municipal government informs workers regarding food poisoning23)
. However, food providers, other than those of school lunches and public services, have to pursue profits. Accordingly, almost no disruption to business operations caused by food poisoning were identified in the present investigation2)
, and, in response to outbreaks of food poisoning, a corporation24)
and hospitals4)25)
reported having taken risk management measures.
In conclusion, it is important to select a food provider that promotes food sanitation management as well as to develop a business continuity plan3)
in case of food poisoning and infectious diseases occur in the work-place.
References
1) Ministry of Health, Labour and Welfare: Food poisoning statistics. http://www.mhlw.go.jp/stf/seisakunitsuite/bunya/kenko u_iryou/shokuhin/syokuchu/index.html (accessed 2016-08-01). Japanese.
2) Hioki A: Food poisoning and BCP. Koshu-Eisei (Journal of Public Health Practice) 74 (11): 931, 2010. Japanese.
3) The Small and Medium Enterprise Agency: Guidelines on the development and implementation of small and medium enter-prises business continuity plans. Second edition. 2012, Japanese.
4) Takami Y, Kurihara S, Tsukamoto M, Yasuoka A: Secondary infection among nursing staff following food-borne norovirus outbreak in a hospital and the association with patient care. Kankyo Kansen 25 (1): 27―31, 2010. Japanese.
5) Verhoef L, Vennema H, van Pelt W, et al: Use of norovirus genotype profiles to differentiate origins of foodborne outbreaks. Emerg Infect Dis 16 (4): 617―624, 2010.
6) Wakabayashi Y, Kubota S, Kohjin H, et al: An experience of food-borne norovirus outbreak in a hospital: assessment of the management. Nippon Iryo Manejimento Gakkai Zasshi (Journal of Japan Society for Health Care Management) 15 (1): 35―38, 2014. Japanese.
7) Japan Medical Abstracts Society: Ichushi-Web. http://www.jamas.or.jp/index.html (accessed 2016-08-01). Japanese.
8) National Institute of Infectious Diseases: Infectious agents surveillance report. http://www.nih.go.jp/niid/ja/iasr.html (ac-cessed 2016-08-01). Japanese.
9) National Institute of Public Health: Database of health crisis management. http://h-crisis.niph.go.jp/?cat=18 (accessed 2016-08-01). Japanese.
10) Bureau of Social Welfare and Public Health, Tokyo Metropolitan Government: Overview of food poisoning incidents in To-kyo. http://www.fukushihoken.metro.toTo-kyo.jp/shokuhin/foods_archives/publications/summary/index.html (accessed 2016-08-01). Japanese.
11) Public Hygiene Division, Niigata Prefectural Government: Status of food poisoning incidents. http://www.fureaikan.net/syok uinfo/01consumer/con02/con02_04/con02_04_03.html (accessed 2016-08-01). Japanese.
12) Public Hygiene Division, Gifu Prefectural Government: Records of food poisoning incidents. http://www.pref.gifu.lg.jp/kuras hi/shoku/shokuhin/11222/index_5702.html (accessed 2016-08-01). Japanese.
13) Japan Sport Council: Sanitation management of school lunches. http://www.jpnsport.go.jp/anzen/anzen_school/tabid/557/ Default.aspx (accessed 2016-08-01). Japanese.
14) National Personnel Authority: Government Employees Accident Compensation Statistics. http://www.jinji.go.jp/toukei/013 1_saigaihosho/saigaihosho.htm (accessed 2016-08-01). Japanese.
15) Japan Local Government Employee Safety and Health Association: Current status of accidents in official duties. http://www. jalsha.or.jp/tyosa/result2 (accessed 2016-08-01). Japanese.
16) Ministry of Health, Labour and Welfare: Industrial Accident Statistics. http://anzeninfo.mhlw.go.jp/user/anzen/tok/toukei_i ndex.html (accessed 2016-08-01). Japanese.
17) Statistics Bureau, Ministry of Internal Affairs and Communications: e-Stat. http://www.e-stat.go.jp/SG1/estat/NewList.do?ti d=000001031469 (accessed 2016-08-01). Japanese.
18) Tanaka H, Fujii Y, Yamamoto M, et al: Results of examination for a large scale norovirus food poisoning occurring in Hiro-shima City, 2012. Hirosima-shi Eisei Kenkyujo Nenpo (Annual Report of HiroHiro-shima City Institute of Public Health) 32: 71―73, 2013. Japanese.
19) Todd EC, Greig JD, Bartleson CA, Michaels BS: Outbreaks where food workers have been implicated in the spread of food-borne disease. Part 4. Infective doses and pathogen carriage. J Food Prot 71 (11): 2339―2273, 2008.
20) Ministry of Health, Labour and Welfare, National Institute of Infectious Diseases, Tokyo Metropolitan Government, et al: Outbreak investigation of wide area food poisoning due to enterotoxigenic Escherichia coli O148. Infectious Agents Surveillance Report (IASR) 33 (1): 9―12, 2012. Japanese.
21) Ministry of Labour: Preventative measures against food poisoning caused by pathogenic Escherichia coli (O157). Announce-ments from the director of Industrial Health Division, dated July 24, 1996. Japanese.
22) Ministry of Health Labour and Welfare, Japan: Hygienic control manual for large-scale cooking facilities. 1997, revised in 2016. Japanese.
23) Health and Welfare Center, Hakata Ward Office, Fukuoka City Government: Periodical health information for office workers. http://www.city.fukuoka.lg.jp/hakataku/eisei/life/news.html (accessed 2016-08-01). Japanese.
24) Seiko Epson Corporation: Efforts toward industrial safety and health. http://www.epson.jp/SR/our_people/safety_health.ht m (accessed 2016-08-01). Japanese.
25) Ohnishi T, Adachi M: Norovirus outbreaks in a teaching hospital: the role of infection control. Kansenshogaku Zasshi 81 (6): 689―694, 2007. Japanese.
Reprint request:
Ryoichi Inaba
Department of Occupational Health, Gifu University Graduate School of Medicine, 1-1, Yanagido, Gifu, 501-1194, Japan.
別刷請求先 〒501―1194 岐阜市柳戸 1―1
岐阜大学大学院医学系研究科産業衛生学分野 井奈波良一