九州大学学術情報リポジトリ
Kyushu University Institutional Repository
ガスクロマトグラフィー/フェムト秒レーザー多光子 イオン化飛行時間型質量分析法による農薬の分析
楊, 希翔
http://hdl.handle.net/2324/1937183
出版情報:Kyushu University, 2018, 博士(工学), 課程博士 バージョン:
権利関係:
Analysis of Pesticides by Gas Chromatography/Multiphoton Ionization/Time-of-flight Mass Spectrometry Using a
Femtosecond Laser
Department of Applied Chemistry Graduate School of Engineering
Kyushu University Xixiang Yang
2/28/2018
C
ontentsChapter 1. Introduction 1
1.1. General information 1
1.2. Pesticides and residues 3 1.3. Analytical techniques 6
1.3.1. Current technology of mass spectrometry 6
1.3.2. Laser ionization mass spectrometry 6
1.4. Research subjects 8
1.5. References 10
Chapter 2. Determination of hexachlorocyclohexane isomers 13
2.1. Introduction 13
2.2. Experimental 15
2.2.1 Apparatus 15
2.2.2 Reagents 16
2.2.3 Quantum chemical calculation 17
2.3. Results and discussion 20
2.3.1 Spectral properties of HCHs 20
2.3.2 Predicted elution order of (±)-α-HCHs 20
2.3.3 Determination of HCHs 23
2.3.4 Fragmentation of HCHs 27
2.3.5 Limit of detection 29
2.4. Conclusion 30
2.5. References 32
Chapter 3. Determination of pesticides 35
3.1. Introduction 35
3.2. Experimental 38
3.2.1 Apparatus 38
3.2.2 Reagents 39
3.2.3 Pretreatment procedure 41
3.2.4 Computational methods 42
3.3. Results and discussion 42
3.3.1 Two-dimensional display and limits of detection 42
3.3.2 Optimum wavelength for ionization 49
3.3.2.1 Optimum both at 267 and 800 nm (Group A) 49
3.3.2.2 Optimum at 267 nm but not at 800 nm (Group B) 50
3.3.2.3 Optimum at 800 nm but not at 267 nm (Group C) 53
3.3.2.4 Not optimum both at 267 and 800 nm (Group D) 54
3.3.2.5 Miscellaneous molecules (Group E) 54
3.3.3 Pesticides in an actual sample 56
3.4. Conclusion 62
3.5. References 64
Chapter 4. Conclusion 67
Acknowledgement 70
Appendix 71
Chapter 1 Introduction
1.1. General information
During the past centuries, a variety of pesticides have been developed to increase the production rate of the agriculture products for human beings1. From the invisible bacteria to the moist weather and from the overgrown weeds to the gluttonous pests, people have struggled in the battle against every kind of antagonist in the environment. However, most of the pesticides not only strike a mortal blow for the pests but also provide some crucial damages to human beings and also to the habitat. What was worse, some of the chemical compounds have extremely-high stability in the natural environment and it takes more than several human generations for decomposition. For more effective use of the pesticide resistive against some pests, farmers would increase the amount and the frequency of pesticides in the agreculature2, which make the condition of the environment worse (pour oil on the flame). Regret to say, nobody can escape from the deteriorated environment and avoid possible diseases arising from the pesticides. Just like a coin having two faces, the pesticides pollution has become a lingering nightmare for the living animals and also for human beings on the earth.
According to the definition by the Food and Agriculture Organization (FAO)3, pesticides can be defined as follows, “any substance or mixture of substances intended for preventing, destroying, or controlling any pest, including vectors of human or animal disease, unwanted species of plants or animals, causing harm during or otherwise interfering with the
production, processing, storage, transport, or marketing of food, agricultural commodities, wood and wood products or animal feedstuffs, or substances that may be administered to animals for the control of insects, arachnids, or other pests in or on their bodies”. The term includes substances intended for use as a plant growth regulator, defoliant, desiccant, or agent for thinning fruit or preventing the premature fall of fruit. Also, they are used as substances applied to crops either before or after harvest to protect the commodity from deterioration during storage and transport.
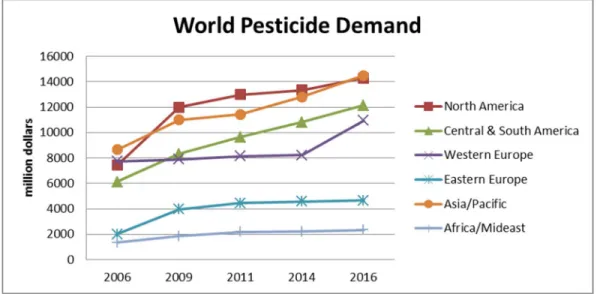
Briefly, pesticides are the chemicals used for the destruction of insects, weeds, fungi, bacteria, and so on. They are generally called insecticides, fungicides, bactericides, herbicides. The pesticide demand in the world is increasing all the time, especially in the developing countries4. In Fig.1-1, the world pesticide demand is shown, according to the data of years and continents.
Fig. 1-1. The world pesticide demand
1.2. Pesticides and residues
In 1962, Silent Spring was published. As an environmental science book, it describes a world with no birds, bees and butterflies, due to a large-scale use of the DDT (Dichloro Diphenyl Trichloroethane) and other synthetic pesticides5-6. Since then, the issue of the protection of the environmental has been brought into people's eyes and caused widespread public and social concerns.
For better understanding and control of the pollution, basic knowledge of pesticides are of importance. In recent centuries, almost thousands of pesticides have been developed and can be categorized into several groups. Table 1-1. shows one classification of pesticides by chemical structures, and Table 1-2 shows the classification by killing targets. There are many definitions about the pesticide residue, but generally speaking, a word of “residue” means the substances remaining in or on the food, agricultural and other types of commodities or animal feed including the environmental media such as soil, air, and water resulting from the use of a pesticide7. In addition, all the derivatives from the pesticide that was applied to the crops, including the conversion products, metabolites, degradation products, reaction by- products, and even impurities, are considered to be “pesticide residues”, which would have strong impact for humans as well as for environments.
Table.1-1. Types of pesticide categorized by the chemical structure Type of pesticides Representative compounds Characteristic
Organochlorines DDT
hexachlorocyclohexane (HCH)
aldrin
Organochlorine (OC) pesticides are one group of chlorinated compounds. Due to strong stability and high toxicity, some of them belong to persistent organic pollutants (POPs), which are prohibited to use in many established and even developing countries8.
Organophosphates parathion malathion methyl-parathion chlorpyrifos
Organophosphate (OP) pesticides are esters of phosphoric acid. They inhibit the function of neuromuscular enzyme, which is broadly required for normal functions in many insects, animals, and humans. Hydrolysis rapidly appears when this type of compounds is exposed to light, air, and soil9.
Carbamates sevin aldicarb carbaryl
Carbamate pesticides are one kind of chemical compounds derived from carbamic acid (NH2COOH).
Carbamate esters have a functional group which can cause the reversible inactivation for an enzyme of acteylcholinesterase10.
Pyrethroides
& pyrethrins bifenthrin deltamethrin fenvalerate imiprothrin
Pyrethroides & pyrethrins are similar organic compounds that can be separated from the flowers of pyrethrums. The biological activity of pyrethrins arises from ketoalcoholic esters of chrysanthemic and pyrethroic acids. Pyrethroides alter nerve function, which causes paralysis in target insect pests, which makes the pests dead11.
Phenylamide
fungicides metalaxyl
mefenoxam (metalaxyl-M) furalaxyl
Phenylamide fungicides are a group of compounds that show potent eradicative anti-fungal activity, which affect nucleic acids by inhibiting the activity of rRNA synthesis and controlling pathogens12.
Triazines chlorazine atriazine propazine
Triazines are one category of herbicidal pesticides, which mainly inhibit plant catabolism pathway and famous for the broad spectrum and small dosage in use13.
Dipyridyl
herbicides paraquat diquat
The dipyridyl compounds are nonselective contact herbicide, which work as redox cycling agents to kill the weeds14.
Table.1-2. Types of pesticide by killing target Type of pesticide Target
Acaricide Kill ticks and mites
Algicide Control algae in ponds, canals, swimming pools, water tanks, and other aquatic environments
Antifouling agent Avoid the accumulation of organisms on wetted surfaces, such as marine vessel underwater section
Antimicrobial Kill microorganisms (such as bacteria and viruses) or stop their growth Attractant/Repellent Attract/Repel pests or birds to the desired/undesired location
Defoliant Cause leaves or other foliage to drop from a plant
Disinfectant Kill or inactivate disease-producing microorganisms on inanimate objects Fungicide Kill fungi or fungal spores
Fumigant Kill or drive away the pests by producing gas or vapor Herbicide Kill weeds and other plants in the unnecessary place Insect growth
regulator
Disrupt the molting, maturity from pupal stage to adult, or other life processes of insects
Insecticide Kill insects and other arthropods
Microbial pesticide Microorganisms that kill, inhibit insects or other microorganisms Molluscicide Kill snails and slugs
Nematicide Kill plant-parasitic nematodes Plant growth
regulator
Change the expected growth, flowering, or reproduction rate of plants (excluding fertilizers or other plant nutrients)
Rodenticide Kill mice and other rodents
Wood preservative Make wood resistant to insects or fungus
1.3. Analytical techniques
1.3.1. Current Technology of Mass Spectrometry
A variety of techniques have been developed to measure the pesticide residues in the environment. By extraction and clean-up procedures, the analytes in the sample can be measured at low concentrations. Among them, chromatography combined with mass spectrometer is known as a very important technique for the measurement of pesticides. In fact, gas chromatography-mass spectrometry (GC-MS)15-19 and liquid chromatography-mass spectrometry (LC-MS)20-27 are the two most common methods reported to date. With different types of ionization techniques and ion detectors, thousands of pesticides are to be analyzed and determined at ultratrace levels. For better performance in analyte separation, two-dimensional methods, i.e., GC & GC and MS & MS, have been developed and used successfully in practical trace analysis. Several ionization methods such as electron ionization (EI) and chemical ionization (CI) are used as two major and popular methods in MS combined with GC28-31, while other ionization methods such as electrospray ionization (ESI), atmospheric pressure chemical ionization (APCI), and atmospheric pressure photo- ionization (APPI) are the common techniques in MS combined with LC32-36. On the other hand, several mass analyzers have been developed for use in MS, e.g. time-of-flight, ion trapped, and quadrupole mass analyzer. All these instruments are widely used in the pesticide residue analysis and have shown excellent performance in practical applications.
1.3.2. Laser ionization Mass Spectrometry
Recently, a new type of GC-MS, which consists of a time-of-flight (TOF) mass spectrometer and a femtosecond laser as the ionization source for multiphoton ionization, has been utilized for multi-residue analysis of the pesticides in the environment-37. This technique has excellent sensitivity and provides subfemtogram detection limits for organic compounds.
Compared with other ionization techniques such as electron ionization (EI), multiphoton ionization has an distinct advantage of providing a molecular ion referred to as “soft ionization”: the energy remaining in the ionized state is minimal and usually insufficient for fragmentation of a molecular ion. Note that use of an optimal wavelength for ionization of specified pesticides will reduce the background signal significantly, which increases the signal to noise ratio and then allows the trace analysis of the constituents in the actual sample.
A femtosecond laser emitting in the far-ultraviolet region (e.g., 200 nm) would be successfully used for efficient resonance-enhanced two-photon ionization for many pesticides because of the larger molar absorptivity in this spectral region. However, the structure of the pesticide used nowadays has become more and more complicated, then majority of the pesticides may or may not have the absorption band in the far-ultraviolet region. Accordingly, it would be necessary to investigate the optimal laser wavelength of efficient ionization and background suppression. In fact, several laser wavelengths can be available by means of a technique of harmonic generation: 400 nm (second harmonic emission), 267 nm (third harmonic emission), 200 nm (fourth harmonic emission) in addition to the fundamental beam (800 nm) of the Ti:sapphire laser currently used for ionization in MS. Therefore, it is desirable to study the ionization mechanism using a laser emitting at
various wavelength for best use of laser ionization MS especially for trace analysis of pesticides in the environment.
1.4. Research subjects
In this dissertation, I employed a femtosecond laser emitting at several wavelengths as the ionization source in MS for trace analysis of pesticides at low concentrations. This dissertation is divided into four chapters as summarized below.
In Chapter 1, the aim of this research is explained in detail. The basic knowledge concerning pesticides is provided for better understandings of the motivation of this work and the contribution to agricultural and environmental sciences. Current technology regarding laser ionization MS is summarized in the following section, which is useful as a background knowledge to consider the successful approach for the pesticide analysis.
In Chapter 2, hexachlorocyclohexane, HCH, is measured by gas chromatography combined with femtosecond laser ionization MS. Many pesticides contain one or more asymmetric carbon atoms, indicating that several enantiomers are present for an isomer.
Although these enantiomers are very similar to each other in the chemical structure and the spectral properties, the chemical properties such as boiling points (polarities) are not identical one another. This suggests that one of the enantiomers is biologically more effective (more toxic) and degrades more rapidly than the others in the environment. Then, it is desirable to determine the enantiomers selectively in pesticide analysis. In this chapter, hexachlorocyclohexane, HCH, was separated by GC using a column with a chiral stationary phase and measured by MS using a deep-ultraviolet (267 nm) and far-ultraviolet (200 nm)
femtosecond lasers as the ionization source. Several structural isomers, α-, β-, γ-, δ-HCH and (+/-)-α-HCH enantiomers were assigned from the data of elution order, which was theoretically predicted by calculating the stabilization energy based on molecular dynamics using a semi-empirical method.
In Chapter 3, many pesticides were determined by GC combined with MS using ultraviolet (267 nm), visible (400 nm), and near-infrared (800 nm) femtosecond lasers as the ionization source. The ionization mechanism is examined from the data of absorption spectra calculated for the neutral and ionic species. This systematic study provides us several valuable guidelines for finding an optimal wavelength for ionization. Several molecules of pesticides remain unexplained by the above guidelines, suggesting that further investigation would be needed for complete understanding of the ionization mechanism.
In Chapter 4, all the subjects obtained in this research are summarized as conclusions.
References
1. Richardson, R. Water Sci. Technol. 1998, 37, 19−25.
2. Huggett, D. B.; Khan, I. A.; Allgood, J. C.; Blosck, D. S.; Schlenk, D. Bull. Environ.
Contam. Toxicol. 2001, 66, 150– 155.
3. www.fao.org/agriculture/crops/thematic-sitemap/theme/pests/en/
4. Fernández-Alba, A. R., Ed. Chromatographic-Mass Spectrometric Food Analysis for Trace Determination of Pesticide Residues; Elsevier: Amsterdam, The Netherlands, 2005.
5. Tomlin, C., Ed. The Pesticide Manual, 10th ed; The Royal Society of Chemistry:
Cambridge. U.K., 1994.
6. Schechter, M. Anal. Chem. 1951, 23, 538–538.
7. WHO Fact sheet, Pesticide residues in food, January 2018 8. Ostrander, G. K. Chem. Eng. News Archieve 2000, 78, 57–58.
9. Munnecke, D. M. J. Agric. Food Chem. 1980, 28, 105–111.
10. Crosby, D. G.; Leitis, E.; Winterlin, W. L. J. Agric. Food Chem. 1965, 13, 204–207.
11. Elliott, M.; Janes, N. F.; Kimmel, E. C.; Casida, J.E. J. Agric. Food Chem. 1972, 20, 300–
313.
12. http://www.frac.info/expert-fora/phenylamides/introduction 13. Hu, S.; Chen, S. J. Agric. Food Chem. 2013, 61, 8524–8532.
14. https://www.scribd.com/document/313684791/Bipyridyl-Herbicides
15. Berger, M.; Loffler, D.; Ternes, T.; Heiniger, P.; Ricking, M. Chemosphere, 2016, 150, 219–226.
16. Barrek, S.; Cren-Olivé, C.; Wiest, L.; Baudot, R.; Arnaudguilhem, C.; Grenier-Loustalot, M. Talanta, 2009, 79, 712–722.
17. Hart, E.; Coscollà, C.; Pastor, A.; Yusà, V. Atmos. Environ. 2012, 62, 118–129.
18. Huo, F.; Tang, H.; Wu, X.; Chen, D.; Zhao, T.; Liu, P.; Li, L. J. Chromatogr. B 2016, 1023–1024, 44–54.
19. Hajšlová, J.; Zrostlíková, J. J. Chromatogr., A 2003, 1000, 181.
20. Lenz, E. M.; Wilson, I. D. J. Protein Res. 2007, 6, 443– 458.
21. Moco, S.; Bino, R. J.; De Vos, C. H.; Vervoort, J. Trends Anal. Chem. 2007, 26, 855–866.
22. Xu, W.; Wang, X.; Cai, Z. Anal. Chim. Acta. 2013, 790, 1–13.
23. Trtić-Petrović, T.; Ðorđević, J.; Dujaković, N.; Kumrić, K.; Vasiljević, T.; Laušević, M.
Anal. Bioanal. Chem. 2010, 397, 2233–2243.
24. Bossi, R.; Vejrup, K.V.; Mogensen, B.B.; Asman, W.A.H. J. Chromatogr. A 2002, 957, 27–36.
25. Rickes, S.; Cesar, P.; José, L.; Carla, G.; Clasen, F. Food Chem. 2017, 220, 510–516.
26. Region, V.; Coscollà, C.; Hart, E.; Pastor, A.; Yusà, V. Atmos. Environ. 2013, 77, 394–403.
27. Machado, I.; Gérez, N.; Pistón, M.; Heinzen, H.; Verónica, M. Food Chem. 2017, 227, 227–236.
28. Mills, P. A.; Onley, J. H.; Gaither, R. A. Anal. Chem. 1963, 46, 186– 191.
29. Lee, S. M.; Papathakis, M. L.; Feng, M. H. C.; Hunter, G. C.; Carr, J. E. Anal. Chem. 1991, 339, 376–383.
30. Nakamura, Y.; Tonogai, Y.; Sekiguchi, Y.; Tsumura, Y.; Nishida, N.; Takakura, K.; Isechi, M.; Yuasa, K.; Nakamura, M.; Kifune, N.; Yamamoto, K.; Terasawa, S.; Oshima, T.;
Miyata, M.; Kamakura, K.; Ito, Y. J. Agric. Food Chem. 1994, 42, 2508–2518.
31. Fillion, J.; Hindle, R.; Lacroix, M.; Selwyn, J. J. AOAC Int. 1995, 78, 1252– 1266.
32. Cook, J.; Beckett, M. P.; Reliford, B.; Hammock, W.; Engel, M. J. AOAC Int. 1999, 82, 1419– 1435.
33. Fillion, J.; Sauvé, F.; Selwyn, J. J. AOAC Int. 2000, 83, 698–713.
34. Chun, O. K.; Kang, H. G.; Kim, M. H. J. AOAC Int. 2003, 86, 823–831.
35. Kondo, H.; Amakawa, E.; Sato, H.; Aoyagi, Y.; Yasuda, K. J. Food Hyg. Soc. Jpn 2003, 44, 161– 167.
36. Ueno, E.; Oshima, H.; Saito, I.; Matsumoto, H.; Yoshimura, Y.; Nakazawa, H. J. AOAC Int.
2004, 87, 1003–1015.
37. Li, A.; Thang, D. P.; Imasaka, T.; Imasaka, T. Analyst 2017, 142, 3942–3947.
Chapter 2 Determination of hexachlorocyclohexane isomers
2.1. Introduction
During the past decades, a variety of pesticides have been developed and widely used for pest control to increase the yield of crops in the agriculture. Most of them are considerably toxic and are harmful not only for insects but also for humans.1-3 Then, the pesticides should be carefully used under controls for protection of the environment. Although some of the pesticides was prohibited for a long time ago, they remain in the environment due to extremely high stability of these compounds. It should be noted that some of the toxic pesticides are used even now in several countries when their use is more beneficial for the production of crops rather than the contamination of the soils.
Hexachlorocyclohexane, HCH, is the most abundant organochlorine compound of the pesticide in the atmosphere and also in the water.4-8 This compound is a generic term for the isomers of 1,2,3,4,5,6,-hexachlorocyclohexane, and the isomers are denoted by Greek letters ( and -HCH).9 A technical mixture of HCH isomers is used as a commercial product, which typically contains 60-70% , 5-12% , 10-12% HCH.10 The order of toxicity for insects is reported to be > > >>.11 HCHs primarily affect the central nervous system (CNS). Although the toxicological mechanism in human body remains mostly unknown, the -,-, and -HCH isomers are considered to be CNS depressants.12 Only -HCH consists of chiral HCH isomers.13 The enantiomeric ratio of (+)--HCH and (-)--HCH was measured in the North Sea water.14 The ratio of the technical -HCH is
reported to be 1.00 ± 0.02, the value being changed from 1.2 from 1.9 for those in the blubber, liver, and lung of neonatal northern fur seals.15 Although and HCHs were recently issued as new persistent organic pollutants (POPs) in the Stockholm Convention, toxic, persistent, and bio-accumulative HCH wastes remaining in the environment, mainly consisting of -HCH (80%) and -HCH (20%), are estimated to be 4-7 million tonne.16
The distribution of structural and enantiometric isomers provides us important information for assessment of the environment and is also useful for control and protection of the environmental issue. However, the concentration levels of the toxic pesticides are very low, and numerous interference species are present at high concentrations for environmental samples.17 Therefore, it is desirable to develop a sensitive as well as selective analytical method for trace analysis of these compounds. To date, several types of analytical instruments have been utilized to date, e.g., gas chromatography/mass spectrometry (GC/MS)18,19, liquid chromatography/mass spectrometry (LC/MS)20-22, and liquid chromatography/tandem mass spectrometry (LC/MS-MS)21. In standard GC/MS, a technique of electron ionization (EI) has been successfully used, since the standard data are available for many compounds in the database and the analyte can be readily assigned. However, other ionization techniques such as photoionization provides us useful means for trace analysis.
For example, femtogram detection limits are reported for dioxins and subfemtogram for polycyclic aromatic hydrocarbons based on multiphoton ionization (MPI) using an ultraviolet femtosecond laser.23 Several pesticides have absorption bands in the far-ultraviolet region at around 200 nm, a far-ultraviolet femtosecond laser emitting at 200 nm was used for more efficient ionization in MS.24
In this study, I report on the separation of four structural isomers of -, -, -, -HCHs and two enantiomers of -HCH, i.e., (+)--HCH and (-)--HCH, using a capillary column with a stationary phase consisting of permethylated -cyclodextrin (PM--CD) and their determination by MS using a femtosecond laser emitting in the deep-ultraviolet (267 nm) and far-ultraviolet (200 nm) regions. The order of elution of the (+/-)--HCH enantiomers were compared with the data from stabilization energy by a technique based on molecular dynamics using a semi-empirical method. The mechanism of fragmentation is discussed using data obtained by quantum chemical calculations.
2.2. Experimental
2.2.1. Apparatus
The analytical instrument used in this study is reported in detail elsewhere.25,26 Briefly, a 1-L of sample solution was injected into a GC (6890N, Agilent Technologies, Santa Clara, CA, USA) equipped with an auto sampler (7683B, Agilent Technologies), which was combined with a time-of-flight (TOF) mass spectrometer developed in our laboratory and now commercially available (HGK-1, Hikari-GK, Fukuoka, Japan). The third and fourth harmonic emissions (267 and 200 nm) of a Ti:sapphire laser (800 nm, 35 fs, 1 kHz, 4 mJ, Elite, Coherent Inc., CA, USA) were used as ionization sources. The laser beam was focused into a molecular beam for multiphoton ionization. The analytes in the standard sample mixture containing four structural isomers of HCHs were separated using a capillary column with a chiral stationary phase (-DEX 120, 30 m long, 0.25 inner diameter, 0.25 film
thickness, Supelco, Bellefonte, PA, USA). The temperature of a GC oven was programed to increase from 100 °C (1 min hold) to 150 °C at a rate of 20 °C/min and then to 190 °C at a rate of 2 °C, where it was held for 15 min. The temperature was further increased to 210 °C at a rate of 30 °C and was held for 5 min. The flow rate of helium used as a carrier gas was 1 mL/min. The ions induced were accelerated toward a TOF tube and were detected by microchannel plates (F4655-11, Hamamatsu Photonics, Shizuoka, Japan). The signals were recorded by a digitizer (AP240, Acqiris, Agilent Technologies), and the data were analyzed using a home-made software programed by LabVIEW.
2.2.2. Reagents
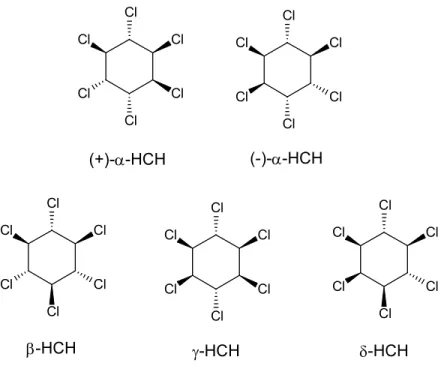
Enantiometric isomers of (+/-)-α-HCH and δ-HCH were purchased from Wako Pure Chemical Industries, Tokyo, Japan. β-HCH was supplied from Sigma Aldrich, while -HCH was a product of Tokyo Chemical Industry, Tokyo, Japan. Their steric structures are shown in Fig. 2-1. Acetone (analytical grade) used as a solvent was supplied from Wako Pure Chemical Industries.
Fig. 2-1. Chemical structures of -, -, -, and -HCH. Two enantiomers of (+) and (-) are shown for -HCH.
2.2.2. Quantum Chemical Calculation
To investigate the mechanism for the ionization, the spectral properties such as the ionization energies and the absorption spectra of ---and -HCH in the gaseous phase are necessary. For this purpose, sophisticated analytical instruments such as photoelectron spectroscopy and also for absorption spectrometry in the vacuum-ultraviolet region are required. These parameters were evaluated by Tomoko Imasaka of the Graduate School of Design, Kyushu University. The optimized geometry of the ground state and the harmonic frequencies were calculated using the B3LYP method based on density functional theory (DFT) with a cc-pVDZ basis set. The lowest 40 singlet transition energies and the oscillator strengths were calculated using time-dependent DFT (TD-DFT), and the absorption spectra
Cl Cl
Cl Cl Cl Cl Cl
Cl
Cl Cl Cl Cl
Cl Cl
Cl Cl Cl Cl Cl
Cl
Cl Cl Cl Cl
Cl Cl
Cl Cl Cl Cl
(+)--HCH (-)--HCH
-HCH -HCH -HCH
were predicted by assuming a peak with a Gaussian profile having a half width at half maximum of 0.333 eV. These calculations were performed using the Gaussian 09 and Gauss View 5 programs.27,28 For the discussion of fragmentation, the enthalpy change by the dissociation of a molecular ion was calculated using DFT.
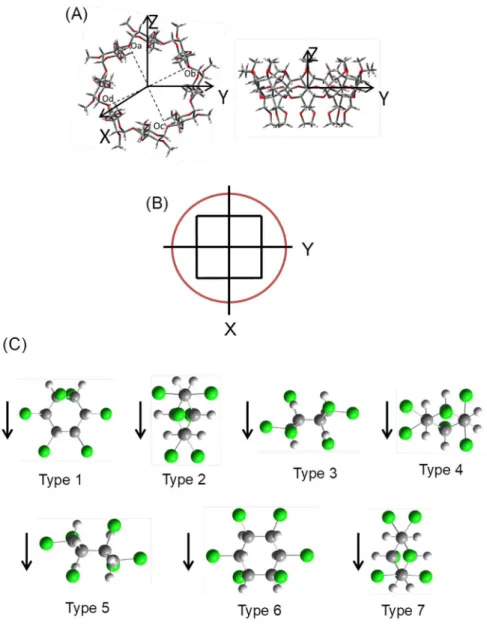
In order to examine the energy of interaction between (+/-)--HCH and PM--CD, their structures were generated using Gauss View 5.0.9 and were optimized at the level of PM3 (Parameterized Model number 3) using Gaussian 09 by Tomoko Imaska. As an initial configuration of PM--CD, the glycosidic oxygen atoms, i.e., Oa, Ob, Oc, and Od, were placed on the XY plane and their center of gravity was positioned at the origin of the space- fixed Cartesian coordinate of XYZ (see Fig. 2-2. for details). The methylated secondary hydroxyl groups of the PM--CD, i.e., -OCH3, were set to point toward the positive direction of the Z-axis. The (+/-)--HCH molecule was assumed to approach toward the wide rim of the PM--CD.
Fig. 2-2. (A) structure of permethylated -cyclodextrin calculated at PM3 levels. Red, oxygen; gay, carbon; white, hydrogen. (B) picture of Cartesian coordinate viewed from a ring with a larger size at a height of Z = 5 Å. The locations initially used for computer simulation are indicated as black filled circles in the picture. The spacing between the locations is 2 Å. (C) initial configuration of (+)--HCH isomers used in the computer simulation. Type 1, original position (not rotated); Type 2, rotated 90° along z-axis; Type 3-5, rotated 90° along y-axis and rotated 0, 90, 180° along z-axis, respectively; Type 6-7, rotated 180° along y-axis and rotated 0, 90° along z-axis, respectively. The arrow shows the direction that (+)--HCH approach permethylated -cyclodextrin.
2.3. Results and discussion
2.3.1. Spectral Properties of HCHs
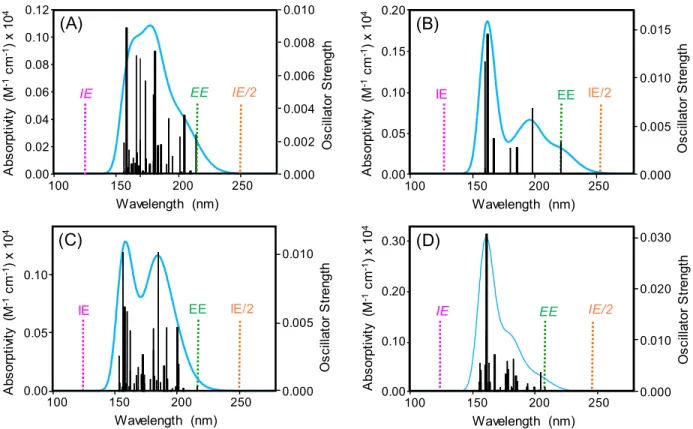
The absorption spectra of HCH isomers calculated by DFT are shown in Fig. 2-3. The energy of excitation to the first singlet electronic excited state (EE) is located at around 200 nm while no absorption band is found at around 267 nm. The half of the energy for ionization (IE/2) is located at around 250 nm, suggesting two-photon ionization at 200 nm and three- photon ionization at 267 nm. Thus, all of the isomers would be ionized through a resonant two-photon ionization at 200 nm and non-resonant three-photon ionization at 267 nm.
Therefore, a far-ultraviolet laser (200 nm) would be preferential for efficient ionization and also for reducing the excess energy to suppress fragmentation. The molar absorptivity at 200 nm was ca. 500, 700, 400, and 400 for ---and -HCHs, respectively, which was nearly identical to each other. This suggests that the ionization efficiency would not change significantly among these isomers.
2.3.2. Predicted Elution Order of (+/-)--HCHs
The optimized structure of the PM--CD used as the stationary phase of the capillary column in GC is shown in Fig. 1 (A), and suggests that the molecule has a symmetry of C8. The average distance from the center of gravity to a glycosidic oxygen atom, Oa, Ob, Oc, Od, of PM--CD was 5.94 Å, which was similar to the value of 5.88 Å reported based on X- ray crystallography data for -CD.29 The average angle of C-O-C calculated for a glycosidic oxygen was 115, which was close to the observed value of 117. The average distance between the oxygen atoms was 4.54 Å, which is nearly identical to the observed value (4.50
Å). Thus, the calculated structural data are in reasonably good agreement with the observed data for -CD, although no data were available for PM--CD as a reference. It should also be noted that the calculated structure of PM--CD was very similar to that obtained by increasing the number of the glycosidic units from seven to eight in the reported structure of PM-- CD.30
Fig. 2-3. Absorption spectra calculated for (A) -HCH (B) -HCH (C) -HCH (D) -HCH by DFT. IE, ionization energy; IE/2, half of ionization energy; EE, excitation energy to the first electronic excited state. The vertical ionization energy for these compounds are 9.91 eV (125.1 nm), 9.91 eV (125.1 nm), 9.87 eV (125.6 nm), and 10.08 eV (123.0 nm), respectively.
100 150 200 250
0.00 0.02 0.04 0.06 0.08 0.10 0.12
Wavelength (nm) Absorptivity(M-1cm-1) x 104
0.000
IE EE IE/2
Oscillator Strength
0.002 0.004 0.006 0.008 0.010
(A)
100 150 200 250
0.00 0.05 0.10 0.15 0.20
Wavelength (nm) Absorptivity(M-1cm-1) x 104
0.000
IE IE/2
Oscillator Strength
0.005 0.010 0.015
(B)
EE
100 150 200 250
0.00 0.05 0.10
Wavelength (nm) Absorptivity(M-1cm-1) x 104
0.000
IE EE IE/2
Oscillator Strength
0.005 0.010
(C)
100 150 200 250
0.00 0.10 0.20 0.30
Wavelength (nm) Absorptivity(M-1cm-1) x 104
0.000
IE IE/2
Oscillator Strength
0.010 0.020 0.030
(D)
EE
Since the (+/-)--HCH/PM--CD complex consists of 258 atoms, finding an optimized structure required a long time or it was difficult to converge the data in the DFT computation:
it was difficult to apply, even the Hartree-Fock method. Therefore, a semi-empirical method, i.e., PM3, was utilized in this study. A preliminary examination suggests that the calculated value for the stabilization energy by complexing was affected by the initial position and configuration of (+/-)--HCH. In fact, (+/-)--HCH with different configurations placed at various locations approaches the PM--CD cage in the experiment, and enantiomeric separation was achieved by virtue of the small difference in the stabilization energy of the complex of (+/-)--HCH and PM--CD. The (+/-)--HCHs with different configurations were then positioned at 3 3 grids above the PM--CD before the calculation (see Fig. 2-2.
(B)). A molecule was assumed to approach along the Z-axis toward the inner surface of the PM--CD cage. To investigate the stabilization energy along the Z-axis, the structure of the (+/-)--HCH/PM--CD complex was first optimized with no restrictions by placing the center of gravity of (+/-)--HCH at (0, 0, Z) where Z = 3, 4, 5, 6, 7 Å. The energy was minimal at (0, 0, 5 Å) in the cases of both (+)--HCH and (-)--HCH. Second, the initial center of gravity was set at (X, Y, Z=5 Å) where X = -1.5, 0, 1.5 and Y = -1.5, 0, 1.5, since (+/-)--HCH is assumed to approach from various positions toward the wider rim of the PM-
-CD. The (+/-)--HCH molecule was then rotated by 0, 90, 180 around the z-axis of the
molecule-fixed Cartesian coordinate of xyz and was also rotated by 0, 90, 180 around the y-axis, as shown Fig. 2-2. (C); the arrow in the figure shows the direction of approach to the PM--CD. The optimization was then initiated from 126 positions/configurations/species, i.e.,
9 translational 7 rotational 2 (+/-)--HCH species. After rejecting data leading to unstable and deformed structures (12/126), the difference in the stabilization energies for the (+/-)-- HCHs was calculated to be -0.34 ± 1.42 kcal/mol, suggesting that the (+)--HCH/PM--CD complex is slightly more stable than the (-)--HCH/PM--CD complex: the conclusion remained unchanged even when the conditions for the calculation and the rule for rejecting the data were modified. A small difference in the stabilization energy could be due to the very flexible structure of PM--CD. Thus, (+)--HCH would be predicted to elute later than (-)--HCH in GC, as reported in the literature.31
2.3.3. Determination of HCHs
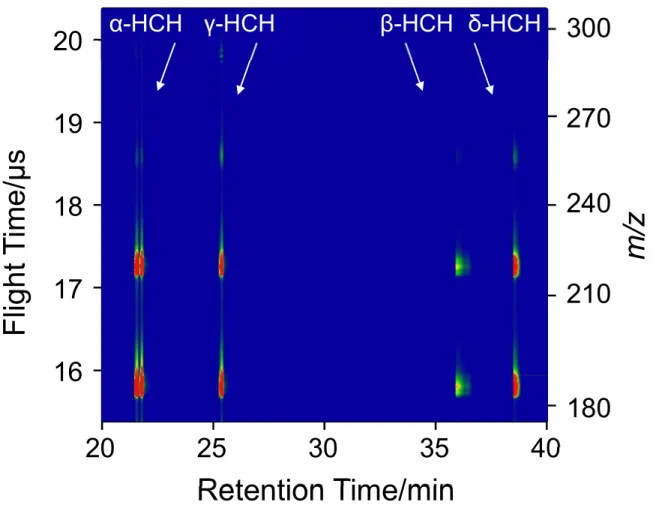
A sample containing a mixture of ---and -HCH was analyzed by GC/MPI- TOFMS using a femtosecond laser emitting at 200 nm and the result is shown in Fig. 2-4.
The isomers of HCH were clearly separated by GC and a series of fragment peaks were produced in MS. The expanded view shown in the insert indicates the complete separation/resolution of (+)--HCH and (-)--HCH by GC and MS; the (-)-enantiomer elutes earlier than the (+)-enantiomer in GC.31 The signal intensity of the peak arising from -HCH is relatively weak, although the molar absorptivity is slightly higher than that for the other compounds at 200 nm, suggesting that a -HCH undergoes a more inefficient ionization from the excited state. A two-dimensional display measured at 267 nm is shown in Fig.2-5. for comparison. A molecular ion is more clearly observed for - and -HCHs at 200 nm than at 267 nm, which would be attributed to efficient resonant two-photon ionization at 200 nm and inefficient non-resonant three-photon ionization at 267 nm. However, no drastic changes
were observed for data measured at the different wavelengths, suggesting that the effect of resonance is minimal in femtosecond ionization.32
Fig. 2-4. Two-dimensional display for a sample mixture containing four isomers of -, -,
, and -HCHs measured at 200 nm (20 J). The insert shows the expanded part that the molecular ions of (-) and (+) enantiomers of -HCH appear. The concentration of the analyte was 25 ng/L for each isomer of HCH.
Fig. 2-5. Two-dimensional display for a sample mixture containing four isomers of -, -,
, and -HCHs measured at 267 nm (20 J). The concentration of the analyte was 25 ng/mL for each isomer of HCH.
20 19 18 17 16
Retention Time/min
20 25 30 35 40
F lig h t T im e /μ s
300
270 240 210
180
m /z
γ-HCH β-HCH δ-HCH
α-HCH
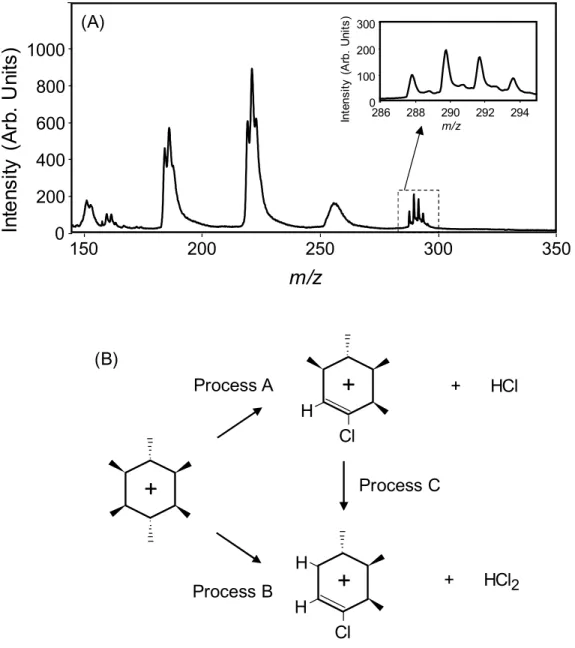
Fig. 2-6. (A) mass spectrum of -HCH measured at 200 nm (20 J) (B) scheme of the fragmentation from the molecular ion.
(A) 1000
800 600 400 200
In te ns ity ( A rb . U ni ts )
0m/z
150 200 250 300 350
286 288 290 292 294
Intensity (Arb. Units)
m/z 300
200 100 0
(B)
H Cl
H Cl H
+ HCl
+ HCl2
+
+
+
Process A
Process C
Process B
2.3.4. Fragmentation of HCHs
As shown in Figs. 2-4. and 2-5., the fragment patterns are similar among these isomers, although - and -HCHs give rise to a more pronounced molecular ion and the signal intensity is larger when measured at 200 nm. Figure 2-6. shows the mass spectra of HCHs extracted from the data shown in Fig. 2-4.. A molecular ion corresponding to C6H635Cl6 is clearly observed at m/z = 288, in addition to other several isotopomers of C6H635Cl6-x37Clx
where x = 1 - 3. The EI mass spectra are available for HCHs in the NIST database: the spectral region of a molecule ion is missing for -HCH probably due to a small signal intensity.33 The relative signal intensities of the molecular ions were apparently more enhanced in the MPI mass spectra measured at 200 nm. This result suggests that UV femtosecond ionization is more favorable for observing a molecular ion. It should be noted that the signal of the fragment, [M-HCl]+ observed at around m/z = 253 in Fig. 2-6., is very broad, which is in contrast to the result for [M-HCl2]+ providing a slightly split structure. In this study, a linear- type TOFMS was used and the initial velocity distribution of the ion can be evaluated; the mass resolution calculated using the signal of a molecular ion was m/m = 520 and this peak broadening cannot be attributed to the limited resolution of the mass spectrometer. These results suggest that a molecule easily dissociates to form fragment ions and neutral species such as HCl (process A) or HCl2 (Process B): these processes would occur in parallel (not sequentially) in femtosecond ionization mass spectrometry. The dissociation releases the excess energy as translational energies of the ions and also of the neutral species. Concerning the fragmentation, an enthalpy change in processes A and B was calculated by DFT. In process A, the enthalpy change was -8.2, -12.0, -3.3 and -5.8 kcal/mol for -, -, -, and -
HCH, respectively, suggesting that the molecular ion can be stabilized by producing a fragment ion and a neutral species of HCl and that the fragmentation is less efficient for - HCH. Accordingly, a very broad peak was observed for the fragment of [M-HCl]+ and a molecular ion remained more efficiently for -HCH due to a smaller change in enthalpy (- 3.3 kcal/mol or -0.14 eV). In process B, the enthalpy change was 7.8, 0.0, 8.4, 6.2 kcal/mol for -, -, -, and -HCH, respectively. Then, a small energy is required for the dissociation of HCl2 (e.g., 8.4 kcal/mol or 0.37 eV for -HCH), which is, however, much smaller than the excess energy in two-photon ionization (6.20 2 – 9.87 = 2.53 eV): a molecular ion remained more efficiently for -HCH due to a larger change in enthalpy. Thus, a slightly split structure was observed for the fragment of [M-HCl2]+ and a molecular ion remained more efficiently for -HCH. When the third harmonic emission (267 nm) was used, the excess energy obtained through the process of three-photon ionization increases significantly (4.64 3 – 9.87 = 4.05 eV), suggesting that a molecular ion can more easily dissociate to form fragment ions. It is interesting to note that a molecular ion was observed more efficiently at 800 nm rather than at 400 nm for benzene and halogenated ethylenes (both through non-resonant MPI processes).34,35 Then, a fundamental beam of the Ti:sapphire laser was utilized in this study to examine the advantage of this technique for observing a molecular ion. However, it was difficult to observe a molecular ion at 800 nm under the optimized conditions used in this study. In fact, the fundamental beam (800 nm) was employed for dissociation of the protonated peptides formed by electrospray ionization (ESI).36 Thus, moderate resonant two- photon ionization in the ultraviolet region would be more preferential, although further
studies would be necessary to conclude this discussion. It has been reported that the efficiency of non-resonant two-photon ionization can be improved significantly by optimizing the wavelength and decreasing the pulse width of the femtosecond laser (<100 fs).32 Therefore, a tunable ultraviolet femtosecond laser, the wavelength of which can be optimized to reduce excess energy at around 250 nm, would be useful to understand the mechanism for non-resonant or nearly-resonant two-photon ionization in terms of observing a molecular ion.37
2.3.5. Limit of detection
Figure 2-7. shows a two-dimensional display obtained using the third harmonic emission (267 nm) at a larger pulse energy available (75 J). Because the signal intensity was increased and a molecular ion was observed for -HCH, an analytical curve was constructed and confirmed to be linear in a range of 0-12 ng/L under present conditions.
The limit of detection (LOD) was 68 pg/L when the signal intensity was measured for a molecular ion (m/z = 290). The value was improved to 5.0 pg/L when a fragment ion (m/z
= 219) was measured. The rather poor detection limits compared with those reported for other organic compounds such as polycyclic aromatic hydrocarbons23 can be attributed to inefficient non-resonant three-photon ionization and the efficient dissociation of a molecular ion to fragments.
Fig. 2-7. Two-dimensional display for a sample mixture containing four isomers of -, -,
, and -HCHs measured at 267 nm (75 μJ). The concentration of the analyte was 10 ng/mL for each isomer of HCH.
2.4. Conclusions
In this study, I report on the separation of some isomers and enantiomers of HCHs using a capillary column with a chiral stationary phase (PM--CD) by GC. A molecular ion was
20 19 18 17 16
Retention Time/min
20 25 30 35 40
F lig h t T im e /μ s
300
270 240 210
180
m /z
γ-HCH β-HCH δ-HCH
α-HCH
more clearly observed for the isomers of - and -HCHs but was weak, even when a far- ultraviolet femtosecond laser (200 nm) was used for resonant two-photon ionization. This result can be explained by the efficient dissociation of neutral species such as HCl and HCl2
from the molecular ion using data obtained by quantum chemical calculations. The isomers and enantiomers of the HCHs were separated by GC and their isotopomers were identified by MS on the two-dimensional display data, suggesting the potential advantage of this method for the comprehensive analysis of pesticides in the environment.
References
1. Bucheli, T.D.; Grüebler, F.C.; Müller, S.R.; Schwarzenbach, R.P. Anal. Chem. 1997, 69, 1569−1576.
2. Tsai, W.C.; Huang, S.D. J. Chromatogr. A 2009, 1261, 5171–5175.
3. Li, J.; Zhang, G.; Qi, S.; Li, X.; Peng, X. Sci. Total Environ. 2006, 372, 215–224.
4. Iwata, H.; Tanabe, S.; Ueda, K.; Tatsukawa, R. Environ. Sci. Technol. 1995, 29, 792–801.
5. Walker, K. Environ. Sci. Technol. 1999, 33, 4373–4378.
6. Simonich, S.L.; Hites, R.A. Science 1995, 269, 1851–1854.
7. Montgomery, J.H. Agrochemical Desk Reference, Environmental Data, Chelsea, MI, 1993, 248–251.
8. Li, Y.; Bidleman, T.; Barrie, L.; McConnell, L. Geophys. Res. Lett. 1998, 25, 39–41.
9. Wilett, K.; Ulrich, E.; Hites, R. Environ. Sci. Technol. 1998, 32, 2197–2207.
10. Kutz, F. W.; Wood, P. H.; Bottimore, D. P. Rev. Environ. Contam. Toxicol. 1991, 120, 1–82.
11. Marrs, T.T.; Ballantyne, B. Pesticide Toxicology and International Regulation, John Wiley &
Sons, Ltd, 2004, 34
12. Pomes, A.; Rodriguez-Farre, E.; Sunol, C. Dev. Brain Res. 1993, 73, 85–90.
13. Cristol, S. J. Am. Chem. Soc. 1949, 71, 1894.
14. Faller, J.; Huhnerfuss, H.; Konig, W.; Krebber, R.; Ludwig, P. Environ. Sci. Technol. 1991, 25, 676–678.
15. Mössner, S.; Spraker, T.; Becker, P.; Ballschmiter, K. Chemosphere, 1992, 24, 1171–1180.
16. Vijgen, J.; Abhilash, P.; Li, Y.; Lal, F.; Forter, M.; Torres, J.; Singh, N.; Yunus, M.; Tian, C.;
Schäffer, A. Environ. Sci. Pollut. Res. 2011, 18, 152–162.
17. Pinto, M.; Sontag, G.; Bernardino, R.; Noronha, J. Microchem. J. 2010, 96, 225–237.
18. Berger, M.; Loffler, D.; Ternes, T.; Heiniger, P.; Ricking, M. Chemosphere, 2016, 150, 219–
226.
19. Barrek, S.; Cren-Olivé, C.; Wiest, L.; Baudot, R.; Arnaudguilhem, C.; Grenier-Loustalot, M.
Talanta, 2009, 79, 712–722.
20. Xu, W.; Wang, X.; Cai, Z.: Analytical chemistry of the persistent organic pollutants identified in the Stockholm Convention: A review. Anal. Chim. Acta. 2013, 790, 1–13.
21. Trtić-Petrović, T.; Ðorđević, J.; Dujaković, N.; Kumrić, K.; Vasiljević, T.; Laušević, M. Anal.
Bioanal. Chem. 2010, 397, 2233–2243.
22. Bossi, R.; Vejrup, K.V.; Mogensen, B.B.; Asman, W.A.H. J. Chromatogr. A 2002, 957, 27–
36.
23. Matsui, T.; Fukazawa, K.; Fujimoto, M.; Imasaka, T. Anal. Sci. 2012, 28, 445–450.
24. Hashiguchi, Y.; Zaitsu, S.; Imasaka, T. Anal. Bioanal. Chem.2013, 405, 7053–7059.
25. Matsumoto, J.; Saito, G.; Imasaka, T. Anal. Sci. 2002, 18, 567–570.
26. Matsumoto, J.; Nakano, B.; Imasaka, T. Anal. Sci. 2003, 19, 379–382.
27. Frisch, M.J., Trucks, G.W., Schlegel, H.B., Scuseria, G.E., Robb, M.A., Cheeseman, J.R., Scalmani, G., Barone, V., Mennucci, B., Petersson, G.A., Nakatsuji, H., Caricato, M., Li, X., Hratchian, H.P., Izmaylov, A.F., Bloino, J., Zheng, G., Sonnenberg, J.L., Hada, M., Ehara, M., Toyota, K., Fukuda, R., Hasegawa, J., Ishida, M., Nakajima, T., Honda, Y., Kitao, O., Nakai, H., Vreven, T., Montgomery, J.A., Jr., Peralta, J.E., Ogliaro, F., Bearpark, M., Heyd, J.J., Brothers, E., Kudin, K.N., Staroverov, V.N., Kobayashi, R., Normand, J., Raghavachari, K., Rendell, A., Burant, J.C., Iyengar, S.S., Tomasi, J., Cossi, M., Rega, N., Millam, J.M., Klene, M., Knox, J.E., Cross, J.B., Bakken, V., Adamo, C., Jaramillo, J., Gomperts, R., Stratmann, R.E., Yazyev, O., Austin, A.J., Cammi, R., Pomelli, C., Ochterski, J.W., Martin, R.L., Morokuma, K., Zakrzewski, V.G., Voth, G.A., Salvador, P., Dannenberg, J.J., Dapprich, S., Daniels, A.D., Farkas, Ö., Foresman, J.B., Ortiz, J.V., Cioslowski, J., Fox, D.J.: Gaussian 09, Revision D.01: Gaussian, Inc., Wallingford CT, 2009
28. Dennington, R.; Keith, T.; Millam, J. Gauss View, Version 5, Semichem Inc., Shawnee Mission KS, 2009
29. Harata, K. Bull. Chem. Soc. Jpn. 1987, 60, 2763–2767.
30. Lipkowitz, K.B.; Pearl, G.; Coner, B.; Peterson, M.A. J. Am. Chem. Soc. 1997, 119, 600-610.
31. Badea, S. L.; Vogt, C.; Gehre, M.; Fischer, A.; Danet, A. F.; Richnow, H. H. Mass Spectrom.
2011, 25, 1363-1372.
32. Kouno. H.; Imasaka, T. Analyst 2016, 18, 5274-5280.
33. http://webbook.nist.gov/cgi/cbook.cgi?ID=C319846&Units=SI&Mask=200#Mass-Spec http://webbook.nist.gov/cgi/cbook.cgi?ID=C319857&Units=SI&Mask=200#Mass-Spec http://webbook.nist.gov/cgi/cbook.cgi?ID=C58899&Units=SI&Mask=200#Mass-Spec http://webbook.nist.gov/cgi/cbook.cgi?ID=C319868&Units=SI&Mask=200#Mass-Spec 34. Castillejo, M.; Couris, S.; Koudoumas, E.; Martín, M. Chem. Phys. Lett. 1998, 289, 303–310.
35. Castillejo, M., Martín, M., Nalda, R. D., Couris, S., Koudoumas, E. Chem. Phys. Lett. 2002, 353, 295-303.
36. Kalcic, C. L., Gunaratne, T. C., Jones, A. D., Dantus, M., Reid, G. E. J. Am. Chem. Soc. 2009, 131, 940-942.
37. Hamachi, A., Okuno, T., Imasaka, T., Kida, Y., Imasaka, T. Anal. Chem. 2015, 87, 3027-3031.
Chapter 3 Determination of pesticides
3.1. Introduction
The use of pesticides, which have been in widespread use for a long time to increase the production of various crops, has increased rapidly during the 20th century. Most pesticides are toxic, not only to pests but also for humans. Numerous pesticides persist for a long time in the environment because they are highly stable, although some are no longer in use.1-3 Many kinds of pesticides are widely spread in water, soil, and air. Due to their high toxicity and stability, several pesticides have been categorized as persistent organic pollutants (POPs) by the Stockholm Convention.4,5 The concentration of pesticides in the environment is extremely low, while numerous other organic compounds are present at high concentrations.6 In addition, many types of pesticides are present in agricultural products. Therefore, a sensitive as well as selective analytical method for the determination of pesticides, in conjunction with a simple pretreatment procedure prior to the measurement would be highly desirable.7-11
Several analytical methods are currently available for the determination of the pesticides. Liquid chromatography/mass spectrometry (LC/MS),12,13 liquid chromatography/tandem mass spectrometry (LC/MS-MS),14-17 and gas chromatography/mass spectrometry (GC/MS)18,19 are the most popular analytical methods that have been reported. Recently, gas chromatography combined with multiphoton ionization time-of-flight mass spectrometry (GC/MPI/TOF-MS) using a femtosecond laser as the ionization source has been applied to the trace analysis of pesticides in an actual sample,20,21 since this technique provides subfemtogram detection limits for organic compounds. In contrast to other ionization methods such as electron
ionization (EI), this technique can be used for the soft ionization of an organic molecule, which permits a molecular ion to be observed. In addition, the background signal arising from interfering substances can be significantly decreased by using a laser with an optimal wavelength for ionization.
Since the efficiency of ionization depends on the spectral properties of the analyte molecule, it is necessary to optimize the ionization conditions, such as the laser wavelength used for the pesticides to be examined. A variety of pesticides with complex chemical structures have been developed for use against highly resistant pests, which makes it more difficult to determine the optimal conditions. In most recent studies, the laser wavelength has been determined experimentally based on a trial-and-error approach.
Enantiomers, in addition to several structural isomers of hexachlorocyclohexane (HCH), have recently been separated using a GC column with an optically-active stationary phase and then measured by MPI/TOF-MS.22 In this study, a femtosecond laser emitting at 200 nm was used, and the molecular ion was more clearly observed than the case of the laser emitting at 267 nm through resonance-enhanced two-photon ionization (RE2PI), since they have strong absorption bands at 200 nm. Similar data have been reported for allergens in fragrances.23 This approach using the laser emitting at 200 nm is useful for a more reliable identification of analytes. However, the optimal laser wavelength depends on the spectral property and then the chemical structure of the molecule. In practical trace analysis, the limit of detection (LOD) is determined by the background signal arising from interfering substances in the real sample. Therefore, it would be necessary to optimize the laser wavelength for all of the pesticides to be examined.
There are two major approaches for determining the optimal wavelength for ionization. One would involve the use of an ultraviolet (UV) laser for RE2PI (especially
for aromatic molecules), which increases the efficiency of ionization via the singlet excited state. When a laser with a pulse width of ca. 50 fs was used in a recent study, the efficiency of non-resonant two-photon ionization (NR2PI) reached a level that was nearly identical to that of RE2PI.24 This approach can reduce the excess energy in the ionization, since the photon energy, i.e., the laser wavelength, can be adjusted to a half of the ionization energy, thus suppressing fragmentation and enhancing the signal of the molecular ion. For example, this technique has been utilized for observing a molecular ion derived from triacetone triperoxide, an explosive that is frequently used in terrorist attacks.25 Another would be the use of a near-infrared (NIR) laser for non-resonant MPI.
Although more than several photons are required for ionization, the efficiency can be improved by using a laser with a high peak power. When the molecular ion has no absorption band in the NIR region, fragmentation can be reduced and a molecular ion can be efficiently observed.26-28 It is reported that a laser with a lower pulse energy and a shorter pulse width is preferential for observing a molecular ion and that a ring-shaped molecule is more stable against a linear molecule and is resistive against the fragmentation.23,24,29-31 In addition, a linearly-polarized beam has been reported to be more useful to reduce the fragmentation against the circularly-polarized beam.32 However, many types of pesticides have complicated chemical structures, and their ionization mechanisms have not yet been studied in detail. Thus, a guideline for observing a molecular ion should be examined at different wavelengths in order to achieve optimal ionization, which would also provide useful information regarding the mechanism for the ionization of a pesticide.
In this study, I measured two-dimensional displays against the retention time in GC and the mass/charge ratio (m/z) in MS for a sample mixture containing 51 pesticides and
calculated the LODs using femtosecond lasers emitting at 267, 400, and 800 nm as the ionization source in MS. The optimal wavelength for suppressing fragmentation was examined, and the results are compared and discussed based on spectral properties obtained by quantum chemical calculations to clarify the ionization mechanism. I also studied some exceptional cases for which additional rules were required to explain unexpected data. The present analytical technique was applied to the determination of pesticides in homogenized matrices derived from actual samples, and the results suggest that this technique has potential advantages for use in the trace analysis of the pesticides in agriculture products.
3.2. Experimental
3.2.1. Apparatus
The experimental apparatus used in the study was a combination of a commercially available GC instrument and a TOF-MS developed in this laboratory. Briefly, a GC (6890N, Agilent Technologies, Santa Clara, CA, USA) equipped with an auto injector (7683B, Agilent Technologies) was combined with a TOF-MS (HGK-1) that is commercially available from Hikari-GK, Fukuoka, Japan. The fundamental beam of a Ti:sapphire laser (800 nm, 1 kHz, 4 mJ, Elite, Coherent Co., Santa Clara, CA, USA) was converted into the second and third harmonic emissions and was used as the ionization source. The pulse energy available in this study was 220, 100, and 75 J at 800, 400, and 267 nm, the pulse width being 35, 37, and 62 fs at these wavelengths, respectively. The analytes were separated using an HP-5 column (a length of 30 m, a 0.25-mm inner diameter, a 0.25-m film thickness). The temperature program of the GC oven was as
follows: initial temperature 70 °C held for 2 min, a rate of 20 °C/min to 150 °C, then 3 °C/min to 200 °C, followed by 8 °C/min to 280 °C and a hold of 10 min. The temperatures of the GC inlet port and of the transfer line between GC and MS were adjusted to 250 and 280 °C, respectively. The flow rate of helium, used as the carrier gas, was 1 mL/min. A 1-L aliquot of sample solution was injected into the GC system. The pesticides in the molecular beam were ionized by focusing the femtosecond laser beam.
The ions induced by 2PI/MPI were accelerated toward a flight tube and were detected by microchannel plates(F4655-11, Hamamatsu Photonics, Shizuoka, Japan). The signal was recorded using a digitizer (Acqiris AP240, Agilent Technologies), and the data were analyzed using a home-made software programed by Visual Basic. The two-dimensional GC/MS display was constructed using the ORIGIN software. The color scale in the picture was slightly modified to compensate for changes in the background and sensitivity using the LabVIEW software.
3.2.2. Reagents
A standard sample mixture containing 51 pesticides was purchased from Hayashi Pure Chemical Ind., Ltd, Osaka, Japan, the concentration of which was 20 g/mL for each component. The chemical structures of those compounds are shown in Fig.3-1. The standard solution was diluted 10 fold (2 ng/L) with acetone (analytical grade) supplied from Wako Pure Chemical Industries, Osaka, Japan.
3.2.3. Pretreatment procedure
A fruit (kabosu) and two vegetables (cucumber and pumpkin) that were examined in this study were purchased from a local supermarket in Fukuoka. The pretreatment procedure was performed by Koji Takahashi, Fukuoka Institute of Health and Environmental Sciences, as follows. The sample (20 g) in a tall 300-mL beaker was mixed with 100-mL of a 4:1 mixture of acetonitrile and water and was homogenized for 2 min.
The solution was then passed through a glass-fiber filter (Advantec Toyo Kaisha, Ltd., Tokyo, Japan) to remove the fiber-like substances and was transferred to a separatory funnel (200 mL). After adding NaCl (10 g) and phosphate buffer (1 M, pH 7, 2 mL), the solution was horizontally shaken for 5 min. After phase separation, the acetonitrile layer was removed by a pipette and was then passed through a column containing anhydrous Na2SO4 (10 g). The solvent was removed by evaporation under reduced pressure at 40 °C using a rotary evaporator. A 2-mL solution comprised of a 3:1 mixture of acetonitrile and toluene was added to the residue and the resulting solution was loaded onto a mini-column (ENVI-Carb/NH2, 400 mg/500 mg, 6 mL, Supelco, Bellefonte, PA, USA) conditioned using a 10-mL portion of the solvent mixture. The glassware was rinsed with a 2-mL portion of the same mixture of acetonitrile and toluene and was loaded onto the mini- column. This procedure was repeated three times. The analyte was eluted using the same solvent mixture (12 mL). The eluent was concentrated under reduced pressure in the rotary evaporator, and the residue was dissolved with acetone, transferred to a centrifuge tube, and was gently dried under a nitrogen gas flow. The residue was dissolved with acetone (1 mL) again and was used as a sample for GC analysis. Occasionally, the standard sample mixture of pesticides (2 ng/L for each) was added to the above solution,
the final concentration being 20 pg/L for each. The solution was stored in a refrigerator prior to the GC measurements.
3.2.4. Computational Methods
In order to find the optimum wavelength of the laser for each pesticide, quantum chemical calculations were carried out by Tomoko Imasaka, Department of Environmental Design, Kyushu University. Gaussian 09 program series package was used,33 in an attempt to develop a further understanding of the ionization mechanism for the agricultural chemical compounds. Minimum geometries were obtained using the B3LYP method, based on density functional theory (DFT) with a cc-pVDZ basis set.34,35 The harmonic frequencies were calculated in order to ensure an optimum geometry providing a global energy minimum. A vertical ionization energy was evaluated from the energy difference between the ground and ionic states. The lowest eighty singlet transition energies and the oscillator strengths were calculated using time-dependent DFT (TD- DFT),36 and the predicted absorption spectra for a neutral species and a molecular ion were obtained by assuming a Gaussian profile with a half width at half maximum of 0.333 eV for each transition.
3.3. Results and discussion
3.3.1. Two-dimensional display and limits of detection
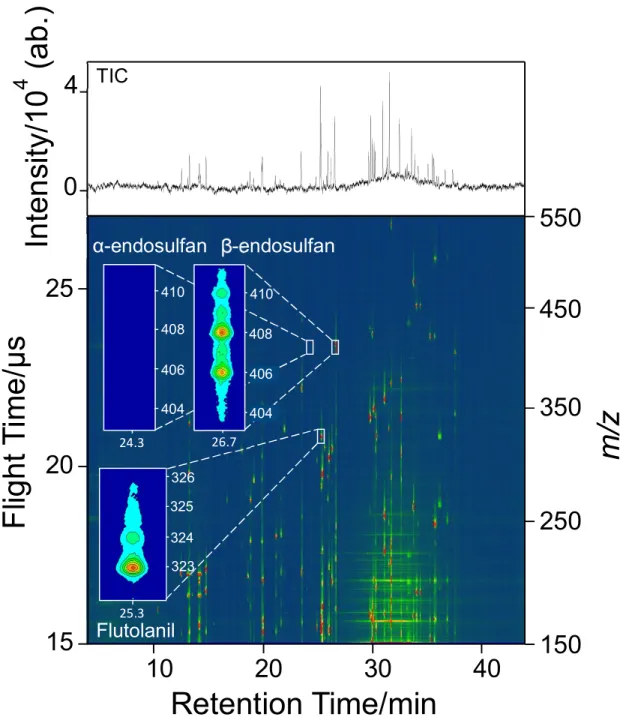
A two-dimensional display measured at 267 nm for a standard sample mixture containing 51 pesticides is shown in Fig. 3-2. Numerous signals were observed in the display. The total ion chromatogram shown at the top of the figure suggests complete separation of the components by GC. The mass spectrum can be extracted from the data measured at the retention time, at which a specific pesticide listed in Table 3-1 appears.
Fig. 3-2. Two-dimensional display of a standard sample mixture containing 51 pesticides measured at 267 nm. Inserts show expanded views of the regions where flutolanil, α-endosulfan, and β-endosulfan appear.
Retention Time/min
F lig h t T im e /μ s m /z
25
20
15
550
450
350
250
10 20 30 40 150
Flutolanil
β-endosulfan α-endosulfan
404 406 408 410
26.7 404
406 408 410
24.3
25.3 324 325 326
323
In te n si ty /1 0 4 ( a b .)
0
4 TIC
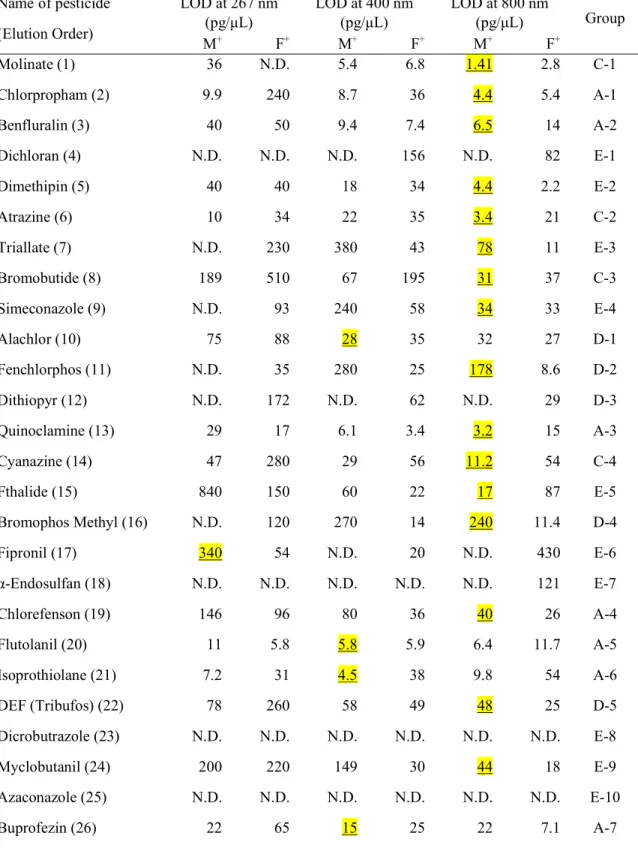
Table 3-1. Limit of detections (LODs) obtained using GC/MPI/TOFMS at 267, 400, and 800 nm for a standard sample mixture of pesticides.
Name of pesticide (Elution Order)
LOD at 267 nm (pg/μL)
LOD at 400 nm (pg/μL)
LOD at 800 nm
(pg/μL) Group
M+ F+ M+ F+ M+ F+
Molinate (1) 36 N.D. 5.4 6.8 1.41 2.8 C-1
Chlorpropham (2) 9.9 240 8.7 36 4.4 5.4 A-1
Benfluralin (3) 40 50 9.4 7.4 6.5 14 A-2
Dichloran (4) N.D. N.D. N.D. 156 N.D. 82 E-1
Dimethipin (5) 40 40 18 34 4.4 2.2 E-2
Atrazine (6) 10 34 22 35 3.4 21 C-2
Triallate (7) N.D. 230 380 43 78 11 E-3
Bromobutide (8) 189 510 67 195 31 37 C-3
Simeconazole (9) N.D. 93 240 58 34 33 E-4
Alachlor (10) 75 88 28 35 32 27 D-1
Fenchlorphos (11) N.D. 35 280 25 178 8.6 D-2
Dithiopyr (12) N.D. 172 N.D. 62 N.D. 29 D-3
Quinoclamine (13) 29 17 6.1 3.4 3.2 15 A-3
Cyanazine (14) 47 280 29 56 11.2 54 C-4
Fthalide (15) 840 150 60 22 17 87 E-5
Bromophos Methyl (16) N.D. 120 270 14 240 11.4 D-4
Fipronil (17) 340 54 N.D. 20 N.D. 430 E-6
α-Endosulfan (18) N.D. N.D. N.D. N.D. N.D. 121 E-7
Chlorefenson (19) 146 96 80 36 40 26 A-4
Flutolanil (20) 11 5.8 5.8 5.9 6.4 11.7 A-5
Isoprothiolane (21) 7.2 31 4.5 38 9.8 54 A-6
DEF (Tribufos) (22) 78 260 58 49 48 25 D-5
Dicrobutrazole (23) N.D. N.D. N.D. N.D. N.D. N.D. E-8
Myclobutanil (24) 200 220 149 30 44 18 E-9
Azaconazole (25) N.D. N.D. N.D. N.D. N.D. N.D. E-10
Buprofezin (26) 22 65 15 25 22 7.1 A-7