A202
Differences in Horizontal-to-Vertical Spectral Rations of Microtremors due to Basin Geometry at
the Eastern Boundary of Kyoto Basin
〇Zhiwei LIU, Shinichi MATSUSHIMA, Teru ITO
The amplification of seismic motions by the ground has been known as one of the most important factors affecting seismic motions based on various damage cases, observation records, and analytical studies. The subsurface structure exploration using microtremor is inferior in accuracy and resolution to the reflection method, but is superior in cost, functionality, and convenience. The results of reflection and borehole surveys can be used as reference, and the results of microtremor surveys can be used as extrapolation and interpolation points to construct relatively reliable two and three dimensional subsurface structures.
Since 1995, a seismic observation network has been established in Kyoto City for the purpose of grasping the characteristics of seismic motion amplification, and many seismic records have been observed. In addition, since 1998, deep underground structure surveys such as reflection refraction method, gravity exploration method, and microtremor array measurement have been conducted, and the depth, base shape, and sedimentary ground structure of the Kyoto Basin have been clarified by Kyoto City.
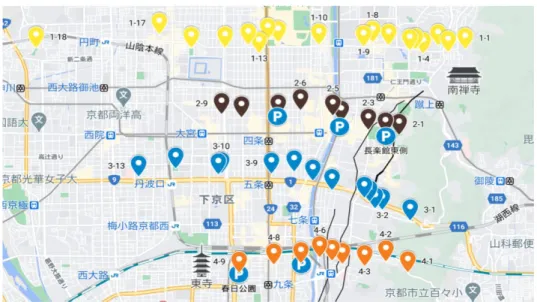
In order to examine the relationship between basin geometry and Horizontal-to-Vertical spectral ratios of microtremors (MHVRs), microtremor measurements were conducted for several days in December 2020 in the eastern part of Kyoto Basin, Japan, for a total of 49 points along four survey lines (Fig. 1).
From the observed microtremor time series, time sections of 40.96 seconds overlapping half of the time window were taken out, resulting in 84 time sections from the 30-minute durations of data for the analysis.
The Fourier spectrum of each component for each time section was calculated and a Parzen window with a bandwidth of 0.1 Hz was used to smooth the spectrums. Then MHVRs for each duration of the observed data was calculated by dividing the NS and EW components with the UD component separately, without averaging the two horizontal components as done in conventional MHVR studies. Finally, we averaged the separate NS/UD and EW/UD spectral ratios for each measurement site. Fig. 2 shows examples of MHVRs obtained from the observation points along Line 1, shown in yellow markers. The MHVRs for two points from the east, points k1-1 and k1-2, has small amplitudes and relatively flat spectral ratios. Beginning from point k1-3, a peak at few Hz arise but the difference between two MHVRs, namely NS/UD and EW/UD is small. From k1-8 a peak at around 0.7 Hz appears and difference between NS/UD and EW/UD can be seen. The peak amplitude of NS/UD is higher than those of EW/UD, which is a sign that the layer that is making these peaks are dipping toward the east-west direction. At k1-15, the peak frequency is at around 0.6 Hz and the dip is at the lowest frequency among the points in Line 1, indicating that the bedrock is deepest at this point. These information will be investigated in detail to capture the relation between the MHVRs and the basin depth and basin shape at the south-eastern part of Kyoto basin.
This study was supported by the cooperative research between DPRI and Ohsaki Research Institute, Inc.
Fig. 1 Location of microtremor observation points in south-eastern part of Kyoto basin.
Fig. 2 The Horizontal-to-Vertical spectral ratios obtained from the observed data at Line 1, shown by yellow markers in Fig. 1. Blue and red lines of MHVRs indicate NS/UD and EW/UD, respectively. The section is results