Development of bioprocess for treatment of
Mn(II)-contaminated metal refinery wastewaters
サンティサック, ギッチャーヌギット
https://doi.org/10.15017/2534416
出版情報:九州大学, 2019, 博士(工学), 課程博士 バージョン:
権利関係:
Development of bioprocess for treatment of Mn(II)-contaminated metal refinery wastewaters
By
Santisak Kitjanukit
A thesis submitted in partial fulfilment of the requirements for the degree of
DOCTOR OF ENGINEERING
Department of Earth Resources Engineering Graduate School of Engineering
Kyushu University
Fukuoka, Japan
September 2019
i Abstract
Contamination of manganese (Mn) in wastewaters, especially from metal-refinery industries, is a challenging problem. Since Mn2+ is thermodynamically stable over the wide range of pH (0-8) and its chemical oxidation promoted at alkaline pHs, a vast cost is needed for neutralizing-agents in conventional Mn-removal processes. On the other hand, microbiological (enzymatic) reactions enable oxidative precipitation of Mn2+ as biogenic birnessite at circumneutral pHs (Mn2+ + 1/2O2 + H2O MnIII, IVO₂ + 2H+; Eq.
1), even without the addition of chemical oxidizing-agents. Therefore, the development of bioprocess for Mn2+-contaminating wastewater could become a more economical and environmentally feasible alternative. This study first analyzed the natural Mn2+
attenuation phenomena in the metal-refinery wastewater pipeline, from which a new Mn-oxidizing bacterium was isolated. The isolate was identified and further evaluated for its Mn-oxidation capability focusing on several metal-refinery water characteristics.
Secondly, the individual contribution of biological (by bacteria) and chemical (by Mn-oxides) effect on Mn-oxidation was clarified. Lastly, the continuous biofilter column was constructed to test its feasibility for actual metal-refinery wastewater.
Moreover, to find an additional value to the resultant biogenic Mn-oxide product, its potential utility for remediation of toxic arsenite (As(III)) was investigated.
In chapter 1, background information regarding the properties of Mn and its contamination problems were introduced. Previous studies related to the present work were reviewed and discussed in this chapter.
In chapter 2, methodologies used in this work were described.
Chapter 3 first described the phenomenon of natural Mn2+ attenuation observed in the actual metal-refinery wastewater pipeline, accompanied with extensive dark-brown-colored mineralization on the inner pipe surface (Mn2+ concentration
ii
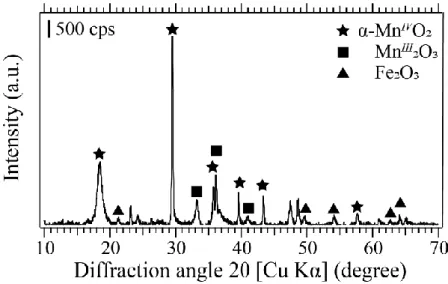
lowered from 1.n to 0.n mg/L after the wastewater traveled through a pipe). The dark-brown deposits taken from the pipe was characterized as mixed phases of crystalline MnIVO2, MnIII2O3, and Fe2O3 (the average oxidation state (AOS) of Mn was 3.75). Due to the high activation energy required for a spontaneous chemical Mn-oxidation, the involvement of microbiological activity was suspected. In fact, the Mn-deposit hosted the bacterial community comprised of Hyphomicrobium sp.
(22.1%), Magnetospirillum sp. (3.2%), Geobacter sp. (0.3%), Bacillus sp. (0.18%), Pseudomonas sp. (0.03%), and non-metal-metabolizing bacteria (74.2%).
In chapter 4, culture enrichments of the Mn-deposit collected in chapter 3 was conducted. After selective screening on the solid agarose media, a Mn-oxidizing colony was isolated and named isolate SK3. Based on the 16S rRNA gene sequence analysis, the closest relative of isolate SK3 was Pseudomonas (Ps.) resinovorans (with 98.4% homology; 1398 bp), which is so far unknown as Mn-oxidizer. Next, isolate SK3 was tested for its Mn-oxidation ability under different conditions mimicking actual metal-refinery wastewater characteristics. When compared to the well-studied Mn-oxidizer Ps. putida MnB1, the superiority of isolate SK3 became noticeable: i.e.
Oxidation of up to 100 mg/L Mn2+ readily progressed and completed by isolate SK3, even in the presence of high contents of MgSO4 (up to 2400 mg/L; a typical solute in metal-refinery wastewaters). At this MgSO4 concentration, Ps. putida MnB1 completely lost its Mn-oxidizing ability. Additional Cu2+ facilitated Mn-oxidation by isolate SK3 (implying the involvement of multicopper oxidase enzyme), allowing 2-fold greater Mn-removal rate, compared to the case of Ps. putida MnB1. Biogenic Mn-oxides formed by isolate SK3 was characterized by XRD as poorly-crystalline birnessite with high MnIV fraction of 0.86 and AOS of 3.8. Overall results in chapters 3-4 suggest that the natural Mn2+ attenuation phenomenon was featured by the robust
iii
in-situ activity of Mn-oxidizers (including isolate SK3) for continuous generation of MnIV.
Mn-oxides produced by Mn-oxidizing bacteria are one of the strong chemical oxidants found in nature. From this point, Mn-oxidation in biological systems includes both direct enzymatic reaction (by microorganisms) and indirect chemical reaction (by Mn-oxides). Therefore, chapter 5 aimed to clarify the individual contribution from the two. When only sterilized natural Mn-oxide (NMO) was provided, Mn-oxidation proceeded only to a limited extent by chemical synproportionation (Mn2+ + MnIVO₂ + H2O MnIII₂O3 + 2H+; Eq. 2). This was due to surface passivation of NMO with MnIII₂O3. When Mn-oxidizing SK3 cells were inoculated in addition to NMO, Mn-oxidation was significantly promoted, owing to the synergistic effect of chemical synproportionation and microbiological MnIVO₂ regeneration. The presence of NMO also likely provided the surface for bacterial colonization to support robust bacterial growth: This allowed isolate SK3 to oxidize Mn2+ even under originally inhibitory complex conditions such as at high MgSO4 concentrations (2400 mg/L) and at a higher temperature (35℃).
Based on the fundamental knowledge obtained from the previous chapters, the continuous biofilter column tests were planned. Firstly, screening for the suitable column carrier (bacteria-supporting material) was conducted in chapter 6. Ten different SiO2- or carbon-based materials were tested through the cycle Mn-oxidation test. The difference in the Mn-oxidation rate was noticed, especially in the first cycle.
However, once Mn-oxides were attached to the support material, the difference gradually became smaller between the different materials. Nonetheless, generally greater effectiveness was noticed throughout the cycles with carbon-based materials, due to their higher affinity to both bacterial cells and Mn-oxides. Consequently,
iv
activated carbon (AC) was chosen for further studies. While AC itself exhibited chemical Mn-oxidizing ability, its effect deteriorated after the second cycle (<40%
Mn-removal) due to passivation of the product (MnIII2O3). Overall, it was suggested that in the following AC-packed column test, the efficient Mn-removal would arise from synergistic interactions between; (i) active oxidation of Mn2+ by bacteria for continuous regeneration of MnIVO2 (Eq. 1) (ii) chemical synproportionation effect of biogenic MnIVO2 producing MnIII2O3 from Mn2+ (Eq. 2) and (iii) chemical oxidation of Mn2+ by the AC surface, producing MnIII2O3 (especially at the early-stage).
Finally, the laboratory-scale AC-packed biofilter column test was conducted in chapter 7, using two types of actual metal-refinery wastewaters (downstream water [Mn2+] 2 mg/L, [SO42-] 780 mg/L; upstream water [Mn2+] 2-5 mg/L, [SO42-] 1500 mg/L). The results obtained from this chapter were expected to offer improvement suggestions for the on-going pilot-scale test column constructed at the mental-refinery site. This on-site pilot-scale column was packed with zeolite with the current Mn-removal of around 40%. The advantage of using AC instead of SiO2-based zeolite as column-carrier was reconfirmed in this test, as the contact time required for the complete Mn-removal was shortened with the former. Before starting the water flow (at the hydraulic retention time (HRT) of 20 min), AC granules pre-colonized with actively Mn-oxidizing SK3 cells were packed in the column, in order to kick-start the Mn-removal. The importance of organic supply was clearly indicated, since Mn-oxidation was catalyzed by heterotrophic bacteria: In fact, the addition of the minimum amount of yeast extract (0.01%) was essential to maintain high Mn-removal efficiency (65-90%, compared to 20-40% in control). For the treatment of upstream water with higher Mn2+ and SO42- contents, the addition of pulverized AC to granule AC (at 3:7 ratio) promoted Mn-oxidation by 5-10%, resulting in about 85% final
v
Mn-removal at HRT 40 min, even after a harsh backwashing process. Overall results obtained in this chapter suggest that the following factors should be considered to improve performance of the on-site pilot-scale column; type of column-carrier, installation of pre-colonization step, the supply of suitable organic nutrient, optimization of HRT.
After the repeated use of the continuous biofilter column, the spent column carriers will be eventually produced. Chapter 8 looked for a potential additional value of biogenic MnO2 accumulated on the spent column carriers. Since groundwater contamination with As(III) is another significant problem associated with mining activity, biogenic MnO2 was tested for its As(III) oxidation capability (H3AsIIIO3 + MnIVO2 + H+ Mn2+ + H2AsVO4- + H2O; Eq. 3). When synthetic As(III)-contaminated groundwater (pH 7) was tested, retaining active Mn-oxidizing SK3 cells on the MnO2
surface enabled effective oxidation of As(III) to less toxic and mobile As(V). By so doing, it was possible to complete As(III) oxidation while no loss of Mn (as dissolved Mn2+; Eq. 3) was made.
In chapter 9, conclusions and recommendations for future work were summarized.
vi 要旨
金属製錬廃液を代表とするマンガン(Mn) による水質汚染は深刻な課題である。
Mn2+ は広範囲のpH (0~8) 領域において熱力学的に安定に溶存するが、アルカ リpH でその化学的酸化が促進される。従来の Mn除去法においては、酸性の 製錬廃液に大量の中和剤を投入し、Mn 酸化物として沈殿除去するため、その コストは膨大である。一方、微生物学的(酵素学的)Mn 酸化反応は化学的酸 化剤の添加なくして中性pH域で促進され、Mnはバーネサイトなどの生体鉱物とし て析出する (Mn2+ + 1/2O2 + H2O MnIII, IVO₂ + 2H+; 式1)。従って、Mn汚染水 処理のためのバイオプロセスは、より経済的かつ環境負荷の小さい代替法とな り得る。本研究は、金属製錬現場における廃液パイプライン中で見られたMn2+
の自然減衰現象の機構解明から始まった。現場の Mn スラッジから新たな Mn 酸化細菌株を単離・同定し、そのMn酸化能について各種条件下で評価した。
次に、Mn 酸化反応における、生物学的効果および化学的効果の個々の寄与を 明らかにした。最後に、金属製錬現場へ導入可能なバイオプロセス構築を目指 して、連続バイオフィルターカラム試験を行った。加えて、使用済カラムに残 存するMn酸化物に対する付加価値として、亜ヒ酸 (As(III)) 酸化処理反応への 応用可能性を見出した。
第1章では、Mnの化学特性と、その汚染問題の背景を紹介した。また文献 調査を行った。
第2章では、実験方法および分析方法について記述した。
第 3 章では、まず、金属製錬現場の廃液パイプラインで観察された Mn2+
の自然減衰現象について説明した。このパイプ内管表面には濃暗褐色の鉱化作 用が見られたため、堆積物を採取し分析したところ、結晶性のMnIVO2、MnIII2O3 、 および Fe2O3が検出された。Mn の平均酸化数 (AOS) は 3.75 であった。自発 的な化学的Mn酸化が起こる条件は見当たらなかったことから、微生物学的活 性の関与が示唆された。DNAを抽出・分析したところ、Mn堆積物から複雑な
vii
微生物群集が検出された(Hyphomicrobium sp. 22.1%; Magnetospirillum sp. 3.2%;
Geobacter sp. 0.3%; Bacillus sp. 0.18%; Pseudomonas sp. 0.03%; 非金属代謝細菌 群 74.2%)。
第 4章では、前章で採取したMn 堆積物の集積培養を行った。固体アガロ ース選択培地上で暗褐色のMn酸化コロニーを単離し、SK3株と命名した。 16S rRNA 遺伝子配列解析結果に基づくと、SK3 単離株の最近縁種は Pseudomonas (Ps.) resinovorans (相同性98.4%; 1398 bp) であったが、当該種におけるMn酸化 能はこれまで報告はなく、更にその相同性の値より本単離株が新たな種に属す る可能性も示唆された。次に、実際の製錬廃液特性を考慮した異なる条件下で SK3単離株のMn酸化能を評価し、過去に研究例の多いPseudomonas MnB1株
(カルチャーコレクションより入手)のそれと比較した。その結果、高濃度の
MgSO4 (2400 mg/L; 製錬廃液に特徴的な溶質)存在下においても、SK3単離株
は100 mg/LのMn2+を速やかに酸化した。なお、比較対照であるMnB1株にお
いては、同条件にて Mn酸化能は完全に消失した。また、Cu2+を微量添加する ことで両株のMn酸化効率は向上したが、特にSK3単離株で顕著であり、その Mn 酸化速度は MnB1 株の 2 倍となった。これより、Mn 酸化反応における
multicopper oxidase酵素の関与がSK3株においても示唆された。SK3単離株の
Mn2+酸化反応によって生成したMn酸化物は、AOS を3.8とする低結晶性バー ネサイト鉱であった。第3、4章の結果より、現場におけるMn2+自然減衰現象 が、SK3株を含むMn酸化細菌群によるMn酸化物の連続再生活性に由来する ことが示唆された。
Mn酸化細菌によって生成するMn酸化物は、自然界に見られる強力な化学 酸化剤の 1 つと言われる。この点から、Mn 酸化反応には、直接的な酵素反応
(微生物活性に起因)および間接的な化学反応(Mn 酸化物に起因)の両者が 貢献するものと考えられる。したがって、第5章では、これら個々の関与を明 確にすることを目的とした。滅菌済み天然Mn酸化物 (NMO) のみを添加した
viii
場合、Mn酸化は化学的な共均衡化 (Mn2+ + MnIVO₂ + H2O MnIII₂O3 + 2H+; 式 2) により、限られた程度しか進行しなかった。これは、産物であるMnIII₂O3に よるNMOの表面不動態化によるものと考えられる。NMOにSK3単離株の細 胞を接種すると、共均衡化と微生物学的 MnIVO₂再生による相乗効果のために、
Mn 酸化反応が著しく促進された。 NMOはまた、コロニー形成の為の表面を 供することで、細胞増殖を促したものと考えられる。これらの効果により、高
MnSO4濃度(2400 mg / L)や高温(35℃)など、元々阻害性の高い複合条件下
でも、SK3単離株は効果的にMn酸化を示すことが可能であった。
前章までに得られた基礎知見に基づいて、連続的バイオフィルターカラム 試験に進むこととした。まず、第6章でカラム充填材(細胞およびMn酸化物 の担持体)のスクリーニングを行った。10 種類の SiO2または炭素系の材料を サイクルMn酸化試験により比較評価した。特に1サイクル目においてMn酸 化速度の差が見られたものの、一旦Mn酸化物が担持体に付着してしまえば、
異なる材料間における差は次第に小さくなった。しかし、全体的なサイクル試 験を通して、炭素系材料においてより高い有効性が認められた。この理由とし て、微生物細胞とMn酸化物が炭素系材料に対してより付着し易いこと、更に、
炭素材料が電子仲介媒体として機能していることが考えられた。最終的に担持 体として活性炭を選択し、活性炭自身が示し得る化学的Mn酸化能についても 評価した。その結果、Mn 酸化は 2 サイクル目以降に大きく低下することが分 かった。これは、生成物(MnIII2O3)による活性炭表面の不動態化に依るもの であった。これらの結果より、次章の活性炭充填カラム内においては、Mn 酸 化反応に次の3 つの因子が同時に関与することが示唆された: (i)微生物学 的Mn2+酸化によるMnIVO2の連続再生(式1)、(ii)MnIVO2の化学的共均衡化に よるMn2+およびMnIII2O3の生成(式2)、(iii) 活性炭表面の化学的 Mn2+酸化に よるMnIII2O3生成(特に初期)。
ix
第 7 章では、ラボスケールの活性炭充填バイオフィルターカラムを作 製し、現場から入手した2種類の実廃液(下流廃液 [Mn2+] 2 mg/L、[SO42-] 780 mg/L; 上流廃液 [Mn2+] 2-5 mg/L、[SO42-] 1500 mg/L)をカラムに供した。現場 にて現在進行中のパイロットスケールカラム試験(ゼオライト充填)では Mn 除去効率が40%程度に留まっているため、これに対する改善策を提案すること を期待して各種実験を行った。実廃液試験により、Mn の完全酸化に必要な接 触時間は、ゼオライトより活性炭使用時の方が短縮されることが改めて確認さ れた。カラムには予めSK3株細胞を増殖させた活性炭(バイオ活性炭)を充填 した上で、水理学的滞留時間 (HRT) 20 minにて下流廃液の通水を開始した。
Mn 酸化細菌が従属栄養性であることから、有機物供給の重要性が明確に示さ れた。酵母抽出物添加時 (65~90%) は、無添加時 (20~40%) と比較して高い Mn除去効率が得られた。より高濃度のMn2+およびSO42-を含有する上流廃液の 処理においては、顆粒状活性炭に粉砕活性炭を7:3の割合で混合することで、
Mn酸化が5~10%程度促進された。結果として、逆洗後でも、Mn酸化効率は順
調に回復し、HRT 40 minにて約85%のMn除去を達成した。本章の結果により、
現場パイロット試験の性能を改善する為には、カラム担持体の変更、Mn 酸化 細菌の事前集積培養、有機栄養素の持続的供給、HRTの最適化が必要であると 考えられる。第 8 章では、カラム試験における使用済み担持体上に蓄積した Mn酸化物の潜在的な付加価値を探索した。As(III) による地下水汚染は重大な 鉱害問題の1つであることから、生物起源Mn酸化物のAs(III) 酸化能について 試験した(H3AsIIIO3 + MnIVO2 + H+ Mn2+ + H2AsVO4- + H2O; 式3)。模擬As(III) 汚染水 (pH 7) にSK3株が生成したMnO2を添加し、同時にSK3株の活性を保 持させたところ、As(III)を効果的により低毒性・低溶解性のAs(V) に酸化する ことができた。この時、式3により生成したMn2+ はSK3株により素早くMnO2
に再生したことから、実質的なMnの溶出を伴わずにAs(III)酸化を完了するこ とが可能であった。
x
第9章では、実験結果の総括および今後の課題等について記述した。
xi Contents
Cover
Abstract ... i
Contents ... xi
List of Tables ... xix
List of Figures ... xxi
Abbreviations ... xxx
Chapter 1 Introduction ... 1
1.1 Manganese (Mn) ... 2
1.1.1 Occurrence of Mn in Earth’s crust ... 2
1.1.2 Application of manganese ... 2
1.1.3 Biological importance of manganese ... 2
1.2 Biogeochemistry of manganese ... 3
1.2.1 Mn(II)-oxidation ... 3
1.2.1.1 Mn(II)-oxidizing bacteria 1.2.1.2 Mn(II)-oxidizing fungi 1.2.2 Mn-reduction ... 9
1.3 Contamination of Mn in aqueous solution ... 11
1.3.1 Aqueous speciation of manganese ... 11
1.3.2 Sources and problems associated with Mn-contaminating wastewater ... 11
1.4 Current techniques used for removal of Mn ... 11
1.4.1 Ion exchange/adsorption and membrane filtration ... 11
1.4.2 Precipitation ... 11
1.4.2.1 Hydroxide precipitation 1.4.2.2 Carbonate precipitation 1.4.2.3 Oxidative precipitation 1.5 Utilization of microbial Mn(II)-oxidation for Mn-contaminating wastewater treatment ... 14
xii
1.6 Bioprocess for the treatment of Mn-contaminating wastewater (biofiltration) ... 20
1.7 Social acceptance for bioremediation technology ... 27
1.8 Application of biogenic Mn-oxide ... 28
1.8.1 Adsorption of toxic metals ... 28
1.8.2 Oxidation of toxic metals and organic wastes ... 31
1.9 Objectives of the thesis ... 33
1.10 Structure of the thesis ... 34
References ... 36
Chapter 2 Methodology ... 46
2.1 Culture medium and chemical reagents used in this study ... 47
2.1.1 Culture media for screening and isolation of Mn(II)-oxidizing bacteria ... 47
2.1.2 Lysogeny (Luria) medium (LB) ... 49
2.1.3 Modified peptone-yeast extract-glucose (PYG-1) medium ... 49
2.1.4 Acidophilic basal salt (ABS) ... 49
2.1.5 Chemical reagents ... 50
2.2 Microorganisms used in this study ... 52
2.2.1 Culture maintenances ... 52
2.2.2 Sub-culturing ... 52
2.3 Experimental conditions ... 53
2.4 Sampling procedure ... 53
2.4.1 Liquid samples ... 53
2.4.2 Solid samples ... 53
2.5 Analytical methods: Liquid analysis ... 54
2.5.1 pH and solution redox potential values measurement ... 54
2.5.2 Cell density ... 54
2.5.3 Storage of sample ... 54
2.5.4 Determination of As(V) and As(III) using molybdenum blue method ... 54
2.5.5 Determination of Fe(II) concentration using O-phenanthroline method ... 55
2.5.6 Determination of total soluble metal concentration ... 52
xiii
2.6 Analytical methods: Solid analysis ... 57
2.6.1 X-ray fluorescence (XRF) ... 57
2.6.2 X-ray diffraction (XRD) ... 58
2.6.3 X-ray absorption near edge structure (XANES) ... 58
2.6.4 Scanning electron microscope (SEM) ... 58
2.6.5 Microwave treatment ... 59
2.6.6 Specific surface area (BET method) ... 59
2.6.7 Zeta-potential measurement ... 59
2.6.8 Fourier transforms infrared spectroscopy (FT-IR) ... 60
2.6.9 Estimation of average oxidation state of Mn in Mn-oxide ... 60
2.6.10 Stability evaluation for As immobilized product... 62
References ... 62
Chapter 3 Natural attenuation of dissolved Mn level in the metal-refinery wastewater treatment system ... 63
3.1 Introduction ... 65
3.2 Materials and Methods ... 66
3.2.1 Collection and analysis of on-site samples ... 66
3.2.1.1 Water sample 3.2.1.2 Mn-deposit sample 3.2.2 Mn(II) removal using natural occurring Mn-oxide ... 67
3.3 Results and Discussion ... 67
3.3.1 Water chemistry of metal-refinery wastewater treatment system ... 67
3.3.2 Bacterial community analysis and proposed mechanism of Mn-deposit formation process... 71
3.3.3 Oxidative removal of Mn(II) using natural occurring Mn-oxide ... 76
3.4 Conclusions ... 79
References ... 80
xiv Chapter 4
Isolation, characterization of Pseudomonas sp. SK3 and its robust
Mn(II)-oxidation activity ... 84
4.1 Introduction ... 86
4.2 Materials and Methods ... 88
4.2.1 Screening for Mn(II)-oxidizing bacteria ... 88
4.2.2 Identification of isolated Mn(II)-oxidizing bacteria ... 88
4.2.3 Mn(II) oxidation test ... 90
4.2.3.1 Effect of initial Mn(II), Cu(II), and MgSO4 concentration 4.2.3.2 Effects of pH and temperature 4.2.3.3 Effect of individual PYG-1 medium components (test for isolate SK3 only) 4.2.4 Characterization of biogenic Mn-precipitates ... 91
4.2.4.1 X-ray diffraction (XRD) 4.2.4.2 X-ray absorption near edge structure (XANES) 4.2.4.3 Scanning electron microscope (SEM) 4.3 Results and Discussion ... 95
4.3.1 Screening of Mn(II)-oxidizing bacteria from Mn-deposit ... 95
4.3.2 Identification of isolate SK3 ... 95
4.3.3 Mn(II) oxidation by Pseudomonas sp. SK3 ... 99
4.3.3.1 Effect of initial [Mn(II)], [Cu2+], and [MgSO4] 4.3.3.2 Effect of pH and temperature 4.3.3.3 Effect of medium components 4.3.4 Analysis of biogenic Mn-oxides produced by Pseudomonas sp. SK3 .... 104
4.4 Conclusions ... 109
References ... 111
Chapter 5 Synergistic effect of natural Mn oxide and Mn(II)-oxidizing bacteria on oxidative removal of Mn(II) from wastewater ... 114
5.1 Introduction ... 116
5.2 Materials and Methods ... 117
5.2.1 Mn(II)-oxidizing bacteria ... 117
xv
5.2.2 Preparation of natural Mn-oxide ... 117
5.2.3 Synergistic Mn(II) removal using natural Mn-oxide and Mn(II)-oxidizing bacteria ... 117
5.2.3.1 Effect of initial [Mn(II)] and [MgSO4] 5.2.3.2 Effect of elevated temperature 5.2.3.3 Mn(II) oxidative removal in acidic condition 5.2.4 Application study of synergistic Mn(II)-oxidative removal from tailing dam wastewater ... 118
5.2.5 Solid characterization ... 119
5.3 Results and Discussion ... 120
5.3.1 Synergistic Mn(II) removal using natural Mn-oxide and Mn(II)-oxidizing bacteria ... 120
5.3.1.1 High [Mn(II)] and [MgSO4] 5.3.1.2 Effect of temperature 5.3.1.3 Mn(II)-oxidative removal in acidic pH 5.3.2 Mn(II)-oxidative removal from tailing dam wastewater ... 127
5.4 Conclusions ... 129
References ... 131
Chapter 6 Searching for bacteria-supporting materials for Mn(II) removal using biofilter column ... 132
6.1 Introduction ... 134
6.2 Materials and Methods ... 135
6.2.1 Characterization of bacteria-supporting materials ... 135
6.2.2 Cycle Mn(II)-oxidative removal experiment ... 135
6.2.3 Characterization of bacteria-supporting materials after cycle Mn(II)-oxidative removal experiment... 136
6.2.4 Mn(II)-oxidative removal using activate carbon ... 136 6.2.4.1 Single batch experiments
6.2.4.2 Cycle experiment 6.2.4.3 Solid characterization
xvi
6.3 Results and Discussion ... 139
6.3.1 Characterization of bacteria-supporting materials ... 139
6.3.2 Cycle Mn(II)-oxidative removal ... 145
6.3.3 Characterization of bacteria-supporting materials after cycle Mn(II)-oxidative removal experiment... 148
6.3.4 Evaluation of bacteria-supporting materials ... 152
6.3.5 Mn(II) oxidative removal by activated carbon at a different pulp density 154 6.3.6 Cycle Mn(II)-oxidative removal in the presence of bio-AC ... 157
6.4 Conclusions ... 161
References ... 163
Chapter 7 Mn(II) oxidative removal from metal-refinery wastewater using biofilter column packed with bio-activated carbon ... 163
7.1 Introduction ... 165
7.2 Materials and Methods ... 166
7.2.1 Mn(II)-oxidizing bacteria ... 166
7.2.2 Collection and analysis of tailing dam wastewater ... 166
7.2.3 Preparation of bio-AC and bio-zeolite ... 166
7.2.4 Preparation of pulverized activated carbon (plvAC) ... 166
7.2.5 Preliminary experiment: Batch Mn removal experiment from actual wastewater by activated carbon, bio-activated carbon, zeolite, or bio-zeolite ... 167
7.2.6 Column experiment ... 168
7.2.6.1 Apparatus 7.2.6.2 Design of column experiment 7.2.6.3 Effect of additional organic carbon on the removal of Mn(II) from tailing dam wastewater by means of biofilter column packed with bio-AC 7.2.6.4 Reduction of short-pass by addition of plvAC 7.3 Results and Discussion ... 171
7.3.1 Characterization of tailing dam wastewater sample ... 171
7.3.2 Mn(II)-removal from tailing dam wastewater using zeolite, bio-zeolite, AC, or bio-AC; [Mn(II)] = 100 mg/L ... 172
xvii
7.3.3 Mn(II)-removal from tailing dam wastewater using zeolite, bio-zeolite, AC,
or bio-AC; [Mn(II)]ini = 5 mg/L ... 177
7.3.4 Cycle Mn(II)-oxidative removal; tailing dam wastewater ([Mn]ini = 5 mg/L) ... 179
7.3.5 Mn(II)-oxidative removal from tailing dam wastewater using biofilter column ... 181
7.3.5.1 Effect of additional organic carbon 7.3.5.2 Effect of addition of pulverized activated carbon, reduction of short-pass, and aeration 7.4 Conclusions ... 188
References ... 190
Chapter 8 Arsenite oxidative removal using biogenic manganese oxide ... 191
8.1 Introduction ... 193
8.2 Materials and Methods ... 195
8.2.1 Mn(II)-oxidizing bacteria ... 195
8.2.2 Natural-occurring Mn oxide ... 195
8.2.3 Preparation of biogenic birnessite ... 195
8.2.4 As(III) oxidation and removal ... 195
8.2.4.1 Natural Mn-oxide 8.2.4.2 Biogenic birnessite 8.2.4.2.1 Effects of pulp densities and initial pHs 8.2.4.2.2 Effects pf the presence of Mn(II)-oxidizing bacteria 8.2.4.3 Analytical method 8.2.5 Reusability of biogenic birnessite; cycle As(III)-oxidation experiment .. 197
8.2.6 Regeneration of Mn-oxide from spent medium as biogenic birnessite ... 197
8.2.7 Biogenic Fe-Mn oxide production from Fe(II)-Mn(II) containing solution198 8.3 Results and Discussion ... 199
8.3.1 As(III) oxidation by natural Mn-oxide ... 199
8.3.2 As(III) oxidation by biogenic birnessite ... 200 8.3.2.1 Effects of pulp densities and initial pHs
xviii
8.3.2.2 Effects of the presence of Mn(II)-oxidizing bacteria
8.3.3 Reusability of biogenic birnessite; cycle As(III)-oxidation experiment .. 208
8.3.4 Regeneration of Mn-oxide from the spent medium as biogenic birnessite 210 8.3.5 Mn(II)-oxidative removal from Fe(II)-Mn(II) containing solution and formation of biogenic Fe-Mn oxide ... 215
8.4 Conclusions ... 216
References ... 217
Chapter 9 Conclusions ... 219
9.1 Conclusions ... 220
9.2 Future recommendation works ... 227
Acknowledgements ... 228
xix List of Tables
Table 1.1 Formation of Mn oxide mineral (amended from Sasaki, 2005) 3
Table 1.2 Examples of naturally occurring Mn-oxide 4
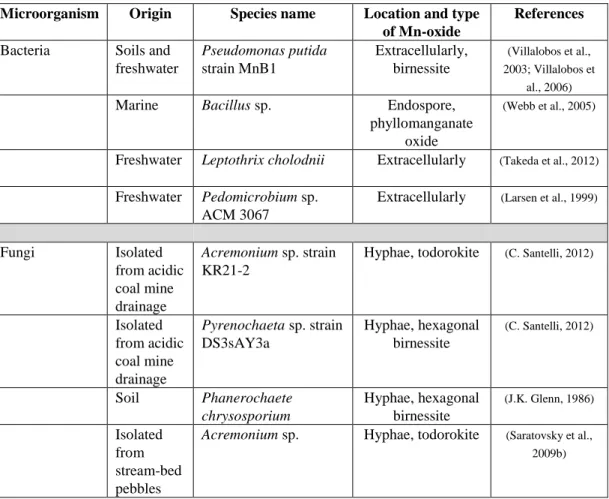
Table 1.3 Examples of Mn(II)-oxidizing microorganisms, its origin, and location of Mn-oxide
5
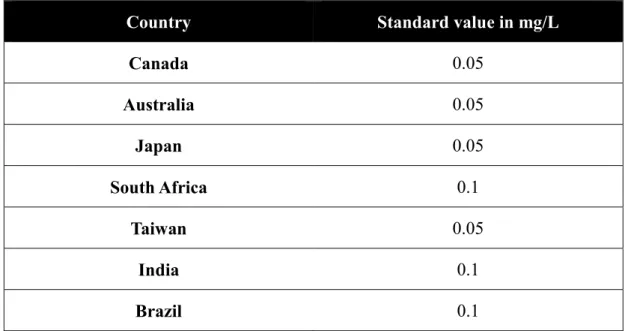
Table 1.4 Standards for manganese levels in drinking water in selected countries
12
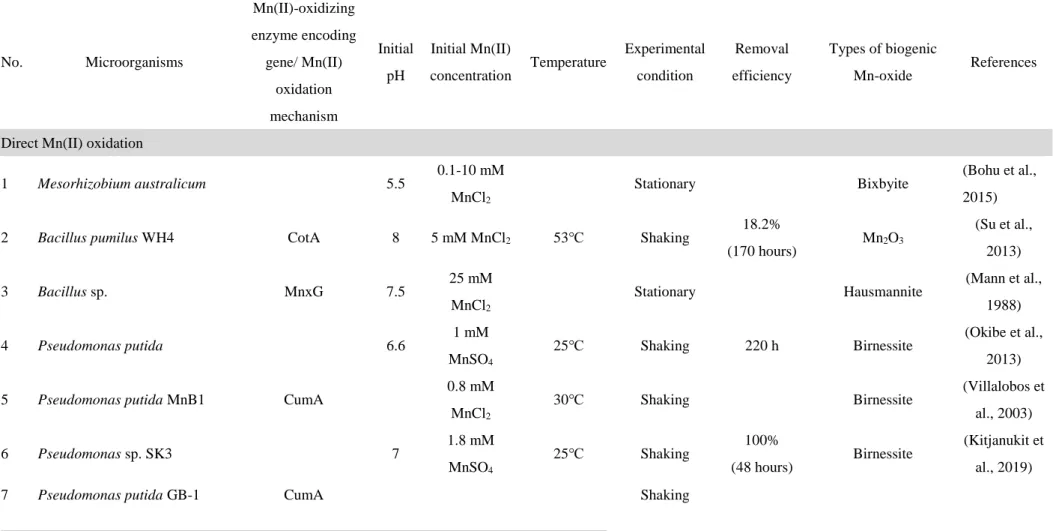
Table 1.5 Studies regarding utilization of Mn(II)-oxidizing microorganisms (bacteria and fungi) for Mn(II)-contaminating wastewater treatment.
16
Table 1.6 Studies regarding Mn(II)-removal by biofilter (modified from Tekerkopoulou, 2013)
23
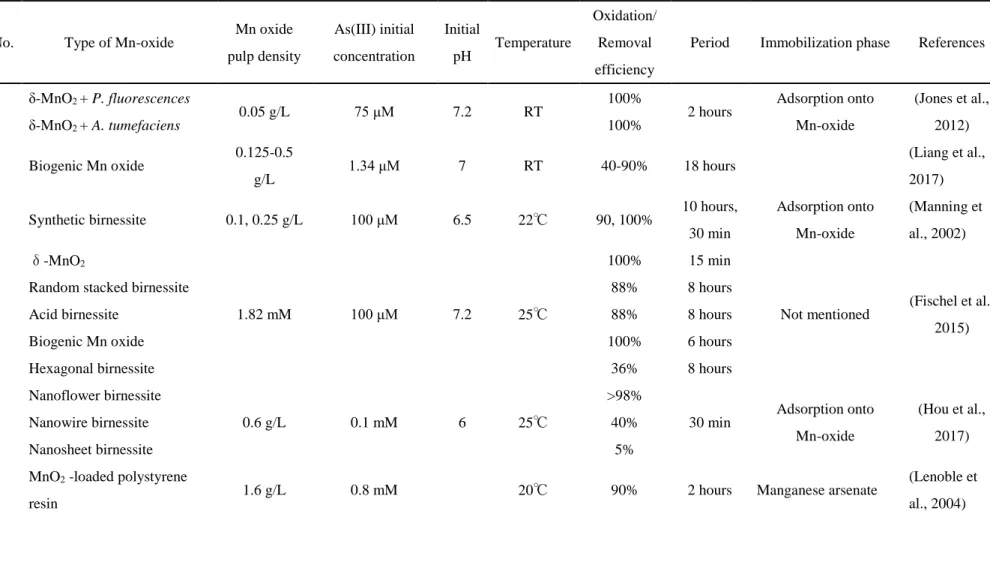
Table 1.7 Studies regarding As(III)-oxidation by Mn-oxide 32
Table 2.1 Microbial culture maintenances 52
Table 3.1 Characteristics of the wastewater and Mn-deposit samples (taken from the inlet and outlet of the wastewater pipe)
69
Table 3.2 Species names under the genera Hyphomicrobium, Magnetospirillum, Geobacter, Bacillus and Pseudomonas detected in the bacterial community structure shown in Figure 3.4.
75
Table 4.1 Touchdown PCR protocol 89
Table 4.2 NCBI accession numbers used to construct the phylogenetic tree
93
Table 4.3 PCR condition for 16s rRNA amplification 96 Table 5.1 Composition of tailing dam wastewater collected from the
metal-refinery wastewater treatment facility
119
xx
Table 6.1 Surface properties of bacteria-supporting materials 143 Table 6.2 Zeta-potential of bacteria-supporting materials before and after
cycle Mn(II)-oxidative removal
148
Table 6.3 Evaluation of bacteria-supporting materials based on cycle Mn(II)-oxidative removal experiment and physical characterization
153
Table 7.1 Column technical information 168
Table 7.2 Composition of tailing dam wastewater from metal-refinery wastewater treatment facility
171
Table 8.1 Concentration of Total As, Fe, and Mn in the spent medium from scorodite crystallization before and after dilution
198
xxi List of Figures
Figure 1.1 Measurement of Mn(III)-pyrophosphate complexes during bacterial Mn(II)-oxidation (Webb et al., 2005)
6
Figure 1.2 The manganese geochemistry cycle in nature 10 Figure 1.3 Comparison between conventional chemical and bioprocess for
Mn(II)-contaminating wastewater treatment
15
Figure 2.1 Standard curve of Fe(II) concentration using o-phenanthroline method
56
Figure 3.1 X-ray diffraction patterns of the Mn-deposit collected from the metal-refinery wastewater pipe. ★; α-MnIVO2 (JCPDS 44-141),
■; MnIII2O3 (JCPDS 41-1442), ▲; Fe2O3 (JCPDS 39-1346).
70
Figure 3.2 Mn K-edge spectra of Mn-deposit sample collected from metal-refinery wastewater treatment system (solid line). Linear combination fitting results (broken line). As Mn standards, MnIISO4, MnIII2O3, and δ-MnIVO2 were used.
70
Figure 3.3 Bacteria community structure (genus level) in Mn-deposits collected from the metal-refinery wastewater treatment system (full data). Putative Mn-metabolizing genera were highlighted in red.
74
Figure 3.4 Bacterial community structure in the Mn-deposit collected from the metal-refinery wastewater pipe. Values in brackets indicate the total number of sequences and its percentage.
74
Figure 3.5 Schematic image of the proposed Mn-deposit formation process in the water pipe
76
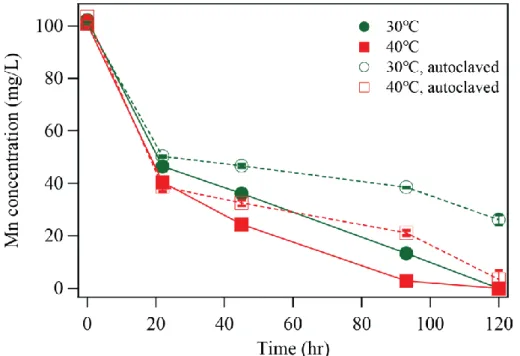
Figure 3.6 Mn(II)-oxidative removal by raw (solid symbols with solid line) and autoclaved (open symbols with broken lines) Mn-deposit collected from wastewater pipe under different temperature of 30℃ and 40℃.
77
xxii
Figure 3.7 The changes in pH during Mn(II) oxidative removal by raw (solid symbols with solid line) and autoclaved (open symbols with broken lines) Mn-deposit collected from wastewater pipe under different temperature of 30℃ and 40℃.
77
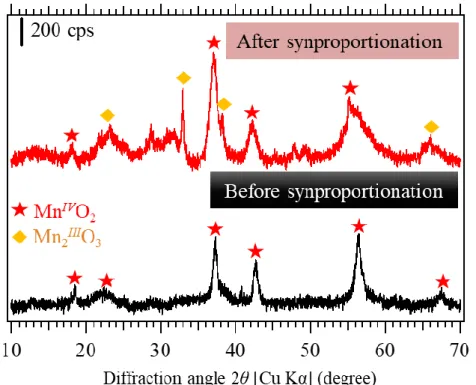
7Figure 3.8 X-ray diffraction patterns of the MnIVO2. ★; α-MnIVO2 (JCPDS 44-141), ♦; MnIII2O3 (JCPDS 41-1442)
78
Figure 4.1 Screening of Mn(II)-oxidizing bacteria from Mn-deposit.
Black-brown colonies indicate Mn(II)-oxidizing activity. Single colony isolation was repeated for four times.
96
Figure 4.2 Gel electrophoresis of PCR product showing the size 1400-1500 bp, a typical size for 16S rRNA. A-G indicated the variation of template concentration showed in table 4.3
97
Figure 4.3 Phylogenetic tree of isolate SK3 in relation to known Pseudomonas spp., based on 16S rRNA gene sequences, constructed by the neighbor-joining method (Bacillus sp. SG1 as outgroup). Known Mn(II)-oxidizing strains are marked (★).
Scale bar indicates the number of nucleotide substitutions per site.
98
Figure 4.4 Mn(II) oxidative removal by isolate SK3 (solid symbols with solid lines) in comparison with Ps. putida MnB1 (open symbols with broken lines) under different conditions (pHini 7.0, 25℃).
(a) Effects of the initial Mn(II) concentration (100 mg/L or 200 mg/L) was tested in the presence (■,□) or absence (●,○) of 3 μM Cu(II). [MgSO4] = 24 mg/L (present originally in PYG-1 medium). (b) Effects of increasing dose of MgSO4 was tested by adding extra MgSO4 to the final concentration of 240 mg/L (●,
○), 1200 mg/L (▲,△) or 2400 mg/L (♦,◇), in comparison with the controls (■,□; 24 mg/L MgSO4 originally present in PYG-1 medium). [Mn2+] = 100 mg/L. [Cu(II)] = 3 μM.
102
Figure 4.5 Mn(II) oxidative removal rates at different initial pHs (a) and temperatures (b). ●; isolate SK3 with 3 μM Cu(II) (calculated for the time period of 0-48 h). ♦; isolate SK3 without Cu(II) (calculated for the time period of 0-63 h). ○; Ps. putida MnB1 with 3 μM Cu(II) (calculated for the time period of 0-72 h).
Initial conditions: [Mn(II)]=100 mg/L; [MgSO4] = 24 mg/L
103
xxiii
(originally present in PYG-1 medium). (a) Temperature was set at 25℃. (b) The initial pH was set at 7.0. Fitting curves were drawn only for isolate SK3 with 3 μM Cu(II).
Figure 4.6 Effect of individual PYG-1 medium components on Mn(II) oxidative removal. Changes in the (a) Mn concentration, (b) pH value and (c) cell density during Mn(II) oxidation are shown.
The following components were omitted from PYG-1 medium:
▲; -Glu, ♦; -YE/Peptone, □; -PIPES, ✕; -Glu/YE/Peptone, ⧗;
-Peptone (YE lowered to 0.01%), ○; Control. Initial conditions:
[Mn(II)]=100 mg/L; [Cu(II)] = 3 μM; [MgSO4]=24 mg/L (originally present in PYG-1 medium) at pH 7.0, 25℃.
103
Figure 4.7 XRD diffraction patterns of Mn-precipitates recovered during Mn(II) oxidation by isolate SK3 at 0 h (a), 24 h (b), 48 h (c) and 72 h (d), in comparison with chemically synthesized acid birnessite (e). ●; birnessite (JCDD 43-1456). Sampling times of the Mn-precipitates correspond to those shown in Fig. 4.4 (a) (■;
+Cu(II)). SEM images of the sample (d) and (e) are shown in (d’) and (e’), respectively.
107
Figure 4.8 Changes in the Mn AOS of Mn-precipitates produced by isolate SK3 (a) or Ps. putida MnB1 (b). The ratios of Mn(II) (white), Mn(III) (grey) and Mn(IV) (black) were calculated from the linear combination fitting result (broken lines) of Mn K-edge XANES spectra (solid lines). Sampling points (24, 48, 72 and 120 h) of the Mn-precipitates correspond to those shown in Fig.
4.4 (a) (■ □; +Cu2+). As Mn standards, MnIISO4, MnIII2O3 and δ-MnIVO2 were used. AOS stands for average oxidation state.
Fitting results with R-factors < 0.003 were considered reliable.
108
Figure 5.1 Changes in Mn concentration (a) and pH (b) during Mn(II)-oxidative removal in the presence of sterilized natural Mn oxide (0.5% (w/v)) and Pseudomonas sp. SK3 at different initial Mn(II) concentration of 100, 200, and 400 mg/L. Closed and opened symbols indicated NMO/SK3 and NMO only, respectively.
121
Figure 5.2 Changes in Mn concentration (a,b) and pH (c,d) during Mn(II)-oxidative removal in the presence of sterilized natural Mn oxide (0.5% (w/v)) and Pseudomonas sp. SK3 at an
123
xxiv
incubation temperature of 30℃ (a,c) and 35℃ (b,d). Initial MnSO4 concentration was set to 2400 mg/L (100 mM) and 4800 mg/L (200 mM) in addition to 24 mg/L presented originally in PYG-1 medium.
Figure 5.3 X-ray diffraction pattern of original natural Mn-oxide and precipitates after selective collection after Mn(II) oxidative removal using natural Mn oxide/SK3 cells and natural Mn oxide. ■: MnO2, ●: Mn2O3 JCPDS 41-1442, ★: birnessite JCDD 43-1456.
124
Figure 5.4 Changes in Mn concentration (a, d), pH (b, e), and cell density (c) during Mn(II) oxidative removal in the presence of natural Mn-oxide/Pseudomonas sp. SK3 cells (solid symbols) and natural Mn oxide only (open symbol) at different initial pH of 4.0-7.0.
126
Figure 5.5 Changes in Mn concentration (a), pH (b), and cell density (c) during Mn(II) oxidative removal from tailing dam wastewater in the presence of natural Mn-oxide/Pseudomonas sp. SK3 cells (solid symbols) or planktonic cells only (open symbol) at different yeast extract concentration of 0, 0.005, or 0.01% (w/v).
128
Figure 5.6 Purpose mechanism for synergistic Mn(II)-oxidative removal by natural Mn-oxide and Mn(II)-oxidizing bacteria (Pseudomonas sp. SK3)
130
Figure 6.1 Bacteria-supporting materials used in this study 138 Figure 6.2 Secondary electron images of bacteria-supporting materials at
magnification of 100x and 500x.
140
Figure 6.3 X-ray diffraction pattern of bacteria-support material tested in this study. A; anorthite (CaAl2Si2O8 ; JCPDS 41-1486), aS (amorphous silica), C; carbon (JCPDS 82-1691), Q; quartz (JCPDS 46-1045), Z; zeolite (JCPDS 43-016
144
Figure 6.4 Cycle Mn(II)-oxidative removal in the presence of various bacteria-supporting materials and Pseudomonas sp. strain SK3 showing Mn concentration (a, a’), pH (b, b’), and planktonic cell
146
xxv
density (c, c’). After each cycle, the spent media were replaced with fresh sterilized media without re-inoculation of cells.
Symbol indicators: (a, b, c) pumice (▲), porous ceramic (✕), zeolite (
■
), perlite (◇
), activated carbon (●). (a’. b’, c’) fuji sand (●), black sand (□
), hydroculture (▲), gravel (✕), smoked rice husk (♦).Figure 6.5 Mn removal efficiency in the presence of various bacteria-supporting materials and Pseudomonas sp. strain SK3.
The values were calculated from Mn removed at a fixed time interval of 20 hours.
147
Figure 6.6 Secondary electron images of bacteria-supporting materials before and after cycle Mn(II)-oxidative removal
149
Figure 6.7 Changes in Mn concentration (a) and pH (b) in the presence of activated carbon at 1.25, 2.5, 5, and 10% (w/v). X-ray diffraction pattern of spent activated carbon collected after experiment showing different Mn-oxide formed (c). ●: Mn3O4/C JCPDS 00-24-0734, ■: Mn2O3 JCPDS 41-1442, C: carbon JCPDS 75-1621.
155
Figure 6.8 Changes in Mn concentration (a) and pH (b) and cell density (c) in the presence of activated carbon at 0.25, 0.5, and 1% (w/v).
X-ray diffraction pattern of spent activated carbon collected after experiment showing different Mn-oxide formed (d). ●: Mn3O4/C JCPDS 00-24-0734, B: birnessite JCPDS 43-1456.
156
Figure 6.9 Changes in Mn concentration (a) and pH (b) and planktonic cell density (c) in the presence of activated carbon at 5% (w/v) during cycle Mn(II) oxidative removal. Sterile control was showed in open symbol. X-ray diffraction pattern of spent activated carbon collected after each cycle showing different Mn-oxide formed (d). ●: birnessite JCPDS 43-1456, ♦: Mn2O3
JCPDS 41-1442, ▲: carbon JCPDS 75-1621.
159
Figure 6.10 SEM images of activated carbon collected after 3rd cycle showing Mn(II)-oxidizing bacteria, Pseudomonas sp. SK3 colonized inside activated carbon with biogenic birnessite.
160
xxvi
Figure 6.11 Proposed mechanism for cycle Mn(II)-oxidative removal in the presence of absence of Mn(II)-oxidizing bacteria
160
Figure 7.1 Packing of bio-AC into glass chromatography tube 168 Figure 7.2 Schematic diagram of the bio activated carbon column reactor 169 Figure 7.3 Particle size distribution of pulverized activated carbon prepared
by ball mill
170
Figure 7.4 Changes in Mn concentration (a), pH (b), and cell density (c) during Mn(II) oxidative removal from tailing dam wastewater in the presence of bio-zeolite (●), zeolite (○) bio-AC (■), and AC (□)
174
Figure 7.5 Mn removal efficiency from tailing dam wastewater in the presence of zeolite, bio-zeolite, AC, or bio-AC. The value calculated from fixed incubation time of 50, 48, and 100 hours for cycle 1, 2, and 3, respectively.
175
Figure 7.6 X-ray diffraction pattern of the spent bio-AC collected after each cycle of Mn(II)-oxidative removal from tailing dam wastewater.
●: birnessite (JCPDS 43-1456), C: carbon (JCPDS 75-1621)]
175
Figure 7.7 X-ray diffraction pattern of the spent AC collected after each cycle of Mn(II)-oxidative removal from tailing dam wastewater.
▲: Mn2O3 (JCPDS 41-1442), C: carbon (JCPDS 75-1621).
176
Figure 7.8 Changes in Mn concentration (a, c) and pH (b, d) in the presence of zeolite, activated carbon, bio-zeolite, or bio-activated carbon at different pulp densities of 25%, 50% and 100% (v/v)
178
Figure 7.9 Changes in Mn concentration (a), Mn removal efficiency (b), and pH (c) in the presence of bio-AC (100% (v/v)) supplemented with different yeast extract concentration. Close and open symbol indicated value for output and feed, respectively. Contact time was fixed to 10 min (gray shade indicated cycles with 5 min contact time)
180
Figure 7.10 Three main Mn(II) removal reaction occurred by bio-AC. 182
xxvii
Figure 7.11 Changes in Mn concentration (a), Mn removal efficiency (b), and pH (c) in wastewater feed and column effluents in the presence of yeast extract (■) and without (●).
183
Figure 7.12 Correlation between Mn removal efficiency and Mn initial concentration in the presence of different concentration of yeast extract
184
Figure 7.13 Photograph (a; above) and stereoscope micrograph (B and C) showing biogenic Mn-oxide coated on silicone tube surface.
SEM micrograph (E and F) revealed that bacteria cells are associated with Mn-oxide
184
Figure 7.14 Changes in Mn concentration (a), Mn removal efficiency (b), and pH (c) in wastewater feed (▲) and column effluent (● and
■). ● and ■ indicate column packed with bioAC/plvAC and bioAC, respectively.
187
Figure 8.1 Proposed mechanisms for As(III) oxidation by δ-MnO2 over 48 hours (Fischel et al., 2015)
193
Figure 8.2 Changes in total As concentration (a), As(III) concentration (b), solution pH (c), and Mn concentration (d) during As(III) oxidation in the presence of 0.02% (
●, ○
), 0.05% (■, □
), and 0.1% (▲, △) natural Mn-oxide (NMO) and the Mn(II)-oxidizing bacteria, Pseudomonas sp. strain SK3 (solid symbol, solid line) and sterile control (open symbol, broken line).200
Figure 8.3 X-ray diffraction pattern of precipitate selectively collected after As(III) oxidation in the presence of natural Mn-oxide (NMO) and Pseudomonas sp. strain SK3. ■: α-MnO2 (JCPDS 44-141),
●: Mn2O3 (JCPDS 41-1442), and ★; birnessite (JCPDS 43-1456) 200
Figure 8.4 Changes in total As concentration (a), As(V) concentration (b), solution pH (c), and Mn concentration (d) during As(III) oxidation in the presence of 0.125% (
●
), 0.25% (■), and 0.5%(▲) biogenic birnessite.
204
xxviii
Figure 8.5 Changes in As(III) concentration (a), Total As concentration (b), Mn concentration (c), and pH (d) during As(III) oxidation in the presence of 0.1% biogenic birnessite at initial pH of 3.0, 4.0, 5.0, 6.0, or 7.0.
205
Figure 8.6 Changes in As(III) concentration (a), Total As concentration (b), Mn concentration (c), and pH (d) during As(III) oxidation in the presence of 0.1% (●,○) or 0.2% (■, □) biogenic birnessite. Open and close symbols indicated the sterile control and the presence of Mn(II)-oxidizing bacteria, respectively
206
Figure 8.7 Changes in Mn/As molar ratio during As(III) oxidation in the presence of 0.1% (●,○) or 0.2% (■, □) biogenic birnessite. Open and close symbols indicated the sterile control and the presence of Mn(II)-oxidizing bacteria, respectively.
207
Figure 8.8 Changes in As(III) concentration (a) , total As concentration (b), total Mn concentration (c), pH (d), cell density (e), and redox potential (f) during cycle As(III)-oxidation using 0.1% biogenic birnessite. ● and ■ indicate sterile control and inoculated culture (Pseudomonas sp. SK3), respectively.
209
Figure 8.9 Changes in soluble Mn concentration (a), pH (b), and cell density (c) during Mn(II)-oxidation from Mn(II)-containing spent medium for Mn-oxide regeneration purpose.
212
Figure 8.10 Changes in Mn concentration (a), total Fe/Fe(II) concentration (b,b’), pH (c), cell density (d), and Eh (e) during Mn(II) oxidation in Fe(II)-Mn(II) containing solution
214
Figure 8.11 X-ray diffraction pattern of the precipitates formed after Mn(II)-oxidation in Fe(II)-Mn(II) containing solution experiment. ●; birnessite JCPDS 43-1546, ■; lepidocrocite PDF 00-044-1414.
215
Figure 9.1 Proposed flowsheet of bioprocess for Mn(II)-contaminating metal-refinery wastewater treatment using biofilter column
226
xxix
Figure 9.2 Proposed flowsheet of bioprocess for Mn(II)-contaminating metal-refinery wastewater treatment and utilization of derived biogenic birnessite for As(II)-oxidation processes
xxx Abbreviations
AC Activated carbon
As(III) arsenite (H3AsO3) As(V) arsenate (H2AsO4−)
ATR-FTIR attenuated total reflection-Fourier transform infrared spectroscopy
BET Brunauer–Emmett–Teller
bioBir Biogenic birnessite
EPA environmental protection agency EPS extracellular polymeric substances Fe(II) ferrous iron (Fe2+)
Fe(III) ferric iron (Fe3+)
FT-IR Fourier transformed infrared spectroscopy HBS heterotrophic basal salts
IAP ion activity products
ICP-OES inductively coupled plasma optical emission spectrometry
NMO Natural Mn-oxide
PCR polymerase chain reaction
PlvAC Pulverized acitivated carbon
SEM scanning electron microscope
SSA specific surface area
TCLP toxicity characteristic leaching procedure TG-DTA thermo gravimetry differential thermal analysis
w/v weight per volume
XRD X-ray diffraction
XAFS X-ray absorption fine structure XANES X-ray absorption near-edge structure [ ] concentration of ion species
[ ]ini initial concentration of ion species in solution
- 1 -
Chapter 1
Introduction
- 2 -
1.1 Manganese (Mn)
Manganese is one of the first row of transition elements and can exist in the oxidation states 0, +2, +3, +6, and +7 attribute to the removal of electron from 4s and 3d orbitals. In nature, only +2, +3, and +4 oxidation states are commonly found. Of these three oxidation states, only Mn in +2 oxidation state can occur as a free ion in aqueous solution (both inorganic/organic complexes); as insoluble phosphates (Mn3(PO4)2) or carbonates (MnCO3); as a minor constituent in other minerals. Mn in +3 oxidation state can occur in aqueous solution only when it is complexed with organic ligands such as citrate, pyrophosphate, and pyoverdin.
1.1.1 Occurrence of Mn in Earth’s crust
Mn is found in combination with another element instead of a free element in nature.
For example, pyrolusite (MnO2), psilomelane (BaMn9O16(OH)4), and manganite (Mn2O3H2O). These Mn oxides mostly originated formed by reprecipitation of dissolved manganese (Post, 1999).
1.1.2 Application of manganese
Most of Mn has been used in iron and steel making industries. Due to its sulfur-fixing, deoxidizing and alloying properties, it could remove excess dissolved oxygen, sulfur and phosphorus in order to improve the strength, hardness, and resistance to corrosion (Verhoeven, 2007).
1.1.3 Biological importance of manganese
Mn is an important trace element in a biological system. It participates in many
- 3 -
enzyme systems in microbial (glucose metabolism), plant (photosystem), and animal (glycogen metabolism) as a cofactor.
1.2 Biogeochemistry of Mn 1.2.1 Mn oxidation
In nature, Mn(II) is released through the weathering of igneous and metamorphic rock and is oxidized, forming more than 30 known Mn(II,III), Mn(III), Mn(IV), or mixed Mn(III,IV) oxide/hydroxide minerals (Post, 1999). Table 1.1 summarized the possible oxidation reaction of Mn ions and its oxides.
Table 1.1 Formation of Mn oxide mineral (amended from (Sasaki, 2005))
Reaction AOS Examples of Mn oxide mineral formed
Mn2+ + 1/2O2 + H2O MnO2 + 2H+ 4 Pyrolusite (β-MnO2), vernadite (δ-MnO2) Ramsdellite (γ-MnO2)
Todorokite
([Ca, Na, K][Mg, Mn]Mn5O12・H2O) Buserite
([Ca, Na, K][Mg, Mn]Mn6O14・5H2O) Birnessite
([Ca, Na]Mn7O14・2.8H2O) Mn2+ + 1/4 O2 + 3/2H2O MnOOH+
2H+ 3 Manganite (γ-MnOOH)
Groutite (α-MnOOH) Feitnechtite (β-MnOOH) 3Mn2+ + 1/2 O2 + 3H2O Mn3O4 + 6H+ 2.67 Hausmannite (Mn3O4) Mn3O4 + 2H+ 2MnOOH+ Mn2+ 3 Manganite (γ-MnOOH)
Groutite (α-MnOOH) Feitnechtite (β-MnOOH)
Mn3O4 + 4H+ MnO2 + 2Mn2+ +2H2O 4 Pyrolusite (β-MnO2), vernadite (δ-MnO2) Ramsdellite (γ-MnO2)
Todorokite
([Ca, Na, K][Mg, Mn]Mn5O12・H2O) Buserite
([Ca, Na, K][Mg, Mn]Mn6O14・5H2O) Birnessite
([Ca, Na]Mn7O14・2.8H2O)
2MnOOH + 2H+ MnO2 + Mn2+ + 2H2O 4 Pyrolusite (β-MnO2), vernadite (δ-MnO2) Ramsdellite (γ-MnO2)
Todorokite
([Ca, Na, K][Mg, Mn]Mn5O12・H2O) Buserite
([Ca, Na, K][Mg, Mn]Mn6O14・5H2O) Birnessite
([Ca, Na]Mn7O14・2.8H2O)
*AOS: Average oxidation state
- 4 -
Owing to the high activation energy of Mn(II)-oxidation, the reaction mostly catalyzed by either mineral surfaces or enzymes. Many studies found that Mn biooxide produced in the laboratory have a similar structure to Mn oxides found in the environment. Table 1.2 showed examples of Mn-oxide found from the different natural environments such as terrestrial, freshwater, marine, and artificial structure.
Variety of Mn-oxide phases was indicated but most of them categorized to high AOS oxide (i.e. vernadite, todorokite, buserite, and birnessite). Those finding lead to further support to the notion that most natural Mn oxides are of biological origin.
Table 1.2 Examples of naturally occurring Mn-oxide
Origin Type of Mn-oxide References
Lake sediment Vernadite (α-MnO2) (Wehrli et al., 1995)
Eutrophic lake H+-birnessite (Friedl et al., 1997)
Black sea δ-MnO2 (Tebo et al., 2004)
Pinal Creek Todorokite and 7-Å phyllomanganate
(Lind and Hem, 1993)
Hot-spring deposit, Yuno-Taki falls
Buserite and 7-Å phyllomanganate
(Bilinski et al., 2002)
Hot-spring deposit, Yuno-Taki falls
Todorokite (Mita et al., 1994)
Hot-spring, Sambe Birnessite (Okibe et al., 2013)
Hot-spring, Satsuma-Iwo Jima island
Buserite-like phyllomanganate (Tazaki, 2000)
Hot-spring, Asahidake Todorokite (Mita and Miura, 2003)
Oceanic nodule Birnessite, todorokite, and vernadite
(Burns et al., 1983)
Streambed, Kikukawa river Buserite-like phyllomanganate (Tani et al., 2003)
Galapagos mounds Todorokite (Lalou et al., 1983)
Tailing dam Crystalline α-MnO2 (Kitjanukit et al., 2019)
- 5 -
The following sections described how bacteria and fungi oxidize Mn(II).
1.2.1.1 Mn(II)-oxidizing bacteria
The existence of Mn-oxidizing bacteria was first described century ago (Jackson, 1901). Since their discovery, different kinds of bacteria and fungi with taxonomically related or unrelated have been reported in significant number.
Bacteria catalyze Mn(II) oxidation via direct and indirect pathways. For indirect pathway, this occurs when the bacteria (i) modify the pH and/or redox potential of the aqueous environment which will trigger chemical Mn(II)-oxidation, or (ii) secrete some metabolic products that can oxidize Mn(II) (Van Veen, 1972; Bromfield, 1979).
The direct Mn(II)-oxidation pathway involved enzymatic reaction and on a molecular basis, some degree of commonality was found among several phylogenetically unrelated strain. The studied bacteria possess multicopper oxidase (MCO) enzyme-encoding genes with sequence similarity. Those genes included MnxG (Bacillus sp. SG-1 (Dick et al., 2008)), CopA (Brevibacillus panacihumi MK-8 (Zeng et al., 2018)), MofA (Leptothrix discophora SS-1 (Corstjens et al., 1997)), CumA (Pseudomonas putida GB-1 (Francis and Tebo, 2001)), MoxA (Pedomicrobium sp.
ACM 3067 (Ridge et al., 2007)), and MopA (Erythrobacter sp. SD-21 (Nakama et al., 2014)). On a physiological basis, Mn(II)-oxidizing bacteria are divided into 3 groups.
Group I; oxidize free Mn2+ ions by utilizing O2 as a terminal electron acceptor, Group II; oxidize pre-bound Mn2+, and Group III; oxidize Mn2+ with H2O2 as oxidant catalyzed by catalase. Some bacteria could conserve energy from Mn2+ (group I, subgroup Ia and group II). However, if MCO hypothesis is true, Mn(III) must be detected as an intermediate of Mn(II) oxidation to Mn(IV) since the enzyme all oxidize their substrates via one-electron transfer reaction (Solomon et al., 1996). Up to date, no MCO has been purified in quantities sufficient for biochemical study and
- 6 -
no MCO encoding gene has been successfully expressed in a foreign host.
Attempt to prove the existence of Mn(III) intermediate has been done using In situ XANES. Unfortunately, no Mn(III) was observed but just a simultaneous reduction of Mn(II) and increasing of Mn(IV) peaks (Bargar et al., 2000). Later in 2003, Mn(III)-PP (PP; pyrophosphate) was successfully detected (increase and decrease) during oxidation of Mn(II) to Mn(IV) by endospore of Bacillus sp. (Webb et al., 2005). There was no significant change in Mn(III)-PP concentration in the absence of endospore, indicating that the decreasing must be due to its further oxidized to Mn(IV) (Fig. 1.1).
Figure 1.1 Measurement of Mn(III)-pyrophosphate complexes during bacterial Mn(II)-oxidation (Webb et al., 2005)
- 7 -
The importance of MCO encoding genes in Mn(II)-oxidation was exemplified using gene knockout method. A mutant strain of Pseudomonas putida GB-1 missing MofA and/or MnxG gave different Mn(II)-oxidation behavior. A mutant lack of both MofA and MnxG lost Mn(II)-oxidation activity; whereas a mutant lack of MofA or MnxG still can oxidize Mn(II) but in slower speed compared to wildtype (Geszvain et al., 2013).
1.2.1.2 Mn(II)-oxidizing fungi
Different form bacteria, fungi excrete Mn(II)-oxidizing enzyme (ex: Mn peroxidase) to catalyze Mn(II) oxidation. Commonly, Mn(II)-oxidizing fungi is known as lignin-degrading fungus, as they oxidize Mn(II) to Mn(III)-complex. The complex acts as an oxidant for organic materials to break down into smaller organic compounds which serve the fungus as nutrition (Glenn et al., 1986; Santelli et al., 2011). Although fungi are generally more robust than bacteria, but due to the slow growing and large biomass of fungi, it might be undesirable for some application.