景 気 浮 揚 の 陰 で 衰 弱 す る 日 本 の 経 済 力
経済規模の縮小,信用収縮,税収激減,これをどう打開すべきか
菊 池 英 博
2004年に入り,日本の景気回復が囃されており,2001年 4月にスタートした小泉経済政策が 順調に推移しているように主張する見解がある。
しかし,政府や中央銀行から公表されているデータで見ると,実体経済は惨憺たる状況であ る。企業間信用は大幅に縮小して信用収縮が実体経済の縮小を促進し,経済規模の縮小が目立 ち,税収は激減している。デフレは国民生活の末端まで浸透し,奇怪な事件が頻発し,伝統的 な日本の社会基盤が崩壊に瀕している。
こうした現状を分析し,その打開策を提案したのが,この論文である。
私は数年前から毎年 9月や12月に,New Yorkと
Washingtonの金融や経済関係の会議に
出席し,日米の経済,国際金融の動向などについて,報告し,討論に参加している。2004年も 9月に現地に招かれ,日本経済と金融問題に関して報告し,とくにWashingtonの Federal Reserve Board(連邦準備制度,中央銀行)では,Governor Ben Bernankeにも面談し,意
見交換した。
ここに寄稿する論文は,そのときに発表するために書いた拙稿である。現地の会議では,多 くの参加者から賛同が得られたし,今後の日本経済を分析する上で,有意義な一石を投じたの ではないかと えるので,ここに寄稿するものである。本稿では,要約を日本語で書き,本文 は英文である。
*本論の要約
(1) 過去 3年 6ヶ月の日本経済をみると,マクロ経済指標で改善したデ−タは何ひとつな い。2004年度の税収見込みは,1986年並み(18年前)の水準に過ぎない。経済規模が 縮小し,信用収縮が目立つ。企業間信用で見ると,過去 4年間で20兆円を超す信用収 縮が起きている(図表 3,4,5)。
(2) 小泉経済政策は,典型的なデフレ政策である。デフレが進んでいる時に,緊縮財政を 実施し,不良債権を加速処理しているために,GDPデフレーター(物価の総合的な
経営論集 第14巻第1号 2004年 57〜77頁 柱が偶数・奇数で違う
1頁柱にノンブルをいれる
校正
指数)でみたデフレ率は,一段と大きくなっている(図表 1)。
財政をみると,2000年度に50.7兆円あった税収は,わずか 3年で 9兆円も減少し,
2004年度には41.7兆円(1986年度並み)まで激減している。近代の歴史上,これほど 短期間に税収が激減したのは,大恐慌以来である。これに伴い,政府債務も増加し,
小泉構造改革の一翼を担う「税制改革(財政赤字解消・政府債務減少)」は,全く逆の 結果を生んでいる。これは,緊縮財政の結果であり,財政支出(とくに公共投資と財 政投融資)の減額が,財政赤字を拡大させ,実体経済を大きく疲弊させている。
この失政が,一大増税政策に結びついており,国家経済を見ると,忌々しき現状であ る。
(3) 小泉経済政策の失敗は,1930年代の日米のデフレがもたらした経験を顧みず,歴史的 教訓を無視した政策を取っているからである。
歴史的教訓とは
「デフレが進んでいるときに緊縮財政をとれば,国民所得は減少し,物価は更に下 落し,財政赤字が拡大して,政府債務は増加する」ということである。
小泉内閣 3年半の実績を見ると,歴史的教訓どおり,実体経済は悪化している。違 いは,現在は管理通貨制であるために,日本銀行が自由に通貨供給量を増加できるこ と(30年代恐慌時代の日米では,金本位制で金の量によって通貨供給量が左右され た),30年代ほど短期間に一挙に国民所得の下落や物価の急落が発生していないこと である。
一挙に国民所得が減少していないのは,国民が貯蓄を取り崩して必死に生活してお り,これが消費の一定割合を維持しているからであり(図表 8),また緊縮財政の度 合いが30年代の時ほど,急激でないことである。
しかし デフレの下で,緊縮財政と不良債権の加速処理が実体経済に与えるインパ クトは,極めて大きく,日本は真綿で首を絞められているような状況であるといえよ う。社会問題への悪影響は計り知れない。
(4) デフレ経済のもとでは,実質成長率は幻想に過ぎない。デフレ率が高いから,その裏 返しで実質成長率が高いのであって,デフレによる経済規模の縮小と債務負担の増加 の方が,物価下落による購買力の増加よりも,はるかに実体経済にあたえるマイナス 効果が大きい(図表 2)。
設備投資が増加しているといっても,デフレーターでの調整後の「実質値」であっ て,名目設備投資は1998年並みの水準に過ぎない。これが,雇用が増加せず,所得水 準が減少している理由である。
(5) 小泉内閣が不良債権を増加させた。
主要行の不良債権比率は2000年に5.0%であって,正常な水準であった。しかし,
2001年に入り,小泉デフレ政策によって不良債権が増加し,8.4%まで上昇した。こ れを2005年 3月までに半減しようするのが,2001年10月に発表された金融再生プログ ラムである。つまり,不良債権を増加させたのは,小泉内閣であって,自ら増やした 不良債権を縮小させようとするのが,竹中プランである。この間,株価は2002年 4月 に日経平 で7,600円台まで下落し,実体経済に与えたマイナスのインパクトは極め て大きい(図表 4)。
(6) 金融再生プラン(竹中プラン)は理念も手法も,誤りである。
金融機関には,500兆円超の預金があり,貸し出しは400兆円を割っている。従って,
たとえ 8%程度の不良債権があっても,貸し出し増加を阻害することは,全くない。
しかも,2002年10月時点での不良債権の 7割程度は,2001年 4月以降発生したものが 多く,デフレ型であって,デフレが解消すれば,一挙に健全債権にある。従って,加 速償却する必要は全くない。かえって黒字で税金を払っている健全な企業までも,破 綻に追込む政策である。
また不良債権の認定方法として,DCF(デイスカウント・キャッシュフロー)と減 損会計を駆使して,5年間まで先を見て,収入の流れの増減と減損率を調べて,企業 の債務状況を判定する手法を取っている。
この方法をとれば,デフレのもとでは,どんな企業でも債務過多・債務超過となり,
金融機関取引を停止させられかねない。まさに,金融庁の恐怖政治であり,会計恐慌 である。
戦後の日本の企業は,たとえ不況で赤字でも,新卒者や若い人材を採用して教育し,
景気回復気には有益な人材として活用できるようにしてきた。こうした方針をとって きたから,戦後,短期間に日本が経済力を高め,優れた技術大国に成長したのである。
金融庁行政は,日本企業のよき伝統と文化までも,破壊させている(図表 6)。
(7) デフレは国民の間に浸透している。
家計貯蓄率は急落している(2000年末9.8% >02年6.1%)。これは,高齢化が 主因ではなく,一般国民の可処分所得の減少が主因である。可処分所得は,2000年に は25兆円もあった。しかし03年には統計史上初めて(1990年から可処分所得統計を取 り始めた)マイナス 3兆円にまで落ちこんでいる(図表 8)。また国民年金の未納付 率状況を見ると,2001年から急上昇しており,払えない人の65%は「経済的に払えな い」と明言している。貧富の差が拡大している。
(8) 歪んだ内需抑制策を「内需拡大策」に全面的に転換する。
過去 3年間継続した内需抑制策によって,企業は輸出増加にはけ口を見出さざるを 得ない。当然,円高・ドル安傾向になるので,政府は必死に市場介入して,ドル買 い・円売り操作を実行する。その結果,ドル買いの原資は我々国民の預金であるから,
我々国民の預金がドルに換わって,アメリカの国債を購入し,アメリカの減税資金に 移っている。
本来,われわれ国民の預金は,日本のために使用されるべきであろう。国内は,実 質的に強度の金融引締めであり,健全な企業でも金融庁行政によって,日本の企業は 次々に整理されてゆく。
こうした極度に歪んだ内需抑制策を全面的に改めるべきである。
(9) 惨憺たる日本経済をどう立て直すか。
デフレ下での経済では,緊縮財政をとれば,かえってデフレが進展し,実体経済を 疲弊させる。これ以上の緊縮財政(公共投資の削減と「三位一体」といわれる地方へ の財政支出の削減,義務教育費の削減など)をやめて,財政政策を活用して,景気振 興策をとり,また金融庁の無用な不良債権処理を停止させることである。これ以外に,
国家経済を破綻から救済する方法はないであろう。また,不況下での所得税の増税政 策をやめて,財政政策を活用した景気対策を取る。そうすれば,景気が大幅に上昇し,
名目成長率が 3− 4%に達すれば,税収の自然増収が増え,財政赤字が縮小する。こ うしたときが来てから,税制改革をするのが望ましい政策である(1990年代前半から 後半にかけてのアメリカ)。
政策の柱は,「経済規模を拡大すること」に置くべきである。経済規模を拡大する政策が取 られれば,直面する多くの問題が解決する。
① 投資減税と効率的な公共投資の採用によって,民間投資を誘引する。
とくに「投資減税」政策を製造業に広げ,企業の海外シフトをおさえ,国内での生産増加 と雇用機会の拡大をはかるべきである。
② 「三位一体」は,当面,棚上げする。
③ 金融庁行政を全面的に転換する。これ以上の不良債権の処理は全く必要ない。
不良債権査定方法として,DCFと減損会計の採用を禁止することである。
①②③の政策を一挙に実行することである。そうすれば,国民からデフレ心理を拭い去るこ
とが出来るであろう。稿日:2004年10月7日)
以上
Sept.,
2004Behind the Shadows of Economic Recovery:
Japanʼs Weakening Economic Strength
How should Japan resolve the dismal realities?
Hidehiro Kikuchi
Professor of Economics and Finance Bunkyo Gakuin University, Tokyo, Japan
The recession admittedly looks to have bottomed out for some parts of Japanʼ s economy, thus showing a recovery trend. However, the reality is that this trend is limited only to the export
‑related sector and mainly to the Tokyo metropolitan region, while the local economies are facing dismal conditions with the exception of some export companies and regions that have taken special economic stimulus measures. Japan has indeed fallen into a “
20percent scale economy.”With the recent Cabinet Officeʼ s bulletin announcing high
“real”growth for the GDP
(gross domestic product) ,much of the mass media information is declaring economic recovery. The high deflation rate, however, is the true reason behind the high “real”growth rate, while the “nominal”growth rate continues to hover near zero or in negative figures in an asset deflationary spiral
(down
5percent from theprevious year
). The manufacturing sector is seeing a hollowing out of companies due to the shift to China,with tax revenues for the fiscal year
(FY
2004)at the same level as FY1986(18years earlier)
. A comprehensive look reveals that Japanʼ s economic strength is steadily weakening. Deeply
‑rooted deflation is leading to employment insecurity( with a particularly unstable employment situation and high unemployment rate for the young)
and an increase in violent crimes.
One can say that we have reached a situation that can no longer be left alone.Major Error in Koizumiʼs Economic Policies
From the perspective of economic policy, Prime Minister Junichiro Koizumiʼ
s structural reforms consist of
typical deflationary policies. Despite the fact that Japan is still caughtin a deflationary spiral,the structural reforms seek to
(1)trim the fiscal budget deficit andreduce the public debt through fiscal retrenchment
(cutbacks on investment‑ related spend-
ing and the collection of funds from local economies
)and(2)believe that accelerating thedisposal of non
‑performing loans will increase lending from financial institutions and lead to economic recovery. I believe,however,that the U.S.and Japan in the1930 s demonstrat-
ed that the enforcement of such policies at a time of progressive deflation can actually worsen deflation,increase the non
‑performing loans,and yield results that are opposite of the true goals, and have thus been pointing out the error in these policies since the establishment of the Koizumi government.
A look at the performance for the past threeyears shows, as predicted, a worsening in all economic indicators.
In this article, I will first use objective data to analyze the realities of the Japanese economy and have the reader confront the realities of the dismal economy,and then discuss what should be done to avoid the weakening of the Japanese economy.
Distorted restrictive measures for domestic demand
(1) “Recovery”is merely an uplift from the rock‑bottom 1990s.
The transition over the past three years shows us that stock prices dropped from ¥
15,
000to ¥
7,
600since the establishment of the Koizumi government(current value loss of ¥
150trillion
). Taking advantage of the May
2003injection of public funds(unfair action that takes away shareholder responsibility
)in Resona Bank, stock prices rose through buyingby foreign funds aimed at a strong yen. As a result,the uplift is merely a return to around
¥
11,
000. The index of mining and manufacturing production,moreover,plummeted from April2001 ,tumbling below the formerly lowest levels of the1990 s in November2001 . This plummet is simply being reclaimed, with the cause of the uplift being exports to the U.S.
and China. The recovery in corporate performance,moreover,is attributed to streamlin- ing and massive personnel cuts
(restructuring) ,as well as an increase in capital investment due to overseas demand, with very little investment associated with domestic demand.
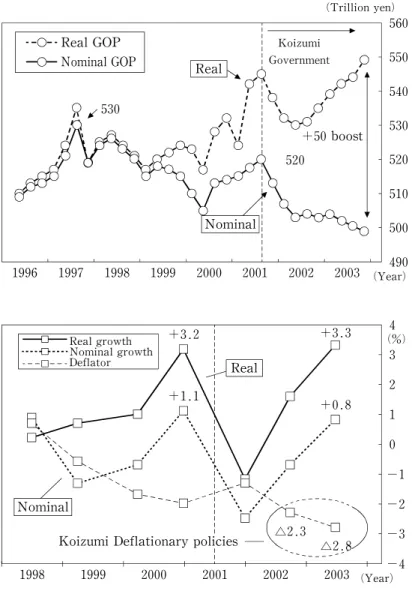
(2) The rise in the “real”growth rate is an illusion;Japanʼs economic scale is shrinking.
As shown in Figure
1,the nominal GDP for
2003was a little less than ¥500trillion,down¥
20trillion from mid‑2001. During this time,however,the GDP deflator
(deflation rate
)has rapidly risen
(2.8percent in2003). This increase in the deflation rate has pushed up the real growth rate, meaning quite simply that real GDP is being calculated as ¥
550trillion. The ¥
50trillion differential is a result of the boost from the deflation rate, andis merely an empty illusion. This is the reason for the plunge in tax revenues. The example for capital investment is shown in Figure
2. Despite the fact that capital invest-
ment rose in
2003, in nominal terms it was only at
1998levels−five years in the past
−while “real”capital investment was actually inflated by ¥
20trillion
(27percent). This
(lack of investment
)is the cause behind the reality that the economic scale is drasticallyshrinking, the lack of nominal GDP growth, and the fall in Japanʼ s employment and salaries.
Net investment(the margin of increased capital investment after depreciation
)has shown negative figures from the April
‑June
2002quarter, while private investment isnot increasing due to deflation.
Figure 1 Transitions in Real GDP and Nominal GDP
( Deflation ‑ induced ¥ 50trillion illusion)
Koizumi Government
(Trillion yen)
(Year)
+50boost 560 550 540 530 530
520 520
510 500 2003 490 2002 2001 2000 1999 1998 1997 1996
Nominal GOP Real GOP
Nominal Real
(Year)
2001 2002
△2.
△2.3
DeflatorReal growth Nominal growth
(%)
4 3 2
0
+0.8 1
+3.2 +3.3
+1.1
−1
−2
−3 2003 −4
2000 1999
1998 Nominal
Real
Koizumi Deflationary policies
(3) The fiscal deficit is expanding while tax revenues are falling to levels below those seen 18years ago.
The effects of the expansionary fiscal policies and financial stability of1998to
1999wereseen in FY
2000,a year that marked tax revenues of ¥
50.7trillion and a primary balancethat shrunk to ¥
13trillion. The retrenchment finance from FY2001
,however,has put a damper on the economy,with tax revenues dwindling to ¥
41.
8trillion(a ¥
8.
9trillion drop)and the primary balance deteriorating to negative ¥
20trillion in FY2003,thus increasing public debt. This fiscal yearʼ s budget has recorded tax revenues totaling ¥
41.
7trillion,
meaning that in merely three years,Japanʼ s economic strength has weakened to the point that it can only maintain tax revenues in line with
1986levels
(18years earlier
).
Furthermore,FY
2004and beyond will see a tax‑raising budget,thereby already beginning the vicious cycle of retrenchment finance
(cutting back on investment
‑related spending,
and cutting back on local tax allocations and subsidies in preference to transferring tax revenue sources
)causing a downturn in the economy,which then causes the budget deficitto expand, which causes further tax hikes. Under these tax‑ raising policies, it will be impossible to achieve the governmentʼ s goal of balancing the primary balance in ten years
(
Figure
3).
(4)
It is the Koizumi government that caused the increase in the non
‑performing loans.
The accelerated disposal of non
‑performing loans by the Financial Services Agency is a
Figure 2 Nominal capital investment amount is around 1998levels
( deflation is “boosting real capital investment by ¥20trillion” )
Source:Produced based on Cabinet Office Statistics 83
95
(Trillion yen)
Ⅳ
Ⅲ
Ⅱ
Ⅰ Ⅰ Ⅱ Ⅲ Ⅳ Ⅰ Ⅱ Ⅲ Ⅳ Ⅰ Ⅱ Ⅲ Ⅳ Ⅰ Ⅱ Ⅲ Ⅳ (Year)
△20
△6
100 95 90
80 85
75 70
1999 2000 2001 2002 2003
Nominal
Real
restrictive monetary policy that does more harm than good, causing an extreme credit crunch and having a devastating impact on financial institutions and sound small
‑and medium
‑sized enterprises
(SMEs
)(Figures
5and6).
As shown in Figure
4,with the successful economy
‑boosting measures in FY
2000,the non
‑
performing loan ratio of major banks fell to
5percent and resulted in a sound economicsituation. However, owing to the deflationary policies begun in
2001, the ratio surged to
8
.
4percent in
2001. On the other hand, because Japanʼ s financial institutions have
500trillion yen in deposits and loans do not exceed ¥
400trillion, there is a surplus of ¥100trillion in funds. Consequently, although the non
‑performing loans are showing a slight increase,they are not inhibiting the lending of the financial institutions. The deflationary pattern of the increased non
‑performing loans and the deflationary policies has simply made it necessary to build up the loan loss reserves. Therefore, present
‑day Japan does not need to write
‑off non
‑performing loans. Rather,such action only leads to the failure of sound companies and financial institutions.
(Figure
4)Figure 3 Trends in the Primary Balance
Source:Produced based on Ministry of Finance
Bubble effect
Koizumi Cabinet
Fiscal reforms by Hashimoto
Cabinet
Financial crisis
−19.6
−18.9
−13.7
−18.3
02 98 96 94
92 90 88
−2.2
2000
−9.2
−2.0
+8.8
+5.0
+2.0
−1.0 1986
( Fiscal Year Surplus ) Deficit
Trillion yen
−20
−15
−10
−5 0
+5
+10
+15
(5) The household budget is running a deficit,the personal savings rate is plummeting, and the rate of nonpayment for national pension premiums due to hard living is skyrocket- ing.
Figures7and
8clearly reveal that the deflationary policies are leading to a notable declinein national wealth.
As shown in Figure
8, over the past five years, households have recorded a drastic drop exceeding ¥
40trillion, eventually running a ¥
3trillion deficit in
2003. This decline is being supplemented by reaching into the savings. The result has been a plunge in the personal savings rate from
9.
8percent in2000to6
.
1percent in2002,with expectations of
Figure 4 Non‑performing loans surging
from 2001 by Koizumi Govern ment (deflationary trend)
-
Change in the Non ‑ Performing Loan Balance and Non ‑ Performing Loan Ratio
Source:2003 White Paper on Economic and Fiscal Policy
Figure 5 ¥40trillion credit crunch
( credit among non‑ financial institutions )
Source:Produced based on Bank of Japan Flow of Funds Accounts
9
(Non‑performing loan ratio) (Non‑performing loan balance)
(Trillion yen)
Koizumi Govemment
Non‑ performing loan balance
(%)
4 5 6 7 8
8.4
5.0
02 01 35
30 25 20 15 10 5
99 2000 1998
Non‑performing loanbalance Credit contraction centered on regional financial institutions
Lifting of the freeze on the payoff system spurs the trend
Retrenchment policy
March2001return to zero interest August2000interest rate increase
194
156 Koizumi government deflationary Government
policy
Credit contraction (40trillion yen)
Negative growth
03 02
01 0 2000
150 160 170 180 190 200 210 220
(Year) (Trillion yen)
a further drop to
5percent in2003. Japanʼ s savings rate may even fall below that of the U.S.Figure
7shows that the nonpayment rate for national pension premiums surged fromaround FY
2001, the start of the Koizumi government. The reason for this rise in nonpayment rate is the fall in the income of the younger generations, due to the deeply
‑rooted deflation, with
65percent of the people who are unable to pay the premium explaining “economic difficulty in paying.”
Figure 6 The Takenaka Plan Bankrupts Companies and Banks
A reduction of [1]in bank capital brings a contraction of12.5times of[1] capital reduction.
Capital adequacy requirement
8% of higher for banks subject to the rules for international banking
Methods 1)DCF method 2)Current value accounting, asset impairment accounting
3)Sudden imposition of stricter standards stricter in
every respect
FSA increases non‑
performing loans by meansof “appropriate”asset assessment
A reduction of[1]in bank capital brings a contraction of25times of[1] capital
reduction
Capital adequacyrequirement
4subject to the rules for% or higher for banksdomestic banking
Money flowsin reverse Loan
contraction
Reduction in bank capital and reduction or elimination of tax‑
effect capital Bank Capital Capital adequacy requirement (Lending limit regulations)
However,not onlydofunds not flowintothereal economy,theyaresiphonedoff bytheTakenakaPlan.
Increased investment in government bonds
Audit Corporations
Methods 1)Assessment of finance receivables using sampling surveys2)Independent forecasting of bank profits for fiveyears 3)Sudden reduction or denial of tax‑ effect capital through murky decisions made behind closed doors
With the partial lifting of the freeze on the deposit payoff system (time deposits only ),half of deposits become liquid
Loan and Credit
Banks,Shinkin Banks,Credit Associations
The Aim of the Takenaka Plan
Use this method to bankrupt banks and nationalize them using public funds.
→ Hand over small businesses and companies with high borrowings to the Resolution and Collection Corporation and bankrupt them one after another .
The Real Economy
・The economy contracts(about10%) ・Extreme credit contraction
・Tax revenues(proposed)of41.7trillion yen for fiscal2004at the same level as fiscal1986(eighteen years earlier )
・Accounting panic
The Bank of Japanʼs Self‑Proclaimed “Monetary Relaxation”
Increase in the target volume of banksʼcurrent account deposits
→
30trillion yen(actual deposits at December2003) 35trillion yen(upper limit increased in January2004)
Financial Services Agency
Increase in loan loss reserves Promotion of corporate
bankruptcies
Figure 7 Skyrocketing Rate of Nonpayment for National Pension Premiums
( Difficulties in making payments due to reduced income )
40
%
35 30 25 20 15
96 98 2000 2001 2002
(FY)37.2
Koizumi Government
Rate of nonpayment for national pension premiums
No trust in the national pension
15
Reasons for not paying the national pension premiums
( Social Insurance Agency Survey ,2002)
Figure 8 Plummeting Household Budget Savings Rate, Deficit in Disposable Income
Source:Bank of Japan
Savings Rate is “Ratio of Savings in Disposal Invoice ( Calendar Year 2003) Koizumi
Government 40
35 30 25 20 15 10
98 99 00 01 02 03
5 0
−10 −5
−5
(Trillion)0 10
5 15 20
(%)Defici △3 Surplu
6.1
( Forecast )
(Year)
Companies
( left‑ hand scale ) Household budget
( left ‑ hand scale )
9.8 Savings rate
( right ‑ handscale)
(6) Distorted restrictive measures for domestic demand are implementing a ¥33 trillion dollar‑buying /yen‑selling market intervention.
As a result of the restrictive measures for domestic demand from both the finance and
Financial Services Agency administration aspects, companies are searching for an outlet
for exports, leading to a natural appreciation of the yen. In response, in the desperate
attempt to prevent a strong yen, the Ministry of Finance
(MOF
)has intervened in the
market
(buying dollars, selling yen
)to the tune of over ¥
33trillion since April
2003toMarch
2004(FY
2003)in order to maintain a weak yen. The Japanese peopleʼs deposits
are the source of this market intervention, meaning that funds that should be spent in
expanding domestic demand are being used as the source of U.S. tax cuts,in the form of
purchasing U.S. government bonds. Foreign funds, moreover, are able to buy Japanese
stock and assets through the weak yen. This is the result of distorted restrictive measures
for domestic demand, whereas Japanʼ s surplus funds should be used to expand Japanʼ s
domestic demand.
Japanʼ s Escape from Deflationary Spiral in the 1930 s
Wartime economy
Anti‑deflationary policies of Finance Minister Korekiyo Takahasi (Increased fiscal outlays,leading to growth in nominal GNP,with resultant slowdown in pace of growth in government debt) Financial uncertainty
(1927banking crisis)
Wholesale prices
Fiscal expenditures
Government debt balance
26 27 28 29 30 31 32 33 34 35 36 37 38
−15
−10
−20 1925
−5 0 5 10 15 20 25
%
30
Learning from History:
Lessons of U.S. and Japan in the 1930s Figure 9
History Lessons in Battling Deflation
Year
‑on
‑year change in government debt balance
,fiscal spending,wholesale prices,andnominal GNP
Note:Fiscal expenditures include estimates .
U. S.Escape from Deflationary Spiral in the 1930 s
Based on Fuji Research institute documents.
Deflationary policies of Hoover administration
(Fiscal retrenchment in a deep recessional phase ,leading to growth in government debt balance)
Anti‑deflationary policies of Roosevelt administration (Increased fiscal outlays,leading to growth in commodity prices and nominal GNP,with slowdown in pace of growth in government debt )
Failures of fiscal retrenchment policy
Wartime economy
Wholesale prices
Fiscal expenditures
Government debt balance
30 31 32 33 34 35 36 37 38 39 40 41
−20
−15
−25 1929
−10
−5 0 5 10 15 20
%
25
Fiscal retrenchment and deflationary policies (Showa Depression)
(Reduced fiscal outlays,leadint to fall in nominal GNP with resultant increase in government debt balance)
Nominal GNP (National Income) Nominal GNP
(National Income)
Figures
9and10track efforts by the U.S.and Japan to avert or break out of deflationaryspirals in the
1930s. The lessons of U.S.and Japanese history in this era can be summar-
ized as follows:
(ⅰ)
If you adopt fiscal retrenchment policies during a deflationary recessional phase, commodity prices will fall even further,national income will plummet,and the deflationary spiral will worsen.
(ⅱ)
Policies designed to stimulate demand through sustained fiscal spending will buoy commodity prices,increase nominal national income,and boost the real growth rate. This in turn will stabilize the initially expanded public debt and lower the real burden
(debt to nominal national income
). These are the same processes at work now.
During the Great Depression that was brought on by the stock crash of1929
, the U.S.
Government debt ratio leveled off as nominal GNP increased.
JAPAN
0 0.3 0.5 0.7 0.9
1925 26 27 28 29 30 31 32 33 34 35 36
Anti‑deflationary policyGovernment debt ratio gradually fell as nominal GNP increased.
Deflationar policy U.S.
0 0.3 0.5 0.7 0.9
1929 30 31 32 33 34 35 36 37 38 39 40 Trends in Government Debt Ratios for Japan and U. S.in the 1930 s
Government debt ratio=government debt/nominal GNP
Figure 10 Discipline of Fiscal Policy
Increased Fiscal Spending Will Reduce Debt Burden!
Showa Depression
government did not intervene to bail out failed banks. This created an abrupt and widespread credit crunch with tumbling commodity prices and worsening economic condi-
tions. At the time, then‑ President Hoover implemented policies designed to balance the budget and rein in fiscal spending
(reducing spending in line with drop in tax revenues
).
This plunged the U.S. economy into depression, slashed national income in half, under- mined tax revenue, and caused the public debt burden to balloon.
After taking office in March
1933, President Roosevelt restored stability to the financial system with a set of policy initiatives centering around the injection of public funds and expanded the issuance of government bonds. Massive public
‑works projects were enlisted to stimulate demand, thus spurring private sector demand in turn, buoying commodity prices, and boosting nominal national income. As a result, tax revenue expanded,allow-
ing for a steady decrease in the public debt burden. Although the level of fiscal spending increased temporarily, nominal national income also expanded, clearing the way for a gradual decline in the public debt ratio
(public debt divided by nominal GDP)( Figure10) .
The Japanese economy,for its part,entered a deflationary phase in the second half of the
1920s. That trend was further aggravated by a banking crisis in
1927. It was under such conditions in January1930that the Japanese government returned to the gold standard and implemented policies of fiscal retrenchment. Commodity prices accordingly collapsed,
exports,national income,and tax revenue declined in concert. As a result,the public debt widened, leaving fiscal retrenchment a failure.
On taking office as the new Minister of Finance in January1932 ,Korekiyo Takahashi set about the task of instituting a more aggressive fiscal policy. This led to stimulated private
‑sector demand under the expanded fiscal expenditures when the Bank of Japan
(
BOJ)assumed government bonds,heightened private sector demand,stronger commodity prices,and a significant increase in nominal national income. These steps at last brought the public debt ratio under control. Increasing fiscal expenditure served to decrease the public debt.
Japan has fallen into a vicious spiral. Japanʼ s retrenchment finance
(cutting back on investment
‑related spending for four years running, and cutting back on local tax alloca-
tions and subsidies
)is causing an expansion in the fiscal deficit and a rise in public debt.There furthermore are no incentives spurring investment, despite the lack of investment.
Japanʼ s economic scale is shrinking, with the Financial Services Agency administration accelerating the credit crunch. No economic revitalization can be expected under the current fiscal policies. Rather,the fiscal deficit is ballooning,while Japan is on a danger-
ous course of tax hikes.
Shift to Policies Designed to Stimulate Domestic Demand
(1)
Japan needs to comprehensively re
‑evaluate the“fiscal policy focusing on cut
‑backs to subsidies and local tax allocations”
(fiscal retrenchment policy for local economies
=“decentralization reform”
)and the “cut‑back of public investments.”
(ⅰ)
The content of the “decentralization reform”should be changed, so that local tax allocations and subsidies are trimmed only after national taxes are first transferred to the local economies
(with a one
‑to
‑one ratio of the national tax transfer amount to the cut
‑back amount) . The local tax allocations and subsidies for FY
2005should be equivalentto those for FY
2004. Japan should re
‑examine this policy based on the currently aired
“Ministry of Public Management, Taro Asoʼ s private plan.”
(ⅱ)
Fiscal investments and loans should be widely used, with public investments maintained at least at the same level as the previous year. The focus of such investment will be on carving out and spurring private
‑sector investment for new sectors, such as developing and fostering the human resources for new energy resources, nanotechnology,
nursing care equipment, and biotechnology. There is a grave error in the belief that
“public investments do not contribute to GDP growth”
(Figure
11). An ongoing lack of
spending impairs the effects and increases the debt. Figure
11shows public investmentsurely increases GDP and decreases national debt.
(ⅲ) “Reduced taxes on investment”and “accelerated depreciation”
should be adopted to increase private
‑sector investment. In this connection,
15percent of the investment amount should be exempt from corporation taxes or income taxes. Mie Prefectureʼ s Crystal Valley Project is an example of success in “reduced taxes on investment,”a concept which should be expanded to the national level.
(2)
The Financial Services Agency administration should be completely changed.
There is no further need to write
‑off non‑ performing loans. Japan should stop injecting
Tax revenues
General account net spending Increase or decrease from the previous fiscal year
Source:Produced from Ministry of Finance statistics
¥4.5trillion decrease in deficit‑ covering government bonds
Aggressive Stringent Stringent
41.8 41.7 50.7
53.9
Koizumi government
Correction
Public investments have been cut back3.5 to3.7percent over the previous year for four consecutive years After
correction
Financial crisis
(Trillion yen)
(Year)
2003 2004 2002
2001 2000
1999 1998
1997 1996
50
45
40 55 60
(Year)
2003 2004 2002
2001 2000
1999 1998
1997 1996
(%)
−8
−4 0 4 8 12
Figure 11 Increase in Fiscal Expenditure is surely increasing GDP
unproductive public funds into sound companies.
(3) There is enough strength for fiscal spending.
Japan has ¥
1,
400trillion in personal savings, the government has ¥
90trillion in foreignreserves,and externally it is the worldʼ s largest creditor nation
(¥240trillion
). As of the end of December
2003,the government faced a total debt of ¥
670trillion(MOF
),but also had approximately¥
460trillion in financial assets,making its “net debt”(
total debt minus financial assets
)¥210trillion,a figure equivalent to a little over40percent of the GDP. Alook at the central government alone shows that debt amount to approximately ¥
580trillion and financial assets total approximately ¥
460trillion, for a “net debt”of ¥
120trillion. Local governments have ¥
90trillion in debt, but practically no financial assets,and consequently face a heavy financial burden. Financial institutions have funds exceed- ing ¥
100trillion, and thus there is enough strength to absorb newly issued government bonds.
(4) “Privatization”should be reconsidered.
Discussions on issues such as postal savings and the public highway corporations are being advanced under the premise that “all privatization is good.”This, however, is extremely dangerous. Japan needs to start the discussions over again,this time on the pros and cons of privatization. Particularly problematic is the fact that the funds accumulated through Japanʼ s postal savings are used to develop social infrastructure,a fact that has allowed us to advance this far over a short period of time. If the postal savings are privatized,how will Japan procure the funds needed for enhancing the social infrastructure?Privatization involves the question of whether the utmost importance is placed on the profit to the capital and whether the privatization meets the public interests
(national interests
).
(5)