Kinki University English Journal No. 7 February 2011
Students' Course Evaluations and Their Analyses of Students'
Roles in Faculty Development (2):
Perceptions toward Required English Classes
Setsuko Mori Yoshitaka Tanabe
Abstract As a part of faculty development, most universities now administer student course and teacher evaluation questionnaires in one form or another. Kinki University also started to conduct a campus-wide survey in a unified format in 2008. However, the questionnaire results are usually returned to instructors for individual inspection, and are not yet analyzed systematically. Thus, this paper statistically analyzed part of the survey results that are related to English classes in order to better understand the students' opinions regarding the courses and teachers, and to improve our English programs. Specifically, this study attempted to investigate: (1) how first and second year students evaluate their required English classes and their teachers; (2) how their class and teacher evaluations differ depending on types of classes; (3) how their class and teacher evaluations differ depending on student's proficiency; and (4) what factors contribute to the overall rating of the class and teacher.
Keywords: students' course evaluation, students' perceptions, faculty development
授 業評 価 ア ンケー ト調 査 か ら読 み取 れ る学 生 の意識 と授 業 の課題(2)
一 近 畿 大 学 法 学 部 英 語 科 目群 の 分 析 を通 して 一
森 節 子
田 邉 義 隆
要 旨 大 学 改 革 の 推 進 と と も に学 生 に よ る授 業 評 価 ア ンケ ー ト調 査 も定 着 して きた が 、 単 純 に 集 計 した 結 果 を 個 々の 教 員 に返 却 す るだ け に留 め て い て は、 授 業 評 価 が 有 効 的 に活 用 され て い る とは 言 い 難 い 。 体 系 的 ・統 計 的 にそ の 結 果 を 分 析 し、 科 学 的 根 拠 に も とつ いた デ ー タを も と に組 織 レベ ル で 問 題 点 や 課 題 の 発 見 に努 め 、 状 況 改 善 の た め の 方 策 を 検 討 す る必 要 が あ るだ ろ う。 本 稿 で は 、 近 畿 大 学 法 学 部 で 実 施 した 授 業 評 価 結 果 を 英 語 科 目 に焦 点 を 当 て 、 以 下 の 観 点 か ら統 計 的 に分 析 す る こ と に よ り、 法 学 部 英 語 プ ロ グ ラム の 現 状 把 握 を 試 み 、 授 業 改 善 の た め の 諸 課 題 を 検 討 した 。(1)1回 生 と2回 生 は 英 語 基 幹 科 目の 授 業 とそ の 担 当 者 を どの よ うに 評 価 して い るの か 。(2)科目の 違 い に よ って 授 業 評 価 の 結 果 に どの よ うな 差 異 が あ るの か 。(3)習熟 度 の 違 い に よ って
授 業 評 価 の 結 果 に どの よ うな 差 異 が 生 じ るの か 。(4)総合 評 価 に影 響 を 及 ぼ す 要 因 は何 か 。
キ ー ワ ー ド 授 業 評 価 ア ン ケ ー ト、 学 生 の 意 識 、FD
Students' Course Evaluations and Their Roles in Faculty Development (2):
Analyses of Students' Perceptions toward Required English Classes (Mori & Tanabe)
Introduction
A growing need for university reform in Japan has been strongly advocated in response to such social issues as a downward trend in birthrate and an overall deterioration of student academic abilities. As part of this reform, the Ministry of Education, Culture, Sports, Science and Technology (henceforth MEXT) has been encouraging universities to develop some kind of system where students themselves are able to evaluate their courses. The ministry reported that, during the 2008 academic year, 597 universities nationwide conducted the student evaluations in a questionnaire style (MEXT, 2009).
The above number accounts for approximately 80 percent of all universities in Japan.
At Kinki University, the evaluation system began in 2001 with many faculties conducting trial versions and was standardized across faculties in 2008.
Student evaluations, as described above, have been administered in recent years, but the effectiveness of such evaluations remains highly debatable. While investing much time and effort into conducting these evaluations, however, it appears that the results of the students' ratings are simply tabulated and are not carefully examined for the purpose of lesson improvement (Matsumoto & Tsukamoto, 2003). At Kinki University, each instructor receives his or her results individually and there tends to be no further analyses taken in relation to these results. However, in order to use the results from these student evaluations more effectively, it is not sufficient to only provide data to an individual instructor. As Matsuo and Kondo (2005) indicate, simple mean scores of students' ratings will not clearly explain where problems in the classroom arise from;
in other words, whether they derive from faults of teachers or student negligence. In order to more clearly target the problems and highlight the achievements of university classrooms, data obtained from these evaluations should be examined through a systematic basis. From this examination, shared objectives should be set to realize more appropriate instructions, which in the long run will promote educational quality for the students.
Without adequately understanding the use of the student evaluations system, the attempt may soon become a mere facade even if authorities actively promote the implementation of it.
Some research has been conducted from various viewpoints on student evaluations in tandem with its introduction in the university education system, and many of these studies investigate the reliability and validity of these questionnaires. These aspects should obviously be confirmed, and thus it seems only natural that they are tested to increase accuracy and ascertain their effectiveness. Some previous studies, however, seemingly
imply other intentions. Student evaluations have rapidly been introduced into the fields of university education since MEXT (1998) pressed forward with their structural reforms, but there is an undeniable sense that it was rather enforced by the educational administration and was implemented at universities in a relatively passive manner. It can be easily assumed that many, if not most, teachers have had a sense of distrust and rejection towards student evaluations (Inoue, 1993; Sumida, 1996; Yasuoka, Minesaki, Yoshikawa, Yamamoto, Takano, Mitsusawa & Katori, 1994; Jin, 1998). Yonesaki (1992, p.43) is concerned that, while suggesting the need for student evaluations in Japanese University English Departments, certain objections may stem from the Japanese cultural background. "Japanese hierarchical relationships could not stand the stress of evaluations. The problem may lie more with the instructors than with the students." In addition, Sumida (1996) did a survey of how teachers in his faculty perceived student evaluations, and reported that there are lingering concerns and strong oppositions on the teachers' side. In some respects, those studies seem to have been conducted to overcome their deep-seated doubts in the reliability and validity of student evaluations.
The reliability and validity of the student evaluations have been researched from various perspectives and through different methods. Minami (2003) compared the results of student evaluation questionnaires conducted in two consecutive years with two separate groups of students who were taught in an identical manner, and found a significant correlation between the groups. He, thus, concludes the results were stable and the reliability of the student evaluations was high. Another issue that is dealt with in relations with survey reliability and validity is students' attendance rates. It is commonly questioned how students with low attendance rates could possibly make a fair judgment about the teacher and the class. To answer this question, Makino (2005) examined the correlation between student evaluations and attendance rates. He questioned if the students who are frequently absent from class underrate the class. His results showed that they tend to give statistically lower ratings than the students with high attendance rates in the following factors: teacher, instruction, satisfaction, and overall rating of the class. He notes, however, these students only constituted 10 percent of all the subjects in this survey, so they exerted minimal influence on the overall results. Yamada and Yamamoto (2007) took a different approach to this question, but they also insist that attendance rate cannot be seen as a factor that creates a strong impact on student evaluations.
The question of what factors actually affect the overall student rating of a class and teacher is another interest among many researchers (Yasuoka, 2000; Makino, 2001;
Students' Course Evaluations and Their Roles in Faculty Development (2):
Analyses of Students' Perceptions toward Required English Classes (Mori & Tanabe)
Kiryu, 2008). After examining the evaluation results in his university, Yasuoka (2000) discovered the scores of native English speaking teachers' instruction were exceptionally high. He analyzed the scores through multiple regressions to evaluate the influence that various factors, such as student English ability, had on overall student evaluation results. With regard to the most influential items on the evaluation form, the item
"Did th
e instruction stimulate your interest?" was the highest followed by the item
"Did th
e instructor emphasize main points?" As for the relationship between total evaluation scores and the university English achievement test that students took at the beginning of their freshman year, contrary to his (and probably many teachers') assumption that the stronger students give higher ratings, no clear relationship was found between evaluation scores and English achievement. In fact, the results showed high English ability level classes gave lower evaluation scores. He hypothesized that these results may have been obtained because the same textbook was used in almost all the freshman conversation classes and the contents may not have been stimulating enough for high ability students.
Taking into consideration the findings of previous studies above, this study attempted to investigate the following research questions:
Research Questions
1. How do first and second year students evaluate their required English classes and their teachers?
2. How do their class and teacher evaluations differ depending on types of classes?
3. How do their class and teacher evaluations differ depending on student's proficiency?
4. What factors contribute to the overall rating of the class and teacher?
Methods
Participants
The participants in this study were first and second year law students who were taking five different required English classes involving 41 different instructors. In this faculty, first year students take two English classes: English 1 with a focus on reading and listening, taught mainly by Japanese instructors; Communicative English 1 with a focus on speaking and listening, taught by native English speaking instructors.
Second year students take three English classes: English 2 which is a continuation of English 2; Basic Writing taught both by Japanese and native English speaking instructors;
and Communicative English 2 which is a continuation of English 1. First year students
were placed in their classes based on their performance on the placement test administered at the beginning of the first semester while second year students were placed in their classes based on their scores on the TOEIC administered at the end of the first year.
Their proficiency varies greatly from a low score of 130 to a high score of 920 on the TOEIC. Although there were a total of over 1,500 first and second year students enrolled in the faculty, approximately 1,100 students ended up answering the questionnaire as the rest of the students were absent on the day when it was administered.
Class Evaluation Questionnaire
The questionnaire was created by the committee in charge of faculty development, and administered in the end of every semester to all students enrolled in this faculty (See the appendix for a translation of the questionnaire). It consists of 15 items which can be divided into three groups: items concerning students' evaluation of the class and teacher, items concerning students themselves, and an item concerning classroom facility. Except for the item asking about students' overall evaluation of the class on 10 point Likert scale, all the items were on five point Likert scale with one being strongly disagree and five being strongly agree.
Procedure
For the purpose of faculty development, the class evaluation questionnaire was administered in the end of the first semester in five different required English classes, English 1, Communicative English 1, English 2 , Basic Writing and Communicative English 2. The questionnaire was completed within approximately 15 minutes. Although strict anonymity is recommended for this type of research, it was the faculty policy to have the students provide their students' numbers. The questionnaire was collected and brought in the office by student representatives. The data were sent to and processed by an external data processing company.
Results
Reliability and Validity of the Questionnaire
After eliminating missing data, 2, 758 sets of responses were analyzed and the Cronbach's alpha for the questionnaire was .91, which indicates that this questionnaire was highly reliable.
In addition, principal components analysis was performed in order to check the content
Students' Course Evaluations and Their Roles in Faculty Development (2):
Analyses of Students' Perceptions toward Required English Classes (Mori & Tanabe)
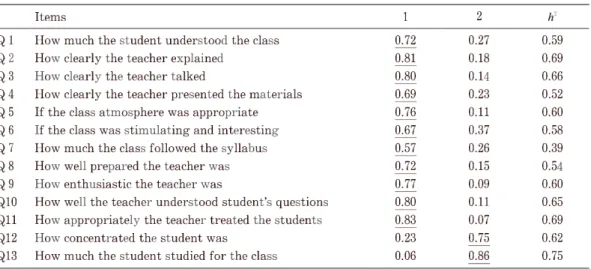
validity of the questionnaire. Four criteria were used to determine the number of factors to rotate: a minimum eigenvalues of 1.0, the scree test, a minimum loading of .45, and the interpretability of the factor solution. Based on these criteria, two factors were rotated using a Varimax rotation procedure in an initial run. The result suggested that item 15 (how appropriate the classroom facility and environment was) did not load on any factor. Therefore, after eliminating item 15, principal components analysis was performed again with Varimax rotation. The result found two interpretable factors, which accounted for 51.20% and 9.29% of variance, respectively (See Tables 1 and 2).
Table 1. Principal components analysis summary: Eigenvalues and percent of variance explained
Component Total
Initial Eigenvalues
% of Variance Cumulative % 1
2
6.66 1.21
51.20 9.29
51.20 60.48
Table 2. Principal components analysis results
Items 1 2 h2
Q1 Q2 Q3 Q4 Q5 Q6 Q7 Q8 Q9 Q10 Q11 Q12 Q13
How much the student understood the class How clearly the teacher explained
How clearly the teacher talked
How clearly the teacher presented the materials If the class atmosphere was appropriate If the class was stimulating and interesting How much the class followed the syllabus How well prepared the teacher was How enthusiastic the teacher was
How well the teacher understood student's questions How appropriately the teacher treated the students How concentrated the student was
How much the student studied for the class
0.72 0.81 0.80 0.69 0.76 0.67 0.57 0.72 0.77 0.80 0.83 0.23 0.06
0.27 0.18 0.14 0.23 0.11 0.37 0.26 0.15 0.09 0.11 0.07 0.75 0.86
0.59 0.69 0.66 0.52 0.60 0.58 0.39 0.54 0.60 0.65 0.69 0.62 0.75
As table 2 shows, all the items that were supposed to be concerned with students' evaluation of the class and teacher loaded together on factor one whereas the two items that were asking about students' own attitudes loaded together on factor two. In other words, this result suggested that the questionnaire items measured what they intended to measure. Furthermore, the fact that item 1 (how much the student understood the class) loaded with all the other items regarding students' evaluation of the class and teacher suggests that students understood this question as how hard the teacher tried
to make themselves understood instead of how much the student understood the class.
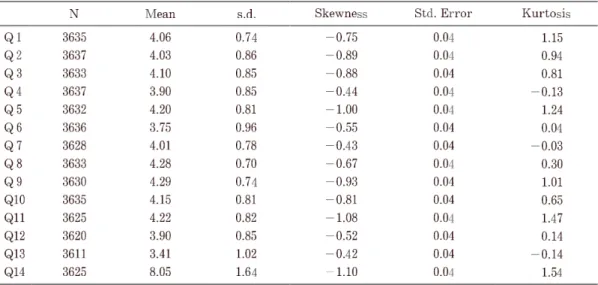
Research Question One: How the Students Evaluate their Required English Classes and their Teachers As can be seen in table 3, the mean rating on the overall evaluation of the class and teacher was eight on a 10 point Likert scale, and mean ratings of nine out of 13 items were over four on a five point Likert scale, which may show students' generally favorable evaluation of English classes and teachers. Among the items that received high mean ratings were item 9 (how enthusiastic the teacher was), item 8 (how well prepared the teacher was), item 11 (how appropriately the teacher treated the students) and item 5 (how appropriate the class atmosphere was). On the other hand, items 12 and 13 concerning students' themselves (how concentrated they were, and how much they studied for the class) received lowest ratings together with item 3 regarding how stimulating and interesting the class was. This finding possibly indicates that although the students highly rated teachers' enthusiasm and the way they handled their class, they did not perceive the class stimulating or interesting, and admitted that they themselves did not work very hard.
Table 3. Questionnaire item mean ratings and standard deviations
N Mean s.d. Skewness Std. Error Kurtosis
Q1 Q2 Q3 Q4 Q5 Q6 Q7 Q8 Q9 Q10 Q11 Q12 Q13 Q14
3635 3637 3633 3637 3632 3636 3628 3633 3630 3635 3625 3620 3611 3625
4.06 4.03 4.10 3.90 4.20 3.75 4.01 4.28 4.29 4.15 4.22 3.90 3.41 8.05
0.74 0.86 0.85 0.85 0.81 0.96 0.78 0.70 0.74 0.81 0.82 0.85 1.02 1.64
-0 .75 -0 .89 -0 .88 -0 .44 -1 .00 -0 .55 -0 .43 -0 .67 -0 .93 -0 .81 -1 .08 -0 .52 -0 .42 -1 .10
0.04 0.04 0.04 0.04 0.04 0.04 0.04 0.04 0.04 0.04 0.04 0.04 0.04 0.04
1.15 0.94 0.81 -0 .13 1.24 0.04 -0 .03 0.30 1.01 0.65 1.47 0.14 -0 .14 1.54
Research Question Two: How Students' Class and Teacher Evaluations Differ Depending on Types of Classes
In order to examine whether the questionnaire ratings differ significantly according to the types of classes, English 1, Communicative English 1, English 2, Basic Writing,
Students' Course Evaluations and Their Roles in Faculty Development (2):
Analyses of Students' Perceptions toward Required English Classes (Mori & Tanabe)
and Communicative English 2, a multivariate analysis of variance (MANOVA) was performed on 14 dependent variables (questionnaire items) and one independent variable (class type).
Significant differences were found among the five different types of class on the dependent variables, Wilks's A = .79, F(2, 2739) = 11.08, p < .00. Table 4 contains the means and the standard deviations on the dependent variables for the five types of classes. Post hoc analyses of the univariate ANOVA on each dependent variable was conducted as follow -up tests to the MANOVA. Using the Scheffe method, each ANOVA was tested at the .003 level (0.05 divided by 14). The ANOVAs on all items except item 7 were significant.
Table 4. Questionnaire item mean ratings and standard deviations by class type
Class Type Mean s.d. N
Q1
Q2
Q3
Q4
Q5
Q6
Q7
Eng 1 CE1 Eng 2 Writing CE2 Eng 1 CE1 Eng 2 Writing CE2 Eng 1 CE1 Eng 2 Writing CE2 Eng 1 CE1 Eng 2 Writing CE2 Eng 1 CE1 Eng 2 Writing CE2 Eng 1 CE1 Eng 2 Writing CE2 Eng 1
4.18 3.94 4.14 4.01 4.12 4.25 3.77 4.19 3.98 4.01 4.29 3.85 4.26 4.06 4.07 4.02 3.70 4.03 3.89 3.87 4.36 4.14 4.15 4.12 4.27 3.85 3.79 3.63 3.72 3.81 3.96
0.69 0.75 0.69 0.77 0.67 0.73 0.89 0.78 0.95 0.82 0.77 0.88 0.75 0.92 0.82 0.84 0.84 0.82 0.88 0.86 0.65 0.79 0.81 0.91 0.80 0.91 0.87 1.02 1.00 0.92 0.82
608 574 561 512 503 608 574 561 512 503 608 574 561 512 503 608 574 561 512 503 608 574 561 512 503 608 574 561 512 503 608
Q8
Q9
Q10
Q11
Q12
Q13
Q14
CE1 Eng 2 Writing CE2 Eng 1 CE1 Eng 2 Writing CE2 Eng 1 CE1 Eng 2 Writing CE2 Eng 1 CE1 Eng 2 Writing CE2 Eng 1 CE1 Eng 2 Writing CE2 Eng 1 CE1 Eng 2 Writing CE2 Eng 1 CE1 Eng 2 Writing CE2 Eng 1 CE1 Eng 2 Writing CE2
3.98 4.02 3.98 4.10 4.40 4.22 4.35 4.20 4.29 4.37 4.25 4.33 4.22 4.34 4.32 3.95 4.27 4.14 4.12 4.38 4.06 4.29 4.16 4.28 3.95 3.98 4.01 3.82 3.88 3.37 3.36 3.42 3.65 3.24 8.43 7.77 8.06 7.97 8.21
0.73 0.76 0.81 0.74 0.66 0.66 0.67 0.75 0.69 0.68 0.71 0.70 0.83 0.71 0.71 0.85 0.75 0.86 0.79 0.70 0.87 0.75 0.89 0.79 0.82 0.80 0.82 0.87 0.84 0.96 0.94 1.06 1.01 1.08 1.46 1.58 1.61 1.80 1.49
574 561 512 503 608 574 561 512 503 608 574 561 512 503 608 574 561 512 503 608 574 561 512 503 608 574 561 512 503 608 574 561 512 503 608 574 561 512 503
As with the overall rating, most of the ratings on English 1 were the highest followed by English 2 and Communicative English 2. One major difference between English 2 and Communicative English seems to be that the former received high ratings on items regarding how clear the class and teacher was whereas the latter received high ratings on items regarding how interesting class was. In terms of how hard the student studied for the class, Basic Writing class received the highest rating.
Students' Course Evaluations and Their Roles in Faculty Development (2):
Analyses of Students' Perceptions toward Required English Classes (Mori & Tanabe)
Research Question Three: How Students' Class and Teacher Evaluations Differ Depending on Proficiency
In order to examine whether the questionnaire ratings differ significantly according to proficiency levels, low, mid and high, a multivariate analysis of variance (MANOVA) was performed on 14 dependent variables (questionnaire items) and one independent variable (proficiency levels).
Significant differences were found among the three different proficiency levels on the dependent variables, Wilks's A = .98, F(28, 7044) = 2.69, p< .00. Table 5 contains the means and the standard deviations on the dependent variables for the three proficiency levels. Post hoc analyses of the univariate ANOVA on each dependent variable were conducted as follow -up tests to the MANOVA. Using the Scheffe method, each ANOVA was tested at the .003 level (0.05 divided by 14). The ANOVAs on items 1, 3, 4, 5, 6, 9, and 10 were significant.
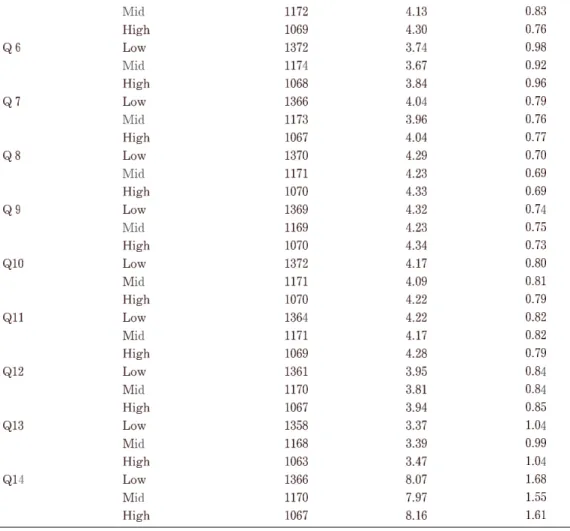
A close examination of those items found to be significantly different depending on proficiency levels suggests that the difference consistently lies between mid level and high level groups. Specifically speaking, mid level group scored significantly lower than high level group on how much they understood the class (item 1), how clearly the teacher talked (item 3), how clearly the teacher presented the materials (item 4), if the class atmosphere was appropriate (item 5), if the class was stimulating and interesting (item 6), how enthusiastic the teacher was (item 9), and how well the teacher understood students' questions (item 10). It is interesting to note that there was no significant difference between low and mid level groups, or low and high level groups on any items.
Table 5. Questionnaire item mean ratings and standard deviations by proficiency
Proficiency N Mean Std. Deviation
Q1
Q2
Q3
Q4
Q5
Low Mid High Low Mid High Low Mid High Low Mid High Low
1371 1173 1069 1371 1173 1071 1371 1172 1069 1371 1174 1070 1369
4.06 4.02 4.13 4.05 3.97 4.08 4.09 4.05 4.18 3.94 3.83 3.95 4.19
0.79 0.68 0.72 0.89 0.83 0.84 0.87 0.82 0.83 0.85 0.85 0.84 0.80
Q6
Q7
Q8
Q9
Q10
Q11
Q12
Q13
Q14
Mid High Low Mid High Low Mid High Low Mid High Low Mid High Low Mid High Low Mid High Low Mid High Low Mid High Low Mid High
1172 1069 1372 1174 1068 1366 1173 1067 1370 1171 1070 1369 1169 1070 1372 1171 1070 1364 1171 1069 1361 1170 1067 1358 1168 1063 1366 1170 1067
4.13 4.30 3.74 3.67 3.84 4.04 3.96 4.04 4.29 4.23 4.33 4.32 4.23 4.34 4.17 4.09 4.22 4.22 4.17 4.28 3.95 3.81 3.94 3.37 3.39 3.47 8.07 7.97 8.16
0.83 0.76 0.98 0.92 0.96 0.79 0.76 0.77 0.70 0.69 0.69 0.74 0.75 0.73 0.80 0.81 0.79 0.82 0.82 0.79 0.84 0.84 0.85 1.04 0.99 1.04 1.68 1.55 1.61
Research Question Four: What Factors Contribute to the Overall Rating of the Class and Teacher In order to determine which individual items contributed to the overall evaluation of the class and teacher, a multiple regression analysis was performed between the overall rating (item 14) as a dependent variable, and 13 individual questionnaire items.
The scatterplot of residuals against predicted DV scores was produced through SPSS. The result revealed that normality, linearity, and homoscedasticity were not a threat to the data set in this study. With 2724 responses and 13 IVs, the number of cases was above the minimum requirement of 116 (104+ 12) for testing individual predictors in multiple regression (Tabachnick & Fidell, 1996).
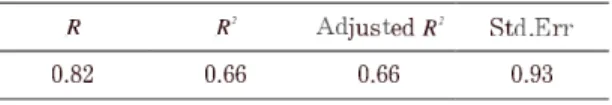
Table 6 shows the summary of multiple correlation analysis. These results indicate that the multiple correlation of the overall rating with the weighted aggregate of the 13 predictors is .82 and the square of this value is .66.
Students' Course Evaluations and Their Roles in Faculty Development (2):
Analyses of Students' Perceptions toward Required English Classes (Mori & Tanabe) Table 6. Summary of multiple correlation analysis
R Rz Adjusted R2 Std.Err
0.82 0.66 0.66 0.93
Table 7 reports the unstandardized regression coefficients (B), the standard error of the unstandardized regression coefficients (Std. Error), the standardized regression coefficients (Beta), t-test evaluating the significance of the difference of the B coefficients from 0 (t) , and the p level (Sig). Notice that the regression coefficients for all individual items except items 7, 8, 12 and 13 are significant. The result suggests that students' perception of how appropriately the teacher treated students can predict their overall evaluation of the class and teacher the most, followed by how clearly the teacher explained and if the class was stimulating and interesting was. It is interesting to note that there was no significant correlation between the amount of effort the students put into the class and their overall impression of the class.
Table 7. Stepwise regression of individual questionnaire items on the overall rating
Unstandardized Coefficients Standardized Coefficients
B Std. Error Beta t correlation
(Constant) Q1 Q2 Q3 Q4 Q5 Q6 Q7 Q8 Q9 Q10 Q11 Q12 Q13
-0 .17 0.20 0.40 0.17 0.05 0.16 0.25 0.02 -0 .03
0.13 0.19 0.43 0.03 0.02
0.13 0.03 0.03 0.03 0.03 0.03 0.02 0.03 0.03 0.03 0.03 0.03 0.02 0.02
0.09 0.21 0.09 0.03 0.08 0.15 0.01 -0 .01 0.06 0.10 0.21 0.02 0.01
-1 .32 5.88 11.64 5.37 1.94 5.74 10.64 0.89 -0 .78 4.04 6.22 13.10 1.46 1.02
0.10**
0.19**
0.09**
0.03*
0.10**
0.18**
0.02 -0 .01 0.07**
0.10**
0.22**
0.03 0.02 p* < .05, p** < .01.
Discussion and Conclusion
Reliability and Validity
Considering the fact that the students are required to answer the questionnaire in every class during a two-week period, it is assumed that some teachers wonder how reliable students' opinions expressed in the questionnaire are, and may view the questionnaire
as a matter of formality. Certainly, since students are required to complete the same questionnaire forms repeatedly during a short period of time, they may gradually lose concentration, possibly resulting in invalid answers or an unserious attitude towards the evaluation. Yamada & Yamamoto (2007) claimed that more than 10 percent of the data collected in their study had some parts blank, and draw attention to this point.
However, the statistics in this study show that the questionnaire is highly reliable.
The Cronbach's alpha of .91 means that if the same survey is administered again, there is 91 percent chance that the same results will be found.
Additionally, the content validity of the survey was checked using a statistical procedure called principal components analysis. The results indicated that all of the items concerning students' evaluation of the class and teacher clustered together as one factor whereas the two items inquiring about students' own attitudes lumped together as a separate factor. It is interesting to note that the item indicative of the degree of understanding seems to be regarded as a question about the class and teacher (i.e., how understandable the class/teacher was) rather than students themselves (i.e., how much they understood the class). Nevertheless, all in all the questionnaire seems to measure what it intended to measure.
Therefore, the result has turned out to support the findings of previous studies, such as Minami (2003) that proved the reliability and validity of students' evaluation.
It could be said that the debate concerning the reliability and validity of student evaluations may no longer be appropriate. Rather, attention should be paid to interpreting the results and utilizing them for formative development of teachers.
Research Question One: How the Students Evaluate their Required English Classes and their Teachers Generally speaking, the high means of most of the items imply that students highly evaluated their English classes and teachers. As a matter of fact, the mean rating on the overall evaluation of the English class and teacher was higher than that of the start-up seminar for first year students and classes related to their major (See Mori & Tanabe, in press for details). Furthermore, of 13 items, the mean ratings of ten items were highest for the English classes. Considering that the English classes surveyed were all required classes and thus it was expected that not all the students were willing to take them, this is somewhat an unexpected result. However, a close examination reveals that the items that especially received high ratings were mostly concerned with teacher's attitudes toward the students. Unlike the law-related classes with as
Students' Course Evaluations and Their Roles in Faculty Development (2):
Analyses of Students' Perceptions toward Required English Classes (Mori & Tanabe)
many as 400 students, the required English classes are small enough to provide an environment where the teacher and students actually interact. Consequently, one can assume that students inevitably pay more attention to how appropriately the teacher treats and interacts with them. In relation to this respect, Yasuoka (2000, p. 38) reports that the scores for foreign language classes were higher than those for three other subject areas: liberal arts, core program and core area of specialization. In his research, however, the key item making a significant difference from other subject areas was
"i
nterest generated by instruction."
In contrary to high ratings on teachers, the results showed that the students gave relatively low ratings on themselves: how concentrated they were on the class, and how much they studied for the class. Although this may reflect the reality, it is also congruent with the finding of previous studies (Mori, 2008, 2009) that show students' tendency to be self-critical while giving teachers credit. Whether this is a possible indication of their self -critical nature or not, despite the fact that the students highly rated teachers' enthusiasm and the way they handled their class, they did not perceive the class stimulating or interesting, and admitted that they themselves did not work very hard.
This is probably a universal tendency seen throughout Japan especially in the present era of so-called free college admissions. There may not be quick remedies to improve the situation, but the findings above could be regarded as helpful clues. Although further research will be required to reveal what kind of teacher's attitudes the students are specifically referring to, if students perceive them as a significant factor, then teachers could pay more attention to fostering desirable relationships with students.
All of the following caring attitudes: giving positive feedback, thinking about the students' position such as level of understanding and anxiety, showing interests in their opinions, could help. Teachers would be more required to attend to the interests of students. Especially in well-organized curriculums where learning contexts and textbooks are somewhat fixed, teachers are likely to struggle to cover what they are expected to teach and might be unable to afford to engage students' interest. Curriculums are supposed to be created relevant for the learners' needs and interests in the first place, but it is teachers who can be attentive to individual expectations.
Research Question Two: How Students' Class and Teacher Evaluations Differ Depending on Types of Classes
Although the English classes in general seem to be regarded highly as mentioned above, there are significant differences in students' response among the different types of classes, namely English 1, Communicative English 1, English 2, Basic Writing, and Communicative English 2. Of 13 items including the overall rating, English 1 received the highest rating on seven items followed by English 2 and Communicative English 2. Those items are mainly concerned with the clarity of the instruction, class atmosphere, and teacher's attitudes toward the students. A possible explanation for this result is that since English 1 is taught mainly by Japanese teachers who probably use a fair amount of Japanese in class, the instruction may be easier to understand. The same can be said about the higher ratings of English 2. In addition, English 1 meets twice a week, which may provide teachers with a better chance to build rapport with their students.
Although English 2 and Communicative English 2 both received higher ratings than Communicative English 1 and Basic Writing, there are some differences between the two. Namely, English 2 received a high rating on the clarity of the instruction while receiving the lowest rating on how interesting and stimulating the class was; in contrast, Communicative English 2 received the lowest rating on how much students understood the instruction while receiving a high rating on how interesting and stimulating the class was. In addition, students gave higher ratings to Communicative English 2 than English 2 on the items concerned with the atmosphere and teacher's enthusiasm.
In other words, the students seem to enjoy Communicative English 2 despite the fact that they did not understand the instruction as much as they did in other classes.
What is interesting is that unlike Communicative English 2, Communicative English 1 consistently received lower ratings than other classes. Considering that both classes meet once a week, and are taught by native English speaking instructors, many of whom teach both Communicative English 1 and 2, this sharp contrast is mysterious and difficult to interpret. It may be due to the fact that first year students are not accustomed with oral English classes. Another possible explanation is the textbooks used for these subjects. All instructors of Communicative English 1 classes must use either one of the two textbooks according to the class level whereas the instructors of Communicative English 2 can choose one from a list of four textbooks recommended by the English Program Steering Committee. Even though the committee obtained their consent in
Students' Course Evaluations and Their Roles in Faculty Development (2):
Analyses of Students' Perceptions toward Required English Classes (Mori & Tanabe) the selection of the textbooks for the program, the instructors of Communicative English 2 have a wider range of choice and this may have led to giving better instructions in the classroom settings.
Research Question Three: How Students' Class and Teacher Evaluations Differ Depending on Proficiency
There are also significant differences in students' response depending on their English proficiency. It could be hypothesized that weaker students tend to give lower ratings especially on items regarding the clarity of the instruction and degree of understanding. However, the results showed that mid level group scored significantly lower than high level group, and there was no significant difference between low and mid level groups or low and high level groups. Specifically, the mid level group scored lower on how much they understood the class, how clearly the teacher talked, how clearly the teacher presented the materials, if the class atmosphere was appropriate, if the class was stimulating and interesting, how enthusiastic the teacher was, and how well the teacher understood students' questions. This result is puzzling, but one possible explanation is that compared with low and high level classes, the variation in proficiency of mid level students may be greater, which makes class management more difficult. From the viewpoint of students' self-critical nature (Mori, 2008, 2009), weaker students may tend to attribute their poor performance more to themselves and will not give lower ratings to teachers.
Research Question Four: What Factors Contribute to the Overall Rating of the Class and Teacher Lastly, what factors contribute to the overall rating of the class and teacher was examined. The results indicated that students' perception of how appropriately the teacher treated students can predict their overall evaluation of the class and teacher the most, followed by how clearly the teacher explained and if the class was stimulating and interesting was. This pattern was also found with the start-up seminar and law- related core classes. In other words, regardless of class size and subject, teacher's attitudes toward the students seem to be the most influential factor in determining overall evaluation of the class. On the contrary, there was no significant correlation between the amount of effort the students put into the class and their overall impression of the class. This means students' favourable impressions of the teacher does not necessarily guarantee whether they actually study or not.
This study has attempted to gain an understanding of students' perceptions towards their English classes and teachers. It has also sought to uncover factors contributing to the overall rating of the class and teacher. Since the results of such evaluations had never been systematically analyzed at Kinki University nor utilized for the improvement of classes on an organizational level, this study has shed some light on the current situation of the English program in the Faculty of Law. Having said that, further discussions are required on how the findings in this study can offer benefit in terms of steering the language program. If the committee just releases the results of the comparisons among subjects without appropriate clarifications, it may lead to unnecessary fear or exaggerated joy among teachers involved. Although one teacher receives better ratings than others, it does not necessarily mean his or her educational practice is more effective than others'. Students' evaluation should not be seen as the definitive source of feedback but as one way to gain feedback on one's teaching.
Reference
Jin, M. (1998). Gakusei niyoru jugyohyoka no shinraisei ni tsuite [Survey for Reliability of Teaching Evaluation by Students]. Social Information, 7(2), 201-205.
Kiryu, N. (2008). Daigaku no eigojugyo ni okeru gakusei no hyokayoin no bunseki: eigo ni taisuru kyomi ni shoten wo atete [A Study of Factors Affecting Student Evaluation of English Lessons at a University: Focusing on Interest in Learning English]. The Journal of Kamakura Women's College, 15 , 63-73.
Makino, K. (1995). Gakusei ni yoru jugyohyoka to shussekiritshu to no kankei (1): jugyo ni deteinai gakusei wa jugyo wo waruku hyoka suru no ka? [The Relationship between Student Ratings of Teaching and Class Attendance (1): Do the students who often skip a class underrate the class?]. Journal of Business Administration and Information, Setsunan University, 13(1), 1- 14.
Makino, K. (2001). Gakusei ni yoru jugyohyoka no kiteiin no kento ( 1): Tahenryokaiseki wo mochiita inga moderu no kento [Determinants of Student Ratings of Instruction 1 —A multivariate analysis of the motivational process—]. Research Bulletin of Takamatsu University, 36, 55-66.
Matsumoto, Y., & Tsukamoto, Y. (2003). CS bunseki no kangaekata wo donyushita jugyohyoka ankeeto no bunseki [Analysis of Lecture Evaluation and Point Quantification for Teaching Improvements Based on the Concept of Customer Satisfaction Analysis]. Kyoto University Researches in Higher Education, 2, 51-62.
Students' Course Evaluations and Their Roles in Faculty Development (2):
Analyses of Students' Perceptions toward Required English Classes (Mori & Tanabe)
Matsuo, T., & Kondo, M. (2005). Gakusei niyoru jugyohyoka wa nanno yaku ni tatsu noka [What is student evaluation of teaching useful for?]. Journal of the Faculty of Humanities, Kitakyushu University. Human Relations, 12, 51-64.
Minami, M. (2003). Gakusei ni yoru jugyohyoka no shinraisei to datosei ni kansuru kento [Reliability and validity of student ratings of teaching]. The Matsuyama University of Commerce Review, 14(6), 55-67.
Ministry of Education, Culture, Sports, Science and Technology (1998). 2lseiki no daigakuzo to kongo no kaikaku housaku ni tsuite [Universities in the 21st century and reform measures].
Retrieved September 23, 2010, from
http://www.mext.go.jp/b menu/shingi/12/daigaku/toushin/981002.htm
Ministry of Education, Culture, Sports, Science and Technology (2009). Daigaku ni okeru kyoikunaiyonado nokaizenjokyo ni tsuite [Report on educational reforms of universities].
Retrieved September 23, 2010, from
http://www.mext.go.jp/a _menu/koutou/daigaku/ 04052801 / icsFiles/afieldfile/
2010/05/26/1294057 _1_1.pdf.
Mori, S. (2008). Who is to blame?: University students' perception of lack of improvement in their English ability. The JACET Journal, 47, 1-16.
Mori, S. (2009). University Students' Explanations for Failure and Success in Learning English as a Foreign Language. Kinki University English Journal, 3, 31-46.
Mori, S., & Tanabe, Y. (In press). Jugyohyoka ankeetochosa kara yomitoreru gakusei no ishiki to jugyo no kadai (1) [Students' Course Evaluations and Their Roles in Faculty Development (1)]. Law Review of Kinki University, 58(2 & 3).
Sumida, K. (1996). Gakusei ni yoru "jugyohyoka" ni kansuru suuryotekibunseki [A Quantitative Analysis of Course-Evaluation by College Students]. Bulletin of Notre Dame Women's College, 26, 23-39.
Tabachnick, B., & Fidell, L. (1996). Using multivariate statistics (3rd ed.). New York: Harper Collins.
Yamada, F., & Yamamoto, S. (2006). Jugyohyoka ankeeto ni taisuru gakusei no ishiki to hyokakekka:
gakusei no jugyohyoka no datosei to shinraisei [Students' attitudes towards assessment on lectures and the quality of assessment data: The validity and reliability of students' assessment on lectures]. Studies in Informatics, Shizuoka University, 12, 95-106.
Yasuoka, T., Oikawa, Y., Kikkawa, M., Yamamoto. G., Takano, J., Mitsuzawa, S., &
Katori, S. (1994). Gakusei ni yoru jugyohyoka no shinraisei ni taisuru kyoinishiki no chosa [A Questionnaire Research in the Teaching Stuffs' Attitudes Considering the Reliability
of Students' Evaluation at Tokai University]. The Bulletin of the Higher Education Research Institute, Tokai University, 2, 87-98.
Yasuoka, T. (2000). Teacher Evaluation: Why Do Native English Foreign Language Teachers Score Higher? The bulletin of the Higher Education Research Institute, Tokai University, 7, 35- 47.
Yonesaki, S. (1992). The Need for Student Evaluation of Instruction in Japanese University English Departments. Sapporo University Women's Junior College journal, 19, 37-48.
Appendix
A Translation of the Questionnaire Q 1 Did you understand the class?
Q 2 Did the teacher explain the lesson clearly?
Q 3 Did the teacher speak clearly?
Q 4 Did the teacher present the materials clearly using tools such as a blackboard
and Powerpoint?
Q 5 Did the teacher try to create an atmosphere where you could focus on the lesson?
Q 6 Was the class stimulating and interesting?
Q 7 Did the teacher follow the syllabus?
Q 8 Was the teacher well prepared?
Q 9 Was the teacher enthusiastic about the class?
Q10 Did the teacher understand your questions and opinions?
Q11 Did the teacher treat you appropriately?
Q12 Did you concentrate on the lesson not chatting or doing anything unrelated to the class?
Q13 Did you study this subject outside the class?
Q14 How would you evaluate the class on a scale from 1 to 10?
Q15 Were the facilities and environment appropriate?