西 南 交 通 大 学 学 报
第 55 卷 第 1 期
2020 年 2 月
JOURNAL OF SOUTHWEST JIAOTONG UNIVERSITY
Vol. 55 No. 1
Feb. 2020
ISSN: 0258-2724 DOI:10.35741/issn.0258-2724.55.1.6
Research article
Computer and Information Science
T
HE
A
RITHMETIC
C
ODING AND
H
YBRID
D
ISCRETE
W
AVELET AND
C
OSINE
T
RANSFORM
A
PPROACHES IN
I
MAGE
C
OMPRESSION
图像压缩中的算术编码和离散离散小波和余弦变换方法
Nassir H. Salman, S. Rafea
Computer Science Department, College of Science, Baghdad University Al-Jadriya, Karrada, Baghdad, Iraq
Abstract
Image compression is one of the data compression types applied to digital images in order to reduce their high cost for storage and/or transmission. Image compression algorithms may take the benefit of visual sensitivity and statistical properties of image data to deliver superior results in comparison with generic data compression schemes, which are used for other digital data. In the first approach, the input image is divided into blocks, each of which is 16 x 16, 32 x 32, or 64 x 64 pixels. The blocks are converted first into a string; then, encoded by using a lossless and dictionary-based algorithm known as arithmetic coding. The more occurrence of the pixels values is codded in few bits compare with pixel values of less occurrence through the sub intervals between the range 0 and 1. Finally, the stream of compressed tables is reassembled for decompressing (image restoration). The results showed a compression gain of 10-12% and less time consumption when applying this type of coding to each block rather than the entire image. To improve the compression ratio, the second approach was used based on the YCbCr colour model. In this regard, images were decomposed into four sub-bands (low-low, high-low, low-high, and high-high) by using the discrete wavelet transform compression algorithm. Then, the low-low sub-band was transmuted to frequency components (low and high) via discrete wavelet transform. Next, these components were quantized by using scalar quantization and then scanning in a zigzag way. The compression ratio result is 15.1 to 27.5 for magnetic resonance imaging with a different peak signal to noise ratio and mean square error; 25 to 43 for X-ray images; 32 to 46 for computed tomography scan images; and 19 to 36 for magnetic resonance imaging brain images. The second approach showed an improved compression scheme compared to the first approach considering compression ratio, peak signal to noise ratio, and mean square error.
Keywords: Arithmetic Coding, Image Compression, Discrete Transform, Block Flipping, Adaptive Run-Length Encoding
摘要 图像压缩是应用于数字图像以减少其存储和/或传输的高成本的数据压缩类型之一。与用于 其他数字数据的通用数据压缩方案相比,图像压缩算法可以利用图像数据的视觉敏感性和统计特
性来提供出色的结果。在第一种方法中,将输入图像划分为块,每个块为 16 x 16、32 x 32 或 64 x 64 像素。块首先转换为字符串;然后,使用称为算术编码的无损且基于字典的算法进行编码。通 过范围 0 到 1 之间的子间隔,与较少出现的像素值相比,更多出现的像素值发生了变化。最后, 压缩表流被重新组合以进行解压缩(图像恢复)。结果表明,将这种类型的编码应用于每个块而 不是整个图像时,压缩增益为 10-12%,并且耗时更少。为了提高压缩率,基于六价铬颜色模型 使用了第二种方法。在这方面,通过使用离散小波变换压缩算法将图像分解为四个子带(低-低, 高-低,低-高和高-高)。然后,通过离散小波变换将低-低子带转换为频率分量(低和高)。接下 来,通过使用标量量化对这些分量进行量化,然后以之字形方式进行扫描。对于具有不同峰值信 噪比和均方误差的磁共振成像,压缩比结果为 15.1 至 27.5。X 射线图像为 25 至 43;计算机断层 扫描图像为 32 至 46; 19 至 36 用于磁共振成像的大脑图像。与第一种方法相比,第二种方法显 示了一种改进的压缩方案,其中考虑了压缩率,峰值信噪比和均方误差。 关键词: 算术编码,图像压缩,离散变换,块翻转,自适应游程编码
I. I
NTRODUCTIONArithmetic coding (AC) is a kind of entropy coding that is considered very efficient for lossless data compression. It encodes data (such as character, image, etc.) by generating a code, which symbolizes a fraction in the unit interval [0, 1]. The algorithm successively partitions subintervals of that unit. In AC, instead of using a sequence of bits to symbolize a symbol, the subinterval of the unit interval is used to represent that symbol. This means that the data are encoded into a number in the unit interval . This procedure can be applied by portioning the unit interval into several fragments according to the number of dissimilar symbols.
The length of each fragment is relative to the probability of each symbol, and then the output data are located in the corresponding fragment according to the input symbol [1]. In [2], an image was divided up into non-lapping blocks, and then every block was encoded distinctly by utilizing arithmetic coding. The suggested model offers a probability distribution for every block, which is modelled by a blend of non-parametric distributions by utilizing a high correlation between neighbouring blocks.
In [3], the input image was divided into blocks, each block is 16 x 16, 32 x 32, or 64 x 64 pixels. If the image size was divided into blocks 16 x 16, 32 x 32, at the end of the dividing we have got number of pixels less than the above sizes, so the block is completed to be the same size of above block sizes using zero padding process. The blocks were first converted to a stream for processing. A stream of compressed tables was stored as bytes, and the compression ratio (CR) was calculated after this process.
Finally, the stream of the compressed tables was reminisced for decompressing (image
reconstruction), and this was implemented on each block. The method is tested on different medical images, and the results show a compression gain of 10 to 12%. After implementing image blocking, the method showed an improved processing time rather than implementing it on the whole image as a single block. This method is one of the lossless compression methods, which means the image is restored in the same quality as the original.
In [4], an effective scheme was suggested for lossy image compression/decompression by using histogram-based block optimization and AC. The results showed that the scheme gives a better CR, like that of JPEG. In [5], a stream of symbols was coded into a stream of bits via the AC process. The input to the coding function is an array of "Data,” such as [3 0 -1 129 9 -255 255 0 0 -3], where the image pixel values are stored as a vector and used as input to coding and decoding functions.
In [6], zeros and few non-zeros values were yielded; thus, an adaptive run-length encoding (RLE) was used to encode zero numbers, which resulted in higher CR, while other image data sub-bands, i.e., low-high (LH), high-low (HL), and high-high (HH), were also compressed by quantization, quad-tree, and shift optimizer. Finally, the compression/decompression results of the two techniques were compared.
In this article, AC concept and AC procedures are discussed in Section 2; the proposed arithmetic code steps in Section 3; hybrid discrete wavelet transform and discrete cosine transform (DWT-DCT) is discussed in Section 4; zigzag scan process is indicated in Section 5; the results of using arithmetic code is discussed in Section 6; the test and results of using proposed hybrid
3
DWT-DCT are shown in Section 7; and end up with the Conclusion and Discussion Section.
In [7], a hybrid image compression technique was proposed by using DWT, DCT, and arithmetic encoding. The results showed the effectiveness of the proposed scheme in compressing the medical image. Also, the comparative analysis showed that the proposed system is competent to compress the images in terms of peak signal to noise ratio (PSNR) and mean square error (MSE).
In [8], an application of the DCT compression technique on magnetic resonance imaging (MRI) medical images was proposed. Then, the AC method wasused to encode the coefficients. The results showed that the DCT technique improves the compression rate with good image quality by using threshold values, which vary between (0-20) for the block sizes 16 x 16 and 32 x 32.
II. T
HEORETICALB
ACKGROUND A. Arithmetic Coding ConceptConsider a ternary alphabet
with , , and . Consistent with the mapping Equation (1), probability density function (PDF) for the arbitrary variable Equation (2), and increasing cumulative density function (CDF) Equation (3), below [1], [9]:
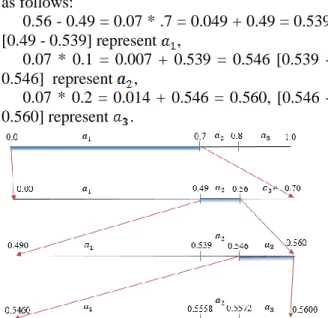
, , (the summation of the first probability and the second one), and (the summation of the three symbols probability). Now, let the input sequence ( , ). This divides the unit interval, as presented in Figure 1 [1].
The first symbol in the input sequence is which is in the subinterval [0.0 - 0.7). It is subsequently segmented as the initial interval. Thus, the subintervals [0.00 - 0.49) correspond to , [0.49 - 0.56) correspond to , and [0.56 - 0.70) correspond to . Now, the interval [0.49- 0.56) is chosen because the second symbol is , and so on. The simple calculations for these intervals are as follows:
0.7 – 0 = 0.7 starting with subinterval of ; then, 0.7 * probability = 0.7 * .7 = 0.49 [0 - 0.49] for , 0.7 * .8 = 0.56 [0.49 - 0.56] represent interval; then, continue for [0.56 - 0.7]. Now,
by using interval of , the new intervals become as follows: 0.56 - 0.49 = 0.07 * .7 = 0.049 + 0.49 = 0.539 [0.49 - 0.539] represent , 0.07 * 0.1 = 0.007 + 0.539 = 0.546 [0.539 -0.546] represent , 0.07 * 0.2 = 0.014 + 0.546 = 0.560, [0.546 -0.560] represent .
Figure 1. Determining the interval containing the input
sequence ( , )
Now, the 3rd symbol is ; then, the interval [0.546 - 0.560) is chosen, which can be split further by the same technique described earlier. In this case, restricting the intervals depends on
that sequence.
B. Arithmetic Coding Procedures
Once animage is read, a matrix of pixels will be obtained. For a grey-scale image of any format, the pixel values range from 0 to 255. All procedures that we have to do are to make a list of all the pixel values and find out the number of pixels that belongs to each of these intensities (to estimate the statistical distribution of the pixels in the image). Then, estimate the occurrence (probability) of these intensities of the input image by splitting the pixel sums in each entry by the whole number of pixels. These pixel intensities are the resource symbols with their equivalent probabilities, and those considerations are given to the AC procedure [10].
As an example, to generate a binary sequence for letters of an alphabet of size 4 to 5 with probabilities presented in Tables 1 and 2, Equations (3) and (4) are used to generate the binary code [9].
=
Equation (4) means: for each , will have a unique value in the interval [0, 1]. This value can be used as a unique value for .
Therefore, the binary code for is calculated by using bits, where denotes the logarithm to base 2 as in Equation (5).
For example, for symbol 1 in Table 1 below, the calculations of are as follows:
and the codeword is 001.
Table 1.
Four symbols and their probabilities for generating a binary code
Symbol i in binary Codeword 1 0.25 0.25 1 0.125 0.001 3 001 2 0.5 0.75 2 0.5 0.10 2 10 3 0.125 0.875 3 0.8125 0.1101 4 1101 4 0.125 1.0 4 0.9375 0.1111 4 1111
The quantity is obtained by using Equation (4), and the binary representation of is truncated to bits. The binary code, as in Table 2.
see Equation (4), and
, but
, and so on, see Table 2.
Table 2.
Five symbols and their probabilities for generating a binary code
Symbol in binary Codeword
1 0.25 0.25 0.125 0.001 3 001
2 0.25 0.50 0.375 0.011 3 011
3 0.20 0.70 0.60 4 1001
4 0.15 0.85 0.775 4 1100
5 0.15 1.00 0.925 4 1110
It can be evidenced that a code gained in this way is a distinctively decodable code. For more about AC details [1].
III. P
ROPOSEDS
YSTEMB
ASED ONA
RITHMETICC
ODETo code image pixels values, Figure 2 shows the steps of using AC as follows [3]:
1. Read any image file format f1 (i.e., JPG, GIF, PNG, etc.).
2. Divide the image into blocks (each block size is 16 x 16, 32 x 32, or 64 x 64 pixels) and move or slide window, which is designed to strip the image into blocks. The blocks are parted first as a stream in order to process them, count the number of the blocks. Moreover, calculate the size of what remains of the image to complete it
into block of size 16 x 16, 32 x 32, and 64 x 64 using zero padding. Call the AC function to code image pixels values.The result is a sequence of compressed tables [3].
In this step, a complete program was used for coding a stream of symbols into a stream of bits by using the AC algorithm [5]. The input to the function is an array of "Data." Also, in this step, the following procedures were done:
first function [store_byte, counts, table] = Arith-code (Data) is called. This function computes tables and the probability of the symbols, where prob = counts/sum (counts) (Figures 3-5);
applying arithmetic coding procedure using the following relation: Code = arithenco
5
(New_Data, Counts); to conver bits to bytes (Figure 6).
3. Calculate the compressed image file size, where at the beginning the image is divided into blocks without compression, then these blocks are compressed, so the file size of these blocks before and after compressing is calculated, then Cr is calculated.
4. Then, calculate the CR: CR = (M * N * 8 – sum [Block Size])/(M * N * 8); original image
file size– compressed size divide by original image.
5. And finally, the original image was recovered from decompressed one, where the stream is recollected for decompressing process, and this is done for each block: This step represents the decoding process by AC via arithdeco (code, Counts, length [Data]) function.
6. Calculate the elapsed time (sec) for compressing/decompressing different images.
Figure 2. The presentation of the proposed method and algorithm steps [3]
IV. H
YBRIDDWT-DCT
M
ETHODSIn the second technique (hybrid DWT-DCT), YCbCr colour model images are decomposed into four sub-bands (low-low (LL), HL, LH, and HH) by using the DWT compression algorithm. The LL sub-band is converted to frequency elements by using the DCT method, and then scalar quantization was applied. This yielded a lot of zero numbers and less non-zero values.In this case, adaptive RLE was used to compress the zero numbers, which resulted in higher compression for each block, while the remaining three sub-bands wereprocessed via quantization, quad-tree, and shift optimizer.
In this scenario, the quantization parameters were reduced by 50% forthe Y band, and there is no change for (Cb and Cr bands). The image quality is good. Then, using a zigzag scan yields a one-dimensional array with a long sequence of zeros. Then, AC coefficient blocks are flipping to
produce more run-of-zeros for further compression [6].
V. Z
IGZAGS
CANP
ROCESSTo increase CR, a zigzag scan was used after hybrid DWT-DCT, flipping block technique, and adaptive RLE techniques, where the zigzag scan wassmeared for the quantized coefficients. This yielded a one-dimensional array, which started with the highest values of each block and ended with many sequences of zeros.
The results showed that the proposed procedure gives better results comparing with DCT only. The proposed flipping block method and then RLE method enhanced CR, where, in this combination, the zero numbers werecompressed to increase CR. Also, this yielded better results than the traditional RLE method. Finally, the time of encoding and decoding processes was reduced. Moreover, CR
results were between 15.1 to 27.5% for MRI with different PSNR and MSE, 25 to 43% for X-ray images, 32 to 46% for computed tomography (CT) scan images, and finally 19 to 36 % for MRI brain images [6].
VI. T
EST ANDR
ESULTS BYU
SINGP
ROPOSEDA
RITHMETICC
ODING/D
ECODINGT
ECHNIQUEFirst of all, many samples of grayscale medical images of different sizes and formats were read, and the following results weredone:
1. Displaying the original data of the input image
2. The table of pixel values, where the occurrence pixels displayed one time only.This means that the values in the table included only the image data without repeating
3. Calculating the count of each occurrence of each pixel value
4. The probability of the table symbol values wascalculated. The original image data were shown in Figure 3.
Figure 3. The presentation of the original input image data (between 0 -255) [3]
Then, the table of pixel values and count of each occurrence result, as in Figure 4.
Figure 4. The table of the pixel values and their occurrence [3]
The values in Figure 4 included only the image data without repeating, where the original data represents all input data (here are the pixel values). Moreover, the probability of the table symbol values was calculated (Figure 5).
Figure 5. The presentation of the probability of the table symbol values [3]
Simply, the following calculations showed coding data by using the Arith_Code1(input image) function [5].
if the pixels values are (i.e., 10, 8, 8, 9, 9, 9, 12, 0, 0, 10), these are coded into the following:
D_Bits =
0001010110001110111111100100000 = 31 bits
converted into bytes.
Store_Byte = 21 142 254 64, where 21 represented in binary 00010101
Counts = 3 2 3 1 2, this means 10 occurrences 3 times….etc.
Table = 10 8 9 12 0, shows the image pixel values without repeating, see pixel values above.
Figure 6. The presentation of the coding data by using the arithmetic code algorithm
Figure 7 shows the original and recovered images after compressing/decompressing processes by using AC for some medical images, which got from Rezgari Hospital, Erbil, Iraq. The calculations of CR are shown in Table 3.
Figure 7. The exhibition of the original and recovered images by using the AC algorithm [3]
7
Table 3.
The calculation of the image file and CR [3] Image type and
resolution
Image file size (bit)
Compression image file size
(bit) Compression ratio * % Elapsed time (sec) Applications 331 x 553 .jpg 1464344 145604 90.057 77.8591 Medical 357 x 429 .jpg 1225224 139349 88.627 57.0807 Medical 500 x 362 1448000 160892 88.889 79.6536 Normal image
* CR = (M * N * 8 –sum [Block Size])/(M * N * 8); [original image file size – compressed size] divided by the original image size
VII. T
EST ANDR
ESULTS BYU
SINGP
ROPOSEDH
YBRIDDWT-DCT
After using hybrid DWT-DCT andthen zigzag scanning of the quantized coefficients, the output is one dimensional array of long sequences of zeros (Figure 8). Then, the proposed flipping of blocks’ procedure was applied with the adaptive
RLE methods, as mentioned previously (see Figure 8). For more details, see our previous work in [6].
Different digital medical images wereused as in Figures 9-12. The results presented high CR and high quality of reconstructed images [6] (Figures 9-12).
Figure 8. Example of the proposed flipping block
CR 27.5 21.20 17.25 15.11
PSNR 30.05 31.43 32.43 33.0
MSE 64.18 46.71 37.12 32.04
Figure 9. The reconstructed MRI of brain [6]
CR 43.08 38.23 31.04 25.76
PSNR 30.12 31.02 32.02 33.20
MSE 63.16 51.32 40.77 31.06
CR 46.09 40.83 38.40 32.61
PSNR 30.71 31.40 32.00 33.00
MSE 55.13 47.02 49.79 32.57
Figure 11. The reconstructed CT scan images [6]
CR 36.95 30.31 25.63 19.15
PSNR 30.08 31.39 32.13 33.08
MSE 63.71 47.16 39.18 31.95
Figure 12. The reconstructed knee images [6]
VIII. C
ONCLUSIONS By using AC, the original image was recovered easily from the compression one without any loss (lossless compression tech). The processing time became short with using blocks compare with using one block (the whole image).
The proposed method can be used for image data or any array data for coding and encoding without any loss. AC is very useful for medical images compared with using JPEG format (lossy), because AC is lossless. Moreover, CR is 10 to 12%, which means, for example, if the image file size is 100 kb, it becomes 90-88 kb. That is useful for sending compression images via e-mail (i.e., small size), for diagnostic, as well as for storing many image files in the hospital.
In the second technique, hybrid DCT-DWT improved the CR, PSNR, and MSE compared with the use of only DCT. The proposed idea of the flipping block and adaptive RLE methods increased CR. Also, the results were better than the traditional RLE method.
Furthermore, because of the combination of the previous method, the time of encoding and decoding processes was reduced. CR results were between 15.1 to 27.5% for MRI with different PSNR and MSE, 25 to 43% for X-ray images, 32 to 46% for CT scan images, and finally 19 to 36 % for MRI brain images.
Finally, according to the results of high CR ,fast processing, and good quality for reconstructed images, the second technique was better than the first one, i.e., arithmetic algorithm (see the results in Figures 9-12 and Table 3).
A
CKNOWLEDGMENTThanks to Baghdad University, College of Science, and Computer Science Department to support this research, which included in the research plan of the Computer Science Department, the academic year 2018-2019.
R
EFERENCES[1] SAYOOD, K. (2006) Introduction to
Data Compression. 3rd ed. Burlington,
Massachusetts: Morgan Kaufmann.
[2] MASMOUDI, A., PUECH, W., and
MASMOUDI, A. (2015) An improved
lossless image compression based arithmetic
coding using mixture of non-parametric
distributions.
Multimedia
Tools
and
Applications, 74 (23), pp. 10605-10619.
[3] SALMAN, N.H. (2016) New Image
Compression/Decompression
Technique
Using Arithmetic Coding Algorithm. Journal
of Zankoy Sulaimani, 19 (1), pp. 263-272.
[4] DUTTA, S., ABHINAV, A., DUTTA, P.,
KUMAR, P., and HALDER, A. (2012) An
Efficient Image Compression Algorithm
Based
on
Histogram
Based
Block
Optimization
and
Arithmetic
Coding.
International Journal of Computer Theory
and Engineering, 4 (6), pp. 954-957.
[5] SIDDEQ, M. (2011) Arithmetic Coding
and
Decoding.
[Online]
MathWorks.
Available
from:
https://www.mathworks.com/matlabcentral/fi
leexchange/33070-arithmetic-coding-and-decoding [Accessed 20/01/20].
[6] RAFEA, S. and SALMAN, N.H. (2018)
Hybrid DWT-DCT compression algorithm &
a new flipping block with an adaptive RLE
method for high medical image compression
ratio. International Journal of Engineering &
Technology, 7 (4), pp. 4602-4606.
[7] ABDELGHANY, H.M., MORSY, M.,
and ELZALBANY, M. (2017) Hybrid Image
Compression
Using
DWT,
DCT
and
Arithmetic Coding. International Journal for
9
![Figure 2. The presentation of the proposed method and algorithm steps [3]](https://thumb-ap.123doks.com/thumbv2/123deta/8046875.1255117/5.892.185.740.279.743/figure-presentation-proposed-method-algorithm-steps.webp)
![Figure 9. The reconstructed MRI of brain [6]](https://thumb-ap.123doks.com/thumbv2/123deta/8046875.1255117/7.892.216.700.694.1157/figure-reconstructed-mri-brain.webp)
![Figure 11. The reconstructed CT scan images [6]](https://thumb-ap.123doks.com/thumbv2/123deta/8046875.1255117/8.892.220.695.83.299/figure-reconstructed-ct-scan-images.webp)
