西 南 交 通 大 学 学 报
第 55 卷 第 6 期
2020
年 12 月
JOURNAL OF SOUTHWEST JIAOTONG UNIVERSITY
Vol. 55 No. 6
Dec. 2020
ISSN: 0258-2724 DOI:10.35741/issn.0258-2724.55.6.36
Research articleEducation
R
EADING
C
OMPREHENSION
S
TRATEGIES
E
FFECTIVENESS IN
C
OMPLETING
T
EST OF
E
NGLISH AS A
F
OREIGN
L
ANGUAGE
阅读英语策略在完成英语作为外语的测试中的有效性
Masrupi a, Jhon Fahamzah a, Nurhaeda Gailea a, Ahmad Baihaki a, Mustofa Usman b, * a Department of English Education, Postgraduate School, Universitas Sultan Ageng Tirtayasa Serang, Indonesia, masrupi@untirta.ac.id, jhonfahamzah@untirta.ac.id, nurhaeda.gailea@untirta.ac.id,ahmad.baihaki@untirta.ac.id
b Department of Mathematics, Faculty of Mathematics and Natural Sciences, Universitas Lampung Bandar Lampung, Indonesia, M_usman_alfha@yahoo.com
Received: May 15 , 2020 ▪ Review: September 20, 2020 ▪ Accepted: December 15, 2020
This article is an open access article distributed under the terms and conditions of the Creative Commons Attribution License (http://creativecommons.org/licenses/by/4.0)
Abstract
In this experimental study, Senior high school students take the Test of English as a Foreign Language reading comprehension test using test-taking strategies. One test group takes the Test of English as a Foreign Language as a Computer-Based Test (CBT), and the control group takes the Test of English as a Foreign Language as a Paper-Based Test (PBT). Each class consists of 80 senior high school students divided into 2 groups: 40 male and 40 female, respectively. The experiment was conducted during one semester. The statistical analysis used Factorial Design (2x2) using factors of Sex (Male, Female) and Test (CBT, PBT). For multiple comparison analysis, the Tukey’s method was used. To compare the statistics of the students’ pre-test and post-test scores, the paired t-test was used. From the results of analysis using factorial design, it was found that: The mean Test of English as a Foreign Language reading comprehension scores of males and females was significantly different (p-value < 0.0001); the female mean was higher than the male mean; there was no significant difference between the mean scores of CBT and PBT testing; and there was no interaction between sex and test type. From the analysis results of pre-test and post-test scores using the paired t-test, the difference was very significant (p-value < 0.0001). These results indicate that the Test of English as a Foreign Language reading comprehension scores of students in in both groups (experimental and control), are increased.
Keywords: Computer Based Test, Paper Based Test, Factorial Design, Test of English as a Foreign Language, Reading Comprehension
摘要 在这项实验性研究中,高中学生采用考试策略将英语考试作为外语阅读理解考试。一个测试
础考试(PBT)。每个班级由 80 名高中生组成,分为 2 组:分别为 40 名男性和 40 名女性。该实 验在一个学期内进行。统计分析使用因子设计(2x2),使用性别(男性,女性)和测试(CBT, PBT)因子。为了进行多重比较分析,使用了图基的方法。为了比较学生的测试前和测试后分数的 统计数据,我们使用了配对的 t 检验。从析因设计的分析结果发现:男女平均英语测验的阅读理 解得分有显着差异(p 值<0.0001);女性平均数高于男性平均数; CBT 和 PBT 测试的平均得分之 间没有显着差异;性别和测试类型之间没有交互作用。从使用配对 t 检验的测试前和测试后分数 的分析结果来看,差异非常显着(p 值<0.0001)。这些结果表明,两组(实验组和控制组)的学 生的英语作为外语阅读理解分数都得到了提高。 关键词: 计算机基础考试,纸本考试,析因设计,英语作为外语考试,阅读理解
I. I
NTRODUCTIONIn English, there are four basic skills expected to be mastered by students, one skill being reading. Reading is the main gateway for
obtaining information, knowledge, and
expression of ideas. It is regarded as a vital method for communication, especially in
educational development. It is deemed
impossible to have a wide range of knowledge without reading. However, reading by itself is not enough; students need to be able to analyze and reorganize ideas and information. In order to fully learn what is read, students must be able to comprehend written text. The reader is involved in a meaning-based activity that is purpose- and comprehension-driven (motivated by the reader’s
purpose, and encouraged by increasing
comprehension of text) [1]. As this is a complex activity, many students have difficulties in completing the TOEFL (Test of English as a Foreign Language) reading comprehension exam. Based on the statement above, it can be concluded that reading comprehension can be a difficult and challlenging tasks when the student lacks the required knowledge and has not mastered an appropriate testing strategy.
The TOEFL is a standardized test to measure the English language ability of non-native speakers wishing to enroll in English-speaking universities. The test is accepted by many English-speaking academic and professional institutions. TOEFL is one of the two major English-language tests in the world (the other being the IETLS). Darrell [2] stated that TOEFL is a trademark of the Educational Testing service (ETS), a private non-profit organization, which design and administerers the test [3]. There are two models for TOEFL reading comprehension skills: the computer-based test (CBT) and paper-based test (PBT) models. Implementing TOEFL reading comprehension using the CBT makes grading easier for the teacher because it immediately provides the score. In addition, it is
easier to analyze the problem because it is already on the server, and the teacher checks the server for the values, data, and analysis. English was entered into the Academic Potential Ability Test (APAT). Unfortunately, not all English language skills were tested, and it focused more on reading skills on the CBT and PBT test methods. The objectives of this study are (a) to discover whether the CBT or PBT is more significant in assessing students’ reading skills and (b) to understand the influence of the CBT or PBT in assessing higher education students’ reading skills. Additionally, CBT and PBT are used to test TOEFL reading comprehension in higher education.
Therefore, strategy and proficiency have a significant correlation. Proficient learners use an appropriate strategy in completing a task or problem. Hence, the strategy gives them a greater chance to get a higher score. The test-taking strategies have been referred to as techniques, tactics, potentially conscious plans, consciously employed operations, learning skills, basic skills, functional skills, cognitive abilities, language
processing strategies, and problem-solving
procedures [4]. According to [5], test-takers use test-taking strategies as operations or steps to facilitate the retrieval of information; these strategies were classified into four groups: reader-initiated strategies, text-initiated strategies, bilingual strategies, and interactive strategies. Furthermore, according to [6], test-taking strategies are “test-taking processes that the respondents have selected and of which they are conscious, at least to some degree”.
A. The Definition of CBT
What is the CBT? CBTs are exams conducted on the computer instead of via the pencil-and-paper format. O’Malley et al. [7] stated CBTs are widely used in different areas such as colleges, schools, competitive exams, employee training programs, and numerous other platforms. At
CBTs, candidates sit at a computer, and questions are presented on the monitor. The candidates submit the answers through the use of a keyboard or mouse. Each computer is connected to a server that prepares the question set and delivers it to the candidates for evaluation. A CBT is sometimes known as a digital assessment or e-assessment [8]. As the name suggests, a computer-based test involves the use of a computer and is a digital rather than a paper-based test. Increasingly, tests are being developed solely for computer-based testing rather than both
computer-based and paper-based testing.
Computer-based tests can come in many forms such as:
online, requiring an internet connection for each question to be uploaded or downloaded, one at a time
offline, where the test is downloaded to a
local location before the exam and then uploaded once complete.
Gujral [9] stated that CBT is an abbreviation for Computer-Based Test or Center-Based Test. CBT is an electronic form of assessment
conducted on computers at dedicated
examination centers that are fully equipped with facilities and individual desktops for all candidates.
As stated in [10], a CBT uses the computer as a medium, or a technique, with which to conduct an online examination without using pen and paper. In India, all the major entrance examiners are opting for CBT, in order to make their assessment procedures smooth and accurate.
Basically, according to [11], CBTs were at the forefront of online assessment in the examination industry. Now all major entrance examinations in India are opting for CBT to make their assessment procedure smooth and accurate. Examination boards need a robust platform that can uphold all the aspects of CBT. From registration to results declaration, CBT is the best way to conduct online examinations, with the following security features.
B. The Definition of Paper-Based Test
While computers are an important part of language testing, only a relatively small group of professional testers use them in producing and administering language tests. A score derived from CBT, as compared to paper-based testing (PBT), might reflect not only the examinee’s proficiency in the unit measured but also their level of language [12]. Clariana and Wallace [12] in their study found that it is critical to realize that CBTs and PBTs, even when they contain identical elements, will not necessarily produce
equivalent measures of student learning.
Instructors and institutions should spend time, resources, and effort to mitigate test mode effects. C. Test-Taking Strategy in Completing
TOEFL Reading Comprehension Skill Tests can be conducted verbally, on paper, on a computer, or in a restricted area that requires test takers to perform a series of skills [13]. They vary in style, accuracy, and requirements. For example, in a closed book test, test takers are often asked to rely on memory to respond to certain items while in an open book test, test participants can use one or more additional tools such as a reference book or calculator when responding to an item. Tests can be done formally or informally. Examples of informal tests are reading tests given by parents to children. An example of a formal test is the final examination given by a teacher in class or I.Q.
The test-taking strategies have been referred to as techniques, tactics, potentially conscious plans, consciously employed operations, learning skills, basic skills, functional skills, cognitive ability, language processing strategies, and problem-solving procedure [4].
According to Jimenez et al. [5] test-taking strategies as operations or steps used by test-takers to facilitate the retrieval of information and classified them into four group – reader initiated strategies, text initiated strategies, bilingual strategies and interactive strategies. Futhermore, Test-taking strategies according to Cohen and Upton [6] are "test-taking processes that the respondents have selected and of which they are conscious, at least to some degree".
II. S
TATISTICALA
NALYSIS ANDM
ODELINGIn many experiments, success or failure may depend more on the selection of treatments for comparisons to be made than the design. The selection of both the design and the treatments is important, and neither should be slighted in planning the experiment [14], [15].
A factorial design is one in which all possible combinations of the levels of two or more treatments occur together in the design. A set of treatments that contains two or more levels of two or more factors or substances in all combinations is known as a factorial arrangement.
In contrast to previously discussed methods, a factorial design provides a greater dimension of statistical analysis. In factorial designs, at least two variable factors are evaluated. Recall that, in chapters 2 and 3, the discussion focused on the following types of design: (1) one experimental
factor, (2) one experimental factor with blocking in one direction (completely randomized block design), (3) and one experimental factor with bidirectional blocking (Latin square design). Suppose that one is interested in studying two variable factors—an antimicrobial product’s efficacy relative to the concentration of the antimicrobial in several formulas and the length of hand washing time. One could evaluate the concentration effects in one Analysis of Variance (ANOVA) and then evaluate the length of hand washing time in another ANOVA. However, any interaction affecting the product’s efficacy related to both concentration and application time would probably not be discovered. This can present a major problem. Hence, the main advantage of a two-factor design over separate one-factor designs is the detection of such interactions when present [16]. The mathematical model of the factorial design is as follows:
ijk j i
ij Sex Test
Score , (1) where Scoreij is the student’s score for Sex (i = M,
F) and Test (j = CBT, PBT); μ is the grand mean; Sexi is the effect of the i-th sex; Testj is the effect
of the j-th test; and ijkis an error term, where it
is assumed that ijk ⁓ n(0, σ 2
) is normally distributed, with mean 0 and variance σ2. For further analysis, we also used a multiple comparison approach, which can be found in [17].
III. R
ESULTS ANDD
ISCUSSIONIn this study, the experimental class is the class of TOEFL reading comprehension students with a computer-based test (CBT) strategy, consisting of 40 male and 40 female students, and the control class is the same type of class with a paper-based test (PBT) strategy, consisting of 40 male and 40 female students. In this study, two tests were conducted—a pretest and a posttest. The pretest was administered at the beginning of
the experiment, while the posttest was
administered at the end of the experiment after the learning process in both the experimental class with the CBT approach and the control class with the PBT approach. To determine whether there are some different effects of the test-taking strategy, in the ANOVA, a factorial design (2 x 2) was used, with the factors of Sex (male, female) and Test-Taking Strategy (CBT, PBT).
From the analyzed data, after the process of teaching TOEFL reading comprehension with CBT and PBT strategies, the following results were found: First, to test whether the model was significant, we tested the null hypothesis that the
model was not significant (not reliable) against the alternative hypothesis that the model is reliable (significant). The findings are listed in Table 1.
Table 1.
Analysis of variance for testing model (1)
Source DF Sum of squares Mean square F value P-value Model Error Corrected Total 3 156 159 38686.25 20173.75 58860.00 12895.41 129.31 99.72 <.0001 R-square = 0.6573
It was found that the F-test statistic = 99.72, with a p-value < 0.0001; we conclude that the null hypothesis can be rejected and the model is significant (reliable) and can be used for further analysis. Moreover, R-square = 0.6573, which means that 65.73% of the variation of students’ scores can be accounted for by the model or by the Test and Sex factors. This value is high enough, indicating that the model is sound and can be used to explain the results of the experiment in this study.
To test the null hypothesis Ho:M F against Ha:MF, from the result of analysis
in Table 2, the F-test statistic = 297.25, with a p-value < 0.0001; therefore, we reject the null hypothesis. There is a significant difference in scores between male and female participants regarding the proficiency in TOEFL reading comprehension. Figure 1 shows that the female participants’ scores are higher than the male participants’ scores on TOEFL reading comprehension. The results of the multiple comparison conducted using Tukey’s method (Table 3) show a significant difference between the mean scores for females (106) and male (75).
Table 2.
Analysis variance for testing Sex, Test, and interaction Test*Sex Source DF Type I SS Mean square F value P-value SEX TEST TEST*SEX 1 1 1 38440.00 140.62 105.62 38440.00 140.62 105.62 297.25 1.09 0.82 <.0001 0.2987 0.3675
Figure 1. Box plot of the distribution of scores of female and male in TOEFL reading comprehension
Table 3.
Multiple comparison for female and male by Tukey method
Tukey Grouping Mean N SEX
A B 106.000 75.000 80 80 F M
Note: Means with the same letter
are not significantly different.
Critical value of studentized range =2.79348 and minimum significant difference = 3.5517
To test whether there was an effect of the treatment in this experiment, namely CBT versus PBT, on the students’ TOEFL reading comprehension, we tested the null hypothesis
PBT CBT
:
Ho against Ha:CBTPBT from
the results of the analysis in Table 2. The F-test statistic = 1.09 with a p-value = 0.2987; therefore, we do not reject the null hypothesis. There was a nonsignificant difference in the scores between CBT and PBT regarding the proficiency in TOEFL reading comprehension scores. Figure 2 shows that the students’ CBT versus PBT scores were non-significantly different. The multiple comparison using Tukey’s method (Table 4) showed a nonsignificant difference between the mean scores for students completing the CBT (91.438) and students completing the PBT (89.563).
Figure 2. Box plot of the distribution of scores of students with CBT and students with PBT in TOEFL reading
comprehension Table 4.
Multiple comparison for means of students with CBT and PBT test
Tukey Grouping Mean N TEST
A A A 91.438 89.563 80 80 CBT PBT
Note: Means with the same letter
are not significantly different.
Critical value of student range = 2.79348 and minimum significant difference = 3.5517
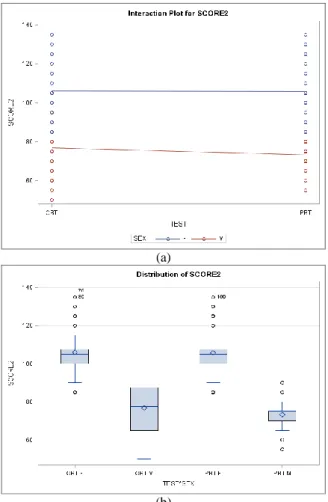
To test whether there was an interaction between the Test and Sex factors, we tested the null hypothesis that there was no interaction against the alternative hypothesis that there was a Test*Sex interaction. From the results of the analysis in Table 2, the F-test statistic = 0.82 with a p-value = 0.3675. Therefore, we do not reject the null hypothesis. There was no Test*Sex interaction. This result is supported by Figures 3 and 4.
(a)
(b)
Figure 3. Interaction plot for TOEFL reading comprehension scores (a) no interaction and the line are parallel, (b) indicate
that the Female scores for both CBT and PBT are higher than those Male scores for both CBT and PBT indicate no
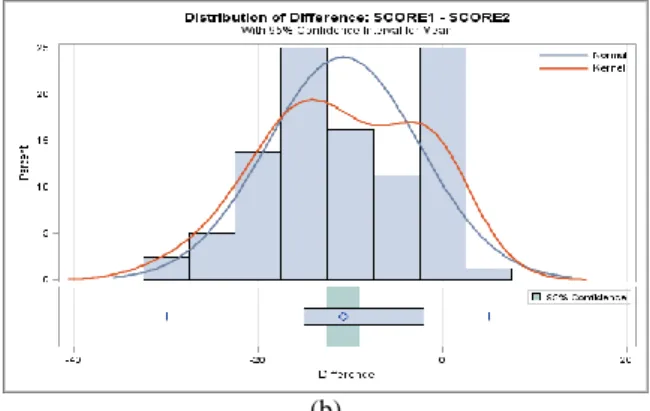
To elaborate more deeply, we can see the behavior of the students’ scores of Pretest and Posttest TOEFL reading comprehension. The results of Pretest and Posttest for both classes of experimental class, students with TOEFL reading with CBT, and control class, students with PBT. To test the null hypothesis of no differencing between Pretest and Posttest in experimental class, we test the null hypothesis that there is no paired difference between posttest and pretest or Ho: d = 0 against Ha: d ≠ 0, d mean differencing between posttest and pretest scores, by using paired t-test. From the result of analysis it was found that t-test = -10.80 with p-value < 0.0001. We conclude that there is significant difference between the results of posttest and pretest in class experiment. From the Figure 4(a), the distribution of paired differencing shows the mean is negative, this indicate that the posttest scores are higher than the pretest scores of students in experimental class. To test the null hypothesis of no differencing between Pretest and Posttest in
control class, class TOEFL reading
comprehension with PBT, we test the null hypothesis that there is no paired difference between posttest and pretest or Ho: d = 0 against Ha: d ≠ 0 by using paired t-test. From the result of analysis it was found that t-test = -11.61 with p-value < 0.0001. We conclude that there is significant difference between the results of posttest and pretest in control class. From the
Figure 4(b), the distribution of paired
differencing shows the mean is negative, this indicates that the posttest scores are higher than the pretest scores of students in control class.
(a)
(b)
Figure 4. The distribution of paired differencing pretest-posttest (a) class experiment, (b) class control
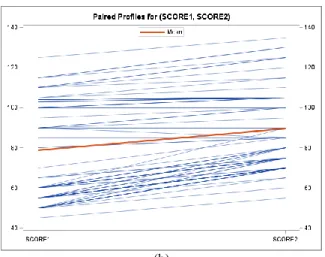
The results above, can be explained more by using Figure 5(a) and (b). the profile analysis of paired differencing between pretest and posttest scores. Figure 5(a), class experiment shows that most of the scores of students’ TOEFL reading comprehension in posttest scores are increase only few are constant and one decrease, but over all trend are positive. This indicates that, the class of experiment after the teaching learning process of TOEFL reading comprehension with CBT test approach, most of the students’ knowledge are increase and over all mean (the red line) is also has trend increase. Figure 5(b), class control shows that most of the scores of students’ TOEFL reading comprehension in posttest scores are increase only few are constant and some decrease, but overall trend is positive. This indicates that, the class control after the teaching
learning process of TOEFL reading
comprehension with PBT test approach, most of the students’ knowledge are increase and over all mean (the red line) is also has trend increase.
(b)
Figure 5. The profile analysis of paired differencing between pretest and posttest scores (a) class experiment, the students
TOEFL reading comprehension with CBT, and (b) class control, the students TOEFL reading comprehension with
PBT
(a)
(b)
Figure 6. Agreements of Posttest (Score 2) and Pretest (Score 1) of (a) class experiment, the students TOEFL reading comprehension with CBT, and (b) class control, the
students TOEFL reading comprehension with PBT
Figure 6(a), the agreement between posttest scores and pretest scores in class experiment shows that most of the scores of students’ TOEFL reading comprehension in posttest scores are increase only 8 students the score are constant and one decrease. This indicates by most of the values are above the diagonal line, the class of experiment after the teaching learning process of
TOEFL reading comprehension with CBT test approach, most of the students’ knowledge are increase and over all mean increase. In Figure 6(b), the agreement between the posttest scores and pretest scores in the control class shows that most of the students’ TOEFL reading comprehension posttest scores increase. A mere five scores remain constant, and only one decreases, as indicated by most of the values being above the diagonal line. These results suggest that teaching the learning process of TOEFL reading comprehension with the PBT test approach increases most of the students’ knowledge and the overall class mean.
IV. C
ONCLUSIONThis study compared an experimental class,
which learned the TOEFL reading
comprehension section with CBT, and a control class, which learned the section with PBT, using analysis of variance that included a 2x2 factorial design with the factors of Sex (male, female), and Test (CBT, PBT). Based on the results of this study, it can be concluded that there is a significant difference in scores between the male and female students. However, the effect of the test-taking approach between the experimental and control classes is not significantly different. The test for interaction concluded that there is no interaction between Sex and Test type in either the experimental or control class: the female students’ scores are higher in both classes. The most noteworthy results show that majority of the students’ scores in both the experimental and control classes increase after the process of teaching learning.
A
CKNOWLEDGMENTThe authors would like to thank to the
Universitas Sultan Ageng Tirtayasa for
supporting the financial for this study. The authors also would like to thank the anonymous referees for their suggestion and improvement of this paper.