Biocompatibility of Ultra-high Pure Iron Using
Mammalian Cell Lines
著者
Khan Luqman
学位授与機関
Tohoku University
学位授与番号
11301
Biocompatibility of ultra-high pure iron
using mammalian cell lines
(動物培養細胞を用いた超高純度鉄の生体適
合性に関する研究)
By
Khan Luqman
2019
Department of Developmental Biology and Neurosciences,
Graduate School of Life Sciences,
Table of Contents
List of Figures List of Tables Dedication Acknowledgements SummaryChapter 1 Introduction Page # 1
1.1 Ultra-high pure (UHP) iron 6
1.2 Chemical Properties of UHP iron 8
Chapter 2 Materials & Methods 10
2.1 Materials used 11
2.2 Cell line used 11
2.3 MDCK/YFP Keratin 8 cell line growth on UHP iron surface 11 2.4 Preparation of growth Media for MDCK cells 12 2.5 C2C12 cell line passaging and growth 12 2.5.1 C2C12 cells differentiation analysis 13 2.5.2 Preparation of C2C12 differentiation medium 14 2.6 Mesenchymal stem cells (MSCs) passaging and growth 14 2.6.1 Preparation of growth media for Mesenchymal Stem Cells (MSCs) 15 2.6.2 Mesenchymal stem cells (MSCs) differentiation analysis 15 2.6.3 Preparation of differentiation medium for mesenchymal stem cells
(MSCs)
15
2.7 Preparation of iron solutions & treatment 16
2.8 Collagen interaction analysis 16
2.9 Calcein AM staining 16
2.10 Alizarin Red S staining 17
2.11 Colony forming assay 17
2.12 Scanning electron microscopy analysis (SEM) 17
2.13 Gene expression analysis 18
2.13.1 Sequence of the primers used for qRT_PCR 18
Chapter 3 Results 19 3.1 Analysis of MDCK/YFP keratin-8 cell line growth with UHP iron 20 3.2 Growth analysis of MDCK cells line with UHP iron and S45C steel 22 3.3 Comparison of UHP iron with commercially available implants 24 3.4 Comparison of UHP iron with the commercially available alloys by
SEM analysis
27
3.5 Gene expression analysis of MDCK cells treated with UHP iron plate and other metal plates
30
3.6 Effect of FeSO4 on the MDCK cells morphology 32
3.7 Gene Expression Analysis of MDCK cells after exposure to Fe2+ 35
3.8 MDCK cells growth using a thin coiled rod of UHP iron 38 3.9 Energy-Dispersive X-Ray spectroscopy (EDS) analysis of UHP iron 39 3.10 Energy-Dispersive X-Ray spectroscopy (EDS) analysis of Co-Cr-Mo
alloy and Ti-6Al-4V alloy
43
3.11 Surface analysis of metal plate through SEM 48 3.12 MDCK cells on the surface of other metal plates 48 3.13 C2C12 proliferation and differentiation analysis with UHP iron 50 3.14 Scanning electron microscopy analysis of C2C12 cell line 52 3.15 C2C12 cell proliferation and differentiation analysis using other iron
plates
53
3.15 Osteogenic differentiation analysis 57 3.17 Mesenchymal stem cells (MSCs) growth and differentiation using
other Fe plates 58 3.18 Collagen analysis 60 Chapter 5 Discussion 61 Conclusion 68 References 70
List of Figures
Sr. # Title Page #
Figure 1 Ultra-high-pure iron (10 kg) of higher than 99.9989 mass % 7 Figure 2 Corrosion experiment in hydrochloric acid (HCl) 9 Figure 3 Corrosion experiment in Copper Sulphate solution (pH 5, after 5 h) 9 Figure 4 MDCK/YFP Keratin-8 cells cultured for three days on the UHP iron 21 Figure 5 (a) MDCK/YFP keratin 8 cells were cultured with UHP iron and a
commercial pure steel (S45C) plate for 3 days (b) Concentration of Fe ion in the growth medium
23
Figure 6 (a) Live image of MDCK-YFP-keratin-8 cells cultured for 3 days after inoculation
(b) Cell confluence was measured on culture dish C.D. and each metal plate by fluorescent microscopy (means ± SD, n = 5). Data with the same letter was not significantly different at the 5% level.
25,26
Figure 7 SEM morphological analysis of the MDCK-YFP-keratin-8 cell line on the surface of each metal plate.
28,29
Figure 8 Shows the relative expression level of the selected gene UHP iron and commercially available alloys
31,32
Figure 9 (a) Upper panel shows the images of MDCK cell with different Fe2+ concentration
(b) Data with the same letter was not significantly different at the 5% level
33,34
Figure 10 Shows the relative expression level of the selected gene for FeSO4 37
Figure 11 Culture of MDCK cells on thin coiled wire made of UHP iron. 38 Figure 12 EDS analysis of UHP iron surface 3 days after culturing MDCK/YFP
keratin-8 cells
42
Figure 13 EDS analysis of the surface of a Cr-Co-Mo alloy plate after 3days of culture of MDCK-YFP-keratin-8 cells
45
Figure 14 EDS analysis of the surface of a Ti-6Al-4V alloy plate after 3 days of culture of MDCK-YFP-keratin-8 cells.
Figure 14 Scanning electron microscopy analysis of each metal surface 48 Figure 15 Shows the growth of MDCK cell on the surface of commercially
available metals
49
Figure 16 Flourescence micrscopy images of C2C12 cell line 51 Figure 17 SEM analysis of C2C12 cell on the surface of UHP iron 52 Figure 18 (i) C2C12 Cells growth (3 days) and differentiation analysis (5 days)
using SHP-HA-AR plate and Fe-N plate
(ii) Shows the growth and differentiation of C2C12 cells line with Fe-N
54-56
Figure 19 Alizarin Red S staining of MSC cells with UHP iron 57 Figure 20 Alizarin Red S staining of MSC cells in culture dish 58 Figure 21 Alizarin Red S staining of MSC cells after 19 days with other metal 59 Figure 22 In vitro collagen binding on UHP iron plate.
(a) After soaking 0.01 mg/ml FITC-labelled collagen solution, FITC fluorescence on surface of slide glass, Ti-6Al-4V, and ABIKO iron plates were visualized with a fluorescent stereo microscopy.
(b) FITC intensity was quantified by Image J software (+SD, n = 5). Data with the different letter significantly differed at the 5% level.
61
List of Tables
Sr. # Title Page #
Table 1 Preparation of growth media for MDCK/YFP Keratin-8 12 Table 2 Preparation of C2C12 differentiation medium 14 Table 3 Preparation of growth media for mesenchymal stem cells (MSCs) 15 Table 4 Preparation of differentiation medium for mesenchymal stem cells (MSCs) 15 Table 5 Sequence of the primers used for qRT_PCR for coding of the following
genes
DEDICATION
Dedicated to
my father
Nasrullah Khan (Late)
&
my brother
ACKNOWLEDGEMENTS
First and foremost, I would like to thank Allah Almighty, the creator of this universe, for providing me with the strength, knowledge, ability and opportunity to carry out this research study and to continue and complete it adequately. Without his blessings, this success would not be possible.
I would like to express my sincere gratitude and heartiest thanks to my supervisor Professor Dr. Atsushi Higashitani, Graduate School of Life Sciences, Tohoku University, Japan, for the continuous support of my doctoral research, constructive criticism, valuable suggestions, sympathetic attitude and ever inspiring guidance throughout the progress of this research and writing up of the thesis. I could not have imagined having a better supervisor and mentor for my doctoral study.
I am sincerely thankful to Dr. Mika Teranishi, Assistant Professor, Graduate School of Life Sciences, Tohoku University, Japan, for her generous assistance and coordination, helpful behaviour, nice suggestion, kind-heartedness and inspiring guidance.
I am also thankful to the Associate Professors Dr. Jun Hidema and Dr. Shushei Sato and Assistant Professor Yasukazu Daigaku for their valuable suggestions during my progress reports. I have great pleasure in acknowledging my gratitude to my colleagues and fellow research scholars as well at the Molecular Genetics and Physiology Laboratory, Graduate School of Life Sciences, Tohoku University, for their support and motivation during my research.
Last but not least, I would like to thank my family specially my loving sisters for supporting me spiritually throughout my educational period and my life in general. This journey would not have been possible without the support of my family, professors and mentors, and of course friends.
Introduction
Metallic biomaterials are commonly used to replace the bones, joints, and dental roots of the human body. When they are implanted inside a body, metallic biomaterials may corrode and discharging metal ions and debris that may have toxic effect on tissues and organs. It is essential for biomaterials to have no toxicity to a living body, and a controlled and measureable evaluation of the cytotoxicity of metallic components is essential for the development of new metal biomaterials with better biocompatibility. Iron (Fe) is the most abundant transition metal in the human body, about 4-5 g. Like hemoglobin, it is essential for the catalytic center of several enzymes involved in electron transfer and DNA metabolism.
However, excess Fe2+ ions react with hydrogen peroxide to produce reactive oxygen
species.Conventional pure iron is more easily corroded and produces Fe2+ ions. In response to these problem, a new metal has been designed called ultra-high pure iron, which is purified up to 99.9996% by mass purity. In this study I used the ultra-high pure (UHP) iron to analyzed the biosafety & biocompatibility by using the mammalian cells lines.
Results
Analysis of Madin-Darby Canine Kidney (MDCK) YFP-keratin-8 cells line growth
Cell growth and adhesion on UHP iron surface was examined using MDCK/YFP-keratin-8 cell line and culture for 3 days in 35 mm culture dish with UHP iron in DMEM media at 370C in 5% humidified CO2 incubator. On the third day, cell proliferation was analyzed on the surface of UHP
iron and in the culture dish area using a fluorescence microscope. Interestingly, a large number of cells were grown on the surface of UHP iron and the culture dish area.
Growth of analysis of MDCK cell line with UHP iron and S45C steel
The growth of MDCK cells was compared using UHP iron and commercially available steel (S45C). I cultured MDCK cells for 3 days with ultra-high purity iron and S45C steel plates. Surprisingly, the cells did not grow on the surface of steel (S45C) and the surface of steel was highly corroded after three days in DMEM growth media. Abnormal morphology of cells grown in the culture dish area as well as on the S45C steel.
Concentration of Fe2+ after culturing MDCK cells for 3 days with UHP iron plates and S45C plates in growth medium (without cells)and only growth media (as a control). In the case of control, the concentration of iron was (0.0098) mmol/L, concentration of UHP iron was (0.0152) mmol/L, whereas in S45C steel, the concentration was (11.54) mmol/L respectively.
Cell growth comparison of UHP iron with current-day implants (i.e. Ti-6Al-4V and Co-Cr-Mo alloys)
To further illustrate the cells growth, commercially available metal implant alloys (i.e. Ti-6Al-4V and Co-Cr-Mo alloys) were used. Cells were cultured on each metal plate for 3 days. UHP promoted cell growth and adhesion. However, in the case of Ti and cobalt alloys, cell growth was much reduced compared to UHP iron. At the cobalt alloy surface, cell morphology was abnormal, and also cell proliferation was reduced in the surface as well as in the culture dish area. In the case of Ti alloy, cell proliferation was also reduced on the metal surface and in the culture dish area.
In order to quantitatively analyze the proliferation of the MDCK/YFP keratin-8 cell line, the confluency of MDCK cells with each metal plate was calculated. There was no significant difference in the confluency of UHP iron metal surface as well as plastic area with UHP iron as compared to the culture plate with no iron plate (control).
The number of cells adhered on commercially available medical metal implants was significantly less than UHP iron in all incubation periods and much lower proliferation was seen in the case of Ti-6A-4V. These results suggested that ultra-high purity iron is more compatible with cell growth. Effect of FeSO4 on the MDCK cells morphology
Fe2+ solutions were applied exogenously at different concentrations. MDCK cells were cultured
for 3 days. On 3rd day, I applied the Fe2+ at the different concentrations (i.e. 0.01 mmol/L, 0.1 mmol/L, 1 mmol/L and 5 mmol/L) and exposed the cells to the Fe2+ for 24 hours and analyzed with fluorescence microscope. Cell proliferation decreased as the concentration of Fe 2+ increased. Furthermore, cell morphology was also abnormal with a total Fe2+ concentration of 5 mmol/L, and an increase in the number of dead cells in the suspension medium was also seen with 5 mmol/L.
I also checked the confluence rate of the cells culture after exposing the MDCK cells to Fe2+ for 24 hours. There was a significant difference from 0.1 mmol/L to 5 mmol/L as compared to control.
C2C12 cells proliferation and differentiation
Next, UHP iron plates were used to analyze the proliferation and differentiation of the C2C12 cell line. C2C12 cells were cultured with UHP iron in culture dishes to examine cell proliferation and differentiation. On the third day, the growth of C2C12 cells was examined, and a considerable amount of cells were grown on the surface of UHP iron and the culture dish area. In addition, C2C12 cells differentiated significantly into myotubes on UHP iron surface. The results of scanning electron microscopy (SEM) further supported the growth and differentiation of C2C12 cells.
Cell viability was higher, and the cells exhibited well-spread morphology on the surface of UHP iron before and after C2C12 cell differentiation, establishing proper association with each other. Taken together, these results suggested that UHP iron is the best metal for myotube differentiation. Osteogenic differentiation analysis
Finally, mesenchymal stem cells (MSCs) were used to examine osteogenic differentiation. The MSC cell lines were cultured at a cell density of 5000 cm2 in 3 ml culture dishes. After the cells reached 50% confluence, the growth medium was replaced with osteogenic differentiation medium. Cells were stained with alizarin red S and observed osteogenic differentiation with UHP iron. In the case of the control sample (without iron plate), no calcification was observed after 3 days. At 21st day, calcification was found significantly on the surface of ultra-high purity iron and
in the area of the culture dish. Positive osteogenic cultures show stronger alizarin red staining, indicating that there is more calcification.
Conclusion
In conclusion, these results suggest the uniqueness of ultra-high pure iron, which allows not only adhesion and proliferation of mammalian cells but also osteocytes and Myotubes formation without surface coating compared to conventional biomaterials.These findings lead to the novel use of UHP iron as a therapeutic material in the continuously growing field of biomedical applications.
1 | P a g e
CHAPTER # 1
INTRODUCTION
2 | P a g e
An implant is a therapeutic device prepared to exchange a misplaced biological structure, support a broken biological structure or to boost a prevailing biological structure. There are various types of implants available: ceramic implants, bioresorbable and biodegradable implants, metal implants. In order to guarantee the long-term durability (lifetime) of implants implanted in the human body, materials for long-term biomedical implants have to be manufactured.
Metal alloys offer a global perspective for orthopaedic applications due to their excellent mechanical ability and flexibility. This is exceptional in contrast to polymers and ceramics. Permanent implants should contain neither toxic nor allergic elements (e.g., Al, V, Ni, Co) and should retain great corrosion and wear resistances. The proper structural and practical relationship between the living bone and the surface of the load bearing synthetic implant is also important. Treatment care materials are regularly improved and more accurate diagnostic techniques and more practical treatment management are proposed.t. Its importance is that people are living for a long time, growing in an aging population and clinically affecting every era of health maintenance Metallic biomaterials have a long history of several biomaterials. Stainless steel was originally used as an implant material in the medical field (Niinomi, 2002). Metals have been used as transplants for over 100 years (Hermawan et al., 2011).
Metallic materials are generally used as implants, and such metals must retain their properties that will allow them to function in the human or animal body (Sidambe, 2014). The demand for metallic materials in medicine and dental procedures is huge (Hanawa, 2002). Research has been conducted since long-term solid implants and prostheses made of such alloys (Dobrzańska-Danikiewicz et al., 2015). The cyto-compatibility of a biomaterial is particularly associated to chemical composition, the three-dimensional organization of the biomaterial plays a fundamental role in ensuring interaction with host cells (Meredith et al., 2007).
3 | P a g e
To be precise, surface topography of biomaterials (i.e., size, shape, and surface texture) is one of the most important factors that affect cell attachment, adhesion, proliferation, migration, and even differentiation (Marini et al., 2015). Cytotoxicity is often dependent on the ionization affinity of the metals used (Matsuno et al., 2001). Frequently used titanium and stainless steel implants along with presently approved bio-absorbable polymers have particular disadvantages in bone surgical treatment (Castellani et al., 2011).
In vitro cell biology has shown that cells can react to the shape of their environment (Dalby
et al., 2007). Materials for everlasting bio-medical implants must be prepare in order to assure the
durability of the implant after implantation into the human body (Hynowska et al., 2013). Stainless steels (Fe–Cr–(Ni) alloys), Co–Cr–Mo alloys, titanium alloy, Ti–6Al–4V and Ti–Ni shape retention alloys are used for bio-materials while nobel-metal-based alloys are used for dental materials because of their excellent corrosion resistance and flexibility (Hanawa, 2004). For above 7 decades, material researchers, orthopedic physicians, and related bio-engineers have persistent to discover the methods and means of eradicating or, at least, decreasing the frequency of bone implant catastrophes in humans (Webster and Ejiofor, 2004).
Orthopedic specialists, somehow blame the poor performance of these implants against inadequate bone integration between adjacent bones and the prosthesis (Webster and Ejiofor, 2004). Co-Cr-Mo hip prostheses have been used for more than 50 years due to their superior wear and corrosion resistance properties. A Co-Cr-Mo hip replacement is associated with long-term wear and tear through body fluids in vivo, resulting in the formation of tribological films, wear particles, and metal ions (McKee and Watson-Farrar, 1966; Wang et al., 2017).
4 | P a g e
Titanium implantations may be noticeable in the event of inactivity or when tissue weakening occurs (Möller et al., 2012). However, its use is limited, due to its low strength and excessive wear characteristics (Bhola et al., 2011; López et al., 2002). For most applications, including Ti6Al4V in bone cells is important for effective integration of the implant. For example, in the case of Ti6Al4V hip implants, the interface between bone cement and Ti6Al4V can be dropped by osteolysis which is caused by the interaction between the polyethylene cap and Co-Cr/Co polyethylene particles. That are produced as result of the interaction with polyethylene cap and Co‐Cr/Co‐Cr‐Mo or ceramic (ZrO2 or Al2O3) are used in current head hip implants (Dobbs and Scales, 1983; Martínez-Pérez et al., 2019; Soboyejo et al., 2002).
Disadvantages of titanium implants include the undesirable result of titanium being bright or that the observable metal is exposed by gingival stasis. Metallosis after transplantation of titanium transplantation may also be the result of a proinflammatory response, which may lead to loss of implants over time. In the case of dental implants, ceramic materials have been used significantly in orthopedic surgery for several years. Biocompatibility assessment resulted progressive results, while carcinogenicity and mutagenicity tests have revealed no negative results (Möller et al., 2012; Piconi and Maccauro, 1999). The success of biomaterials depends largely on the response of the human body to the implant, which determines the biocompatibility of the material (Geetha et al., 2009).
Iron is the most abundant transition metal in the body, an important micronutrient, and essential to many important biological processes. Although in excess, it can generate oxidative stress due to the generation of reactive oxygen species (ROS) (Puntarulo, 2005). The most nutritious individuals in the developed state have 4-5 grams of iron in their bodies (Gropper and Smith, 2012). Nearly two-thirds of iron in the body is contained in hemoglobin present in
5 | P a g e
circulating red blood cells (Abbaspour et al., 2014). The highest proportion of iron in the range of 65% to 75% is found in hemoglobin of red blood cells. When red blood cells reach the end of their life cycle, they are phagocytosed by reticuloendothelial macrophages (Andrews, 2000b).
It is important for various metabolic processes including oxygen transport, DNA synthesis and electron transport. Iron is essential for almost all living organisms, as it is an important catalytic center of iron-dependent enzymes and a central part of the heme moiety. Under normal circumstances, iron binds to ferritin in the redox inactive Fe3+ state, and small amounts of redox active Fe2+ iron are required to contribute to cell metabolism. Thus, all mechanisms involved in iron transport and homeostasis must be tightly regulated to prevent excess iron from cytotoxic reactions (Acosta-Cabronero et al., 2016). Proteins containing iron-sulfur (Fe-S) clusters are important for cellular events ranging from cytosolic regulation to mitochondrial metabolism and respiration to nuclear DNA repair (Lill, 2009; Tong and Rouault, 2000).
Moreover, Fe–S clusters are critical in permitting cells to sense intracellular iron, as in the example of iron regulatory protein 1 (IRP1), a sensor of intracellular iron levels, and the bacterial proteins SoxR and FNR, sensors of intracellular oxygen species (Tong and Rouault, 2000). The chemical adaptability of these clusters is used in basic life processes such as energy production, metabolic conversions, DNA maintenance, gene expression regulation, protein translation, and the antiviral reaction (Braymer and Lill, 2017; Lill et al., 2015). The Fe–S clusters has a unique role in DNA processing enzymes as well (Fuss et al., 2015).
Iron is required for almost all living things, but excess iron is still harmful. In the presence of ferrous ions, hydrogen peroxide undergoes a Fenton reaction to form highly reactive hydroxyl radicals (•OH). Radical reactions starting with OH can cause damage to macromolecules such as DNA, lipids and proteins (Grzelak et al., 2018). The most abundant mammalian heme proteins,
6 | P a g e
hemoglobin and myoglobin, act as oxygen carriers in erythropoiesis and muscle, respectively. Oxygen binding is facilitated by the heme moieties (O'Brien, 2011). Another important type of heme protein is cytochrome, which plays an important role in redox reactions and electron transport (Oliveira et al., 2014).
Fe2+ present in the cytosolic and mitochondrial matrix; the lysosome also comprises a pool
of redox-active iron stem from extracellular sources as well as the catabolism of ferritin and iron-rich intracellular organelles such as mitochondria (Dixon and Stockwell, 2014). When the absorbed iron does not bind to proteins, a large amount of toxic free radicals is formed. This completely affects iron concentration in mammalian cells and body fluids (Brissot et al., 2012).
Cell lines are widely used in metal toxicity studies. In vitro cell biology has shown that cells can respond to the shape of their environment (Dalby et al., 2007). To ensure the long life (durability) of the implant after it has been implanted in the human body, materials for permanent biomedical implants must be considered (Hynowska et al., 2013).
To overcome the disadvantages and the problems of the current day available implants, a new metal been designed called the Ultra-high pure iron.
1.1 Ultra-high pure (UHP) iron
Ultra-high pure (UHP) iron manufactured in a new induction melting furnace equipped with a cold copper crucible and manufactured with an ultra-high vacuum technology (Abiko et al., 1998). The UHP iron is purified more than 99.9996 % by mass by melting in an ultrahigh vacuum. The purification test in ultra-high vacuum was performed by means of the newly designed induction melting furnace and high-purity electrolytic iron. Ultra-high vacuum purification is very effective in reducing gaseous impurities, especially oxygen, in molten iron. The amount of gaseous impurities is almost the limit of detection by conventional analytical method.
7 | P a g e
A 10 kg ingot of ultrahigh-purity (UHP) iron, as shown (Figure 1), was melted in a cold copper crucible in a newly constructed induction-melting furnace using ultrahigh-vacuum machinery (Abiko et al. 1998). The key chamber was evacuated to a base pressure of 4108 Pa by an oil-distribution pump and a cold network. he ultra-high vacuum heating environment was viewed with a mass spectrometer, which was used to eliminate the vacuum refining process.
The electrolytic iron of 99.997 % mass purity was purified in an extremely high vacuum environment, and more than 99,989 % mass was purified. For example, almost all large-scale carbon, nitrogen, oxygen, and sulfur were reduced from about 17 mass ppm to about 5.4 mass ppm
8 | P a g e
1.2 Chemical properties of UHP iron
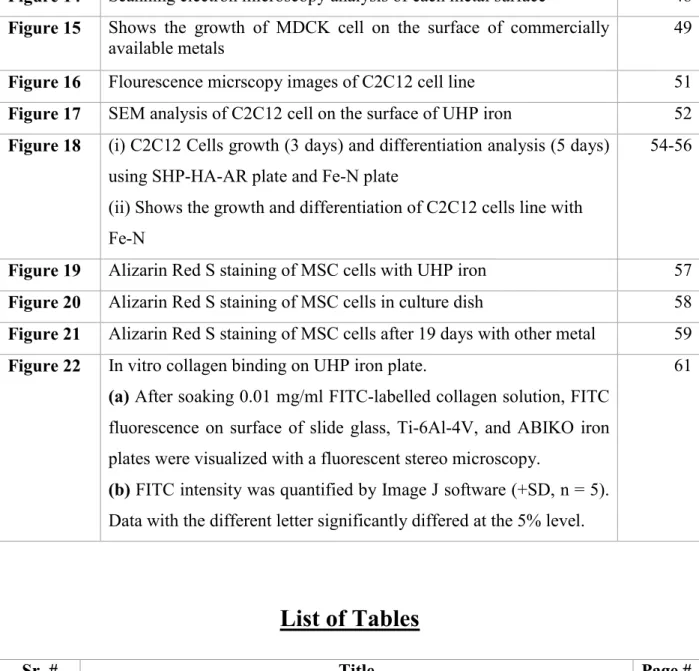
The chemistry of UHP iron is quite different from that of conventional pure iron. A comparison of the behavior of commercial (C) iron (the so-called “interstitial-free” iron, in which carbon and nitrogen have been scavenged by the addition of titanium in the form of precipitated carbo-nitrides) and the UHP iron, as shown in (Table 2), The hydrochloric acid and one copper Sulphate solution are shown (Figure 2, Figure 3).
As shown in Figure 2, the reaction rate in hydrochloric acid was indicated by the rate of hydrogen bubble formation, which was much faster for the C-iron, that the solution was immediately clouded, while in UHP iron this rate was very low.After 5 hours, at pH 5 copper sulfate solution (Figure 3), the C-iron surface coated with copper and the solution was discolored by iron ions.
However, in the case of UHP iron, no indication of a reaction can be seen at this time and longer. It is clear from these demonstrations that iron levels are extremely inefficient and highly inactive. The mechanism for understanding these trends on the iron ionization phenomenon should be investigated.
9 | P a g e
Figure 2: Corrosion experiment in hydrochloric acid.
Figure 3: Corrosion experiment in copper Sulphate solution (pH 5, after 5 h).
In this study, I used the ultra-high pure (UHP) iron to analyzed the biosafety & biocompatibility of this novel iron by using the mammalian cells lines.
10 | P a g e
CHAPTER # 2
11 | P a g e
2.1 Materials used
Ultra-high pure (UHP) iron, Ti-6Al-4V extra-low interstitial ELI (ASTM F136) and Co-Cr-Mo (ASTM F1537), super-high pure iron- as rolled (SHP-HA-AR), Fe-N2, S45C steel, SK-5M, SUS
304 and SUY-1, were used. These metals were rinsed carefully in 100% acetone and then
washed in 70% ethanol. After washing, the metal was dried on a clean bench and placed in a cell culture vessel (Greiner Bio-One 627 160 and 628 160, Tokyo/Japan).
2.2 CELL LINE USED
2.3 Madin Darby Canine Kidney cells line (MDCK/YFP Keratin-8) on UHP iron surface I examined cell proliferation and adhesion with UHP iron and the culture dish area using Madin-Darby canine kidney cells (MDCK/YFP Keratin-8).
First, remove the MDCK/YFP keratin-8 cells from the liquid nitrogen storage, thaw them in a 37° C water bath for less than 2 minutes, wipe them with 70% ethanol to sterilize them and quickly transfer the thawed cells into eppendorf tubes (5.0 mL) and added fresh growth media (Dulbecco's Minimum Essential Medium (DMEM)) high glucose, supplemented with 10% fetal bovine serum (FBS) (Thermo Fisher Scientific, MA/U.S.A.) and 1% Penicillin & Streptomycin (P/S) (Nacalai Tesque Inc., Kyoto/Japan), Gradually drop by drop and then mixed by pipetting to avoid osmotic pressure.
The tube was then centrifuged at 3000 rpm for 3 minutes. The supernatant was discarded and additional freshly warmed cell growth medium (about 7-8 mL) was added. The cells were then vortexed to mix the cells in freshly added media. The cells were diluted at 1:5 in 35mm culture dish and incubated for three days at 370C and 5% CO
2 humidified atmosphere. On the third day,
the suspension media was discarded and the surface of the cell layer was rinsed with 1mL cold D-PBS (without Ca2+ and Mg2+). D-PBS was replaced by Trypsin EDTA (1 mL) and mixed well.
12 | P a g e
Finally, fresh growth medium was added to stop trypsin digestion. The cells were aliquoted into two vials and centrifuged for 2 minutes at 3000 rpm.
The cell suspension was replaced by adding fresh DMEM medium and mixed with vortex. The mixed cell suspension was placed in culture dish plates with each metal sample and placed in a humidified atmosphere of 37 ° C. and 5% CO 2 for 3 days. At day 3, cells were analyzed by microscopy.
2.4 Table. 1: Preparation of growth media for MDCK/YFP keratin-8
Components Final conc. For 500 mL
DMEM high glucose medium 1x 450mL Fetal bovine serum (FBS) 10% 50mL Penicillin/streptomycin (P/S) 5 mL
2.5 C2C12 cells line passaging and growth
C2C12 cells were removed from the liquid nitrogen tank or -80 °C D-freezer and immediately placed in an ice box. The cells were thawed in a pre-heated water bath at 37 °C for less than 2 minutes. The thawed cryovial was sprayed with 70% ethanol and immediately transferred to a 15 mL falcon tube. Next, prewarmed growth medium (in DMEM high glucose medium (containing 10% FBS, 1% P/S) was added dropwise, after which it was mixed gently. The Falcon tube was then centrifuged at 1000 rpm for 5 minutes at room temperature to pellet the cells and pellet. The suspended was removed carefully by not disturbing the pellet at the bottom.
Fresh, prewarmed 7-8 mL of growth media was added to Falcon tubes and then vortexed until the pellet was completely dissolved in fresh media. Cells were diluted in 35 mm culture dishes (Greiner Bio-One 627 160 and 628 160, Tokyo/Japan) using fresh growth medium (1: 5) from the
13 | P a g e
original cell suspension and placed for three days at 370C and 5% CO2 humidified atmosphere. On
day 3, cells were removed from the incubator and the suspension medium was removed and washed once with 1 ml of cold 1 × D-PBS.
D-PBS was replaced with pre-warmed 1 ml of trypsin EDTA. Cell cultures were placed in a CO2 incubator for 2-3 minutes. Thereafter, 7-8 ml of freshly warmed growth medium was added
to the culture dishes and mixed well. The mixed cells were then transferred to a 15 ml Falcon tube and centrifuged at 1000 rpm for 5 minutes at room temperature. The tube was removed from the centrifuge and wiped with 70% ethanol. The suspension medium was carefully removed, fresh growth medium was added and mixed well using a vortex. Mixed cells were seeded at a density of 5000/cm 2/mL and placed in a humidified atmosphere at 37 °C and 5% CO2.
2.5.1 C2C12 cells line differentiation analysis
The C2C12 cells were cultured in DMEM high glucose media (with 10% FBS, 1% P/S) (SIGMA D5796). Cultured cells were transferred to fresh prewarmed growth medium when it was 70-80% confluent. The cells were harvested after confluence and 1 mL of trypsin was added to each culture dish and placed in a 37 °C incubator for 2-3 minutes. The trypsin was aspirated and fresh media was added followed by centrifugation at 3000 rpm for 5 minutes. Suspension medium was removed and fresh medium was again added and vortexed to mix pelleted cells.
Then, 5000cm2/mL cells suspension were added to each culture dish with iron plate (i.e. UHP). The samples were placed in a humidified atmosphere at 37 °C, 5% CO2 for 3 days. Usually,
on 3 days the culture has reached full density (> 80%). Growth medium was then removed from C2C12 cell cultures and washed with cold 1 × D-PBS. PBS was replaced with differentiation medium (DMEM high glucose plus glutamine containing 1% penicillin / streptomycin and horse serum, no sodium pyruvate).
14 | P a g e
Cells were fed every 24 hours for 5 days. On the fifth day, the medium was removed, 1 ml of calcein AM dye was added and placed in an incubator at 37 °C for 20-30 minutes. The cells were then observed under a microscope and images were taken.
2.5.2 Table. 2: Preparation of C2C12 cells differentiation medium
Components Final conc. For 500 mL
DMEM high glucose medium 1x 450 mL
Donor horse serum 2 % 10 mL
Penicillin/streptomycin (P/S) 1% 5 mL
2.6 Mesenchymal stem cells (MSCs) passaging and growth
Mesenchymal stem cells (MSC) cells were cultured in D-MEM/F-12 medium containing GlutaMAX-1, FBS, MSC certified (10%) and gentamycin (GIBCO mouse C57BL / 6, Invitrogen). The cells were cultured at a seeding density of 5000 cm2/mL. The cells were incubated for 3-5 minutes at 37 °C. The cell solution was pipetted to produce a homogenous suspension. The cells were transferred to a sterile Falcon tube and centrifuged at 3000 rpm for 5 minutes.
The supernatant was removed without disturbing the pellet and fresh preheated MSC growth medium was added. The cell suspension was transferred to a culture plate containing UHP iron plates and incubated at 37 °C.
15 | P a g e
2.6.1 Table. 3: Preparation of growth media for Mesenchymal Stem Cells (MSCs)
Components Final conc. For 500 mL
D-MEM/F-12 medium with GlutaMAX-1 1x 450mL
FBS,MSC-Qualified 10% 50mL
Gentamicin(10mg/mL) 5ug/L 250 uL
3.6.2 Mesenchymal Stem Cells (MSCs) differentiation analysis
MSCs cells were cultured in growth medium and placed in a humidified atmosphere of 37 °C and 5% CO2 using ultra-high purity iron plates. After reaching 50% confluence, MSC growth medium
was replaced with an equal volume of osteogenic differentiation medium (D-MEM/F-12 medium with GlutaMAX-1, stem cell pro-osteocytes differentiation basal medium, stem cell pro osteogenesis supplement and gentamicin)).
Cell cultures were kept in an incubator for 21 days. Osteogenic differentiation was replaced regularly every 24 hours. On day 21, the differentiation medium was replaced with alizarin red solution and placed on a shaker plate for at least 30 minutes at room temperature.
2.6.3 Table. 4: Preparation of differentiation medium for Mesenchymal Stem Cells (MSCs)
Components Final conc. For 500 mL
StemPro® Osteocytes differentiations medium 1x 90 mL StemPro® Osteogenic supplement 1x 10 mL Gentamicin(10mg/mL) 5ug/L 50 uL
16 | P a g e
2.7 Preparation of iron solutions & treatment
Iron sulfate was dissolved in deionized water and disinfected using a 0.22 μm filter. The solution was diluted with medium (1:20, v / v) to concentrations of 0.01, 0.1, 1, 5 mmol / L, respectively (He et al., 2008) . An appropriate number of cells were cultured for 3 days in a 35mm culture dish. The cells were then exposed to different concentrations of iron for 3 days. Cell cultures were harvested by washing once with cold PBS.
2.8 Collagen interaction analysis
To analyse affinity of collagen on the metal surface, the metal plate was soaked in 3 ml freshly diluted FITC labelled collagen solution (at final concentration of 0.01 mg/ml) with PBS (Bovine Type I collagen, Collagen Research Center, Japan) for 1 hour at room temperature. After rinsing the surface with distilled water, FITC intensity was monitored with a fluorescent stereo microscopy (Nikon). The intensity was calculated by Image J Fiji software.
2.9 Calcein AM staining
Calcein Am solution was used to stain the C2C12 cell line. Calcein AM solutions are used to label live cells that can be detected and analyzed by fluorescence imaging. In brief, the supernatant was removed from the cell culture and 1 mL of calcein Am solution was added to each well. The calcein Am solution is pre-diluted in a 1: 500 ratios with calcein dilution buffer. The cells were then incubated for 30 minutes at 37 °C. The cells were observed under a microscope.
17 | P a g e
2.10 Alizarin Red S staining
The anthraquinone dye Alizarin Red S (ARS) is widely used to assess calcification in cell culture. Briefly, cells were plated and processed for osteogenic differentiation as described. The medium was removed and the cells were gently washed 3 times with 1x D-PBS. MSC cells were fixed with 4% formaldehyde for 15 minutes at room temperature. The fixative was removed and the cells were washed 3 times with distilled water.
The distal water was then replaced with 1 mL of 40 mM Alizarin Red S per culture dish. The cell culture was incubated for 30 minutes at room temperature with gentle shaking. The dye was removed and washed 5 times with distal water.
2.11 Colony forming assay
Colony staining was performed by the crystal violet assay according to the method described by (Franken et al., 2006). Briefly, cells were cultured for 3 days at 10 cm for Fe2+. Cells were exposed to Fe2+ for 24 hours. Suspension medium was removed, cells were washed with cold 1x D-PBS, and 2-3 ml of colony-fixed staining solution was added to each culture dish at room temperature for at least 30 minutes. Next, the staining solution was removed, rinsed with a running tap water and soaked. Plates with colonies were air-dried at room temperature, and colonies were counted. 2.12 Scanning electron microscopy (SEM)
Culture cells on the metal surface were fixed with 2% glutaraldehyde in 30 mM HEPES–KOH (pH 7.5) for 60 min. After dehydration with a series of ethanol, the sample was dried in a CO2
critical point drier. The surface of the samples was coated with an osmium surface coating
(Meiwafosis Co. Ltd., Tokyo/Japan) for EDS quantification of light elements. The samples were analysed by field emission SEM with EDS (JSM-7800F, JEOL Ltd.
18 | P a g e
2.13 Gene expression analysis
The cells were cultured for three days, and the total RNA was isolated by Trizol reagent (Invitrogen). Real time quantitative PCR was performed with a PrimeScript II 1st strand cDNA synthesis Kit (TaKaRa Bio) and SYBER premix Ex Taq II, in a CFX96 Real-Time System (Bio-Rad Laboratories). Sequence specific primers were designed using Primer3plus. Expression of various genes was normalized by using GAPDH as a housekeeping gene (Table 1).
2.13.1 Table.5: Sequence of the primers used for qRT_PCR for coding of the following genes
No. Gene Symbol
Accession No. Forward Primer Reverse Primer Product size 1 GAPDH DQ403060.1 ATCACTGCCACCCAGAAGAC GGCAGGTCAGATCCACAACT 202bp 2 HSP70 AB114674.1 TGCTGAGGATCATCAACGAG GCTTGAACTCCTCCACGAAG 234bp 3 ATM NM_001130828.1 GAAGAAGGAACGGTGCTCAG GGTTAAAAACGAAGGCCACA 177 bp 4 SOD1 AB175611 AGTGGGCCTGTTGTGGTATC AGTCACATTGCCCAGGTCTC 189 5 IRBP-2 XM_532364 CCAGCGGAGTGTTACCGTAT AATTGGCACGAACACAATCA 198 bp
2.14 Statistical analysis
All experiments were performed at least in time for each biological sample and metal material. The sample size (n) is specified in the figure legend for all quantitative data. RStudio software (https://www.rstudio.com) was used to determine statistical significance. Statistical analysis was performed using one-way analysis of variance followed by Tukey post hoc test. The minimum p-value for significance was 0.05. A similar alphabet in any two groups indicates that it is not important, and a different alphabet in any two groups represents a significant difference between the two groups.
19 | P a g e
CHAPTER # 3
RESULTS
20 | P a g e
3.1 Analysis of Madin-Darby Canine Kidney (MDCK) YFP keratin-8 cell lines growth with UHP iron
To examine the biocompatibility of ultra-high pure iron, I initially examined the growth of cells on the surface of UHP iron, to check the effect of UHP iron on cell growth. I used the MDCK/YFP keratin-8 cell line. Because it is a GFP cell lines, so I could easily visualize the cell on the surface of metal.
Cells were grown for 3 days on UHP iron in 35 mm culture dishes in DMEM medium at 37°C in a 5% humidified CO2 incubator. On the third day, the growth of cells was analyzed using
fluorescence microscope on the UHP iron surface as well as in the culture dish surface.
Interestingly, the growth of MDCK cells was very high on the UHP iron surface and also in the culture dish area. The cells grew very well at the UHP iron surface and were confluent at both the UHP iron level and the culture dish area (Figure 4).
21 | P a g e
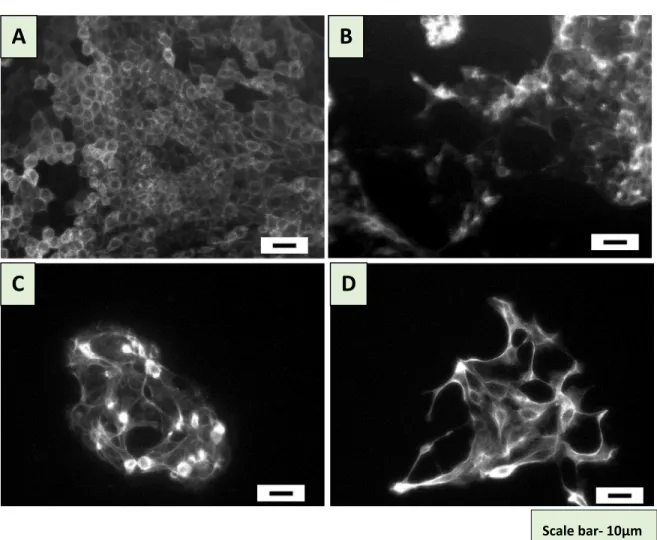
Figure 4: MDCK/YFP Kr-8 cells cultured for three days on the UHP iron. A, B) Live imaging on UHP iron plate. Scale bar- 20 μM.
C) Shows the fluorescence image of MDCK cells on the UHP iron plate surface D) Shows the culture dish area with UHP iron. Scale bar- 10 μM
A
C
D
B
22 | P a g e
3.2 Growth analysis of MDCK cells line with UHP iron & S45C Steel
For comparing UHP iron growth with commercial steel (S45C), I cultured MDCK cells with ultra-high purity (UHP) iron and commercial steel (S45C) for 3 days at 370C incubator.
The cells grew very well on the surface of UHP iron and in the culture dish area (Figure 5A and A’, B). Surprisingly, the cell did not grow on the surface of steel (S45C) and the surface of steel is highly corroded after three days in DMEM growth media (Figure 5 C and C’).
Cell morphology appeared abnormal in the culture dish area with S45C steel plate suggesting the release of toxic ions in the culture dish area (Figure 5D). These results clearly indicate the importance of UHP iron.
The Fe2+ concentration in the suspension medium was also measured. MMDCK cells were cultured with ultra-high purity iron metal plates and S45C metal plates in 35 mm culture dishes. On the third day, I collected media from these cultures. Growth medium (without metal plate) was used as control. In the case of control, the concentration of iron was 0.01520 mmol and UHP iron the concentration was 0.0098 mmol while in the case of S45C steel, the concentration was 6.66 mmol (table 6).
23 | P a g e
Figure 5: MDCK/YFP keratin 8 cells were cultured with UHP iron and a commercial pure steel (S45C) plate for 3 days.
(A) UHP iron plate surface (B) MDCK cells on UHP iron surface (3days) (C) Cells on the surface of culture dish (3days).
(D) Corrosion was observed on the S45C steel plate, (E) No cell grows on S45C surface, (D) S45C culture dish surface.
Table. 3.2.1: Shows the total ions concentration eluted in the growth media Sample Control (growth media) UHP iron S45C steel Concentration (mmol) 0.057 0.088 6.6
A
D
F
Scale bar- 10μmB
C
E
24 | P a g e
3.3 Comparison of UHP iron with commercially available implants (i.e. Ti-6Al-4V & Co-Cr-Mo alloys)
Commercial metal implant alloys (non-coated) were used to further explain the role of UHP iron in terms of cell growth. I compared cell growth with UHP iron to other current medical implants i.e. Ti-6Al-4V alloy and Co-Cr-Mo alloy. I used the MDCK/YFP keratin-8 cell line and cultured the cells with each metal plates i.e. UHP iron, Ti alloy and Cobalt alloy as well as in culture dish with no metal plate as control (Figure 6 A) for three days at 370C in 5% humidified CO2 incubator.
I examined the growth and attachment of cells with each metal alloy and the culture dish area. In the case of UHP iron, cell growth was clearly significant (Figure 6 B, C). However, in the case of commercially available metallic implants, cell growth was much lower than UHP iron. In the case of a cobalt alloy surface, the cell morphology was abnormal (Figure 6 D). Also, cell proliferation was reduced on the surface as well as in the culture dish area (Figure 6 E). In the case of Ti alloy, cell proliferation was also reduced in both the culture dish area and the metal surface (Figure 6 F, G).
In order to quantitatively analyze the proliferation of the MDCK / YFP keratin 8 cell line, the confluence of MDCK cells with each metal plate was measured (Figure 6b).
In the case of UHP iron metal surface and plastic area, there was no significant difference in confluency compared to the culture dish without iron plate (control). The number of cells attached to the commercially available metal implants was significantly lower than UHP iron in all incubation periods, and very low cell growth was observed with Ti-6A-4V. These results suggested that ultra-high purity (UHP) iron is more compatible with cell growth.
25 | P a g e
B
C
E
F
G
A
D
Scale bar- 10μm26 | P a g e
Figure 6: Live image of MDCK/YFP-keratin-8 cells cultured for 3 days after inoculation. (A) Control cells on culture dish surface (without metal plate).
(B) Cells on the surface of UHP iron metal surface.
(C) Cells on the surface of culture dish surface with UHP iron. (D) Cells on surface of Cr-Co-Mo alloy metal surface.
(E) Cells on the surface of culture dish surface with Cr-Co-Mo alloy. (F) Cells of the surface of Ti-6Al-4V alloy metal surface.
(G) Cells on the surface of culture dish surface with Ti-6Al-4V alloy.
(6b) Cell confluence was measured on culture dish C.D. and each metal plate by fluorescent microscopy (means ± SD, n = 5). Data with the same letter was not significantly different at the 5% level.
27 | P a g e
3.4 Comparison of UHP iron with commercial alloys by SEM analysis
Scanning electron microscopy was used to verify cell attachment and growth on the surface of commercially available metal implants (i.e., Cr-Co-Mo and Ti-6AL-4V) and ultra-high pure iron (UHP-iron). The MDCK cell line was used for these analyses. The differences in cell adhesion and morphology were characterized by SEM.
MDCK-YFP-keratin-8 cells were cultured on each metal plate. I first cultured MDCK cells (1: 5 dilution) for 3 days and then analyzed (Figure 7 A, B). Cell proliferation was very significant on the surface of UHP iron as well as the culture dish area containing UHP iron. However, due to the large number of cell growth at UHP iron surface, it was difficult to see cell attachment of cells on UHP iron surface.
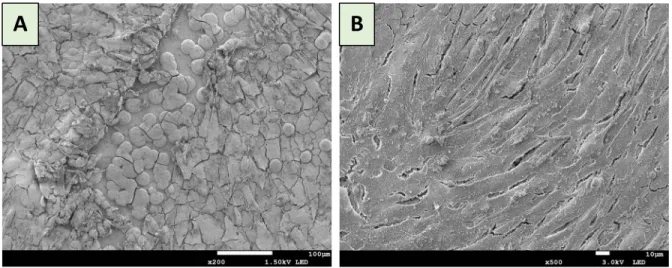
Next, the inoculated cells were diluted 4-fold (1:20), cultured for 3 days, and analyzed by SEM.Scanning electron microscopy of MDCK cells after 3 days of culture reveals better cell adhesion and morphology over a wide-spread coverage on ultra-high pure iron surfaces. Normal and isotropically proliferating cells with many filopodia are observed on UHP plates (Figure 7 C, D). In addition, thin films and dots were observed on the area of UHP iron (red arrows in Figure 7 D).
In contrast, with conventional metals such as Ti-6Al-4V and Co-Cr-Mo, the number of cells was much smaller and did not become confluent. Furthermore, in the case of cobalt alloy (Co-Cr-Mo), cell morphology was abnormal with anisotropic and abnormal lamellipodia formation (Figure 7 E, F) On the other hand, in the case of the Ti alloy (Ti-6Al-4V), many blebbles appeared as shown by the yellow circles (Figure 7 G, H).
Cell adhesion and growth showed better biocompatibility on the surface of ultra-high pure (UHP) iron metal compared to commercially available implants (i.e. Ti-6Al-4V and Co-Cr-Mo).
28 | P a g e
Considering Figure 7 (D), it has been suggested that cells cultured on the UHP iron surface is covered by numerous microvilli which stretched from the cells. Scanning electron micrograph also revealed the presence of filopodia in the cell boundaries, which were dispersed as anchor points on the surface of ultra-high pure iron.
A
B
29 | P a g e
Figure 7: SEM morphological analysis of the MDCK cells on the surface of each metal plate. (A) MDCK cells on the surface of UHP iron plate after three days’ culture (1:5 dilution), Scale bar-100 mm.
(B) High magnification of panel A, Scale bar-10 μm.
(C) MDCK cells on the surface of UHP iron plate after three days’ culture (1:20 dilution) Scale bar-100 mm.
(D) High magnification of panel C, Scale bar-10 μm
(E) MDCK cells on the surface of Cr-Co-Mo Plate, Scale bar-100 μm
(F) High magnification of panel E. Scale bar-10 μm
(G) MDCK cells on the surface of Ti-6AL-4V plate, Scale bar-100 μm.
(H) High magnification of panel G, Scale bar-10 μm. Green arrow represents blebbing, blue arrow indicating lamellipodia while Red Arrow mean that some of the collagen etc. is secreted.
E
F
30 | P a g e
3.5 Gene expression analysis of MDCK cells treated with UHP iron plate and other metal plates
The MDCK cells were treated with the ultra-high pure iron samples as well other commercially available metals for 3 days. RNA was extracted followed by cDNA synthesis. The CDNA was then subjected to the real time PCR analysis.
Gene involved in cellular Stress, DNA damage and cell cycle response
The expression levels of the selected genes were changed with each treated sample, as compared to the control group. The genes examined were chosen among those involved in cellular response to stress (HSP70 and MT2A), ROS detoxification (SOD1), DNA damage response ataxia telangiectasia-mutated (ATM) and iron-responsive element-binging protein 2 (IRP2).
Gene expression showed that the MDCK cells proliferated on UHP iron plate did not induce the stress response Heat shock protein 70 (HSP70) and Metallothionein-2A (MT2A) expression. However, in the case of Fe-N and S45C and SHP-HA-AR is upregulated. The HSP70 and MT2A showed the strongest induction in tested sample i.e. Fe-N and S45C respectively.
The superoxide dismutase 1 gene (SOD1) does not show any change with UHP iron sample whereas in the case of the other test samples shows up-regulation. Regulation of SOD genes plays an important role in balancing ROS concentration. Distribution and control of SODs at the expression and activity levels contribute to SOD levels and consequently to local ROS levels.
The level of ATM, a DNA damage responsive gene was highly upregulated as compared to the control and UHP iron sample.
Similar pattern can be seen in the case of iron regulatory protein2 where in the case of UHP iron and control no significant difference is observed, however, in the case of commercial steel and Fe-N highly upregulation is observed (Figure 8).
32 | P a g e
Figure 8: Shows the expression level of the selected gene
3.6 Effect of Fe2+ on the MDCK cells morphology
To further confirm the effect of iron ions, I applied Fe 2+ at different concentrations exogenously. MDCK cells were cultured for 3 days at 37°C in 35 mm culture dish in a 5% humidified CO2
incubator. On day 3, Fe2+ with the different concentration (i.e. 0.01 mmol/L, 0.1 mmol/L, 1 mmol/L and 5 mmol/L) and exposed to the Fe2+ for 24 hours. After the exposure to the Fe2+,cells were analyzed by fluorescence microscopy. Cell proliferation decreased as the concentration of Fe2+ increased.
In addition, cell morphology was also abnormal with an Fe2+ concentration of 5 mmol/L
(Figure 7E). In the case of 5 mmol/L, an increase in the number of dead cells in the suspension medium was observed. To confirm the proliferation of MDCK cells, the colonial confluency rate of the cells culture was examined after exposing MDCK cells to Fe2+ for 24hours. The confluency
was measured by Image J software and then analyzed through RStudio statistical software. There was a significant difference from 0.1 mmol/L to 5 mmol/L as compared to control (Figure 9 b).
33 | P a g e
A
B
C
D
E
34 | P a g e
Figure 9: Shows the images of MDCK cells with different Fe2+ concentration;
A) Control (B) 0.01 Mm/L (C) 0.1 Mm/L (D) 1 Mm/L (E) 5 Mmol/L
(7b) Quantitative analysis of cells confluency. Data with the same letter was not significantly different at the 5% level.
Concentration of FeSO4
35 | P a g e
3.7 Gene expression analysis of MDCK cells after exposure to Fe2+
After the exposure of MDCK/YFP keratin-8 cells to the Fe2+ ion for 24 hours, the expression levels of the selected genes were affected by the increasing the concentration, as compared to the control group. The genes examined were chosen among those involved in cellular response to stress (HSP70), DNA damage response (ATM), ROS detoxification (SOD1) and iron-responsive element-binging protein 2 (IRP2).
The following genes; Heat shock protein 70 (HSP70) and SOD1, and were upregulated in the higher concentration of Fe2+, the ataxia-telangiectasia mutated (ATM); was slightly downregulated in 0.01 mmol/l, but significantly upregulated at higher concentration of Fe2+. The iron-responsive element-binging protein 2 (IRP2) gene was highly upregulated with concentration dependant manner (Figure 10).
36 | P a g e
R
ela
tive Express
37 | P a g e
38 | P a g e
3.8 MDCK cells growth using a thin coiled rod of UHP iron
I analyzed the growth of MDCK cells using a very thin coiled rod of UHP iron. The UHP iron rod structure was placed in the cells culture for three days. On third day, only few cells were attached to the coiled UHP metal. Next, the coiled metal was transferred to fresh growth media (without cells) and cultured for further 5 days.
On 5th day, high number of cells were attached to the surface of UHP metal indicating that
the few cells that were attached after three days start proliferation in growth media and thus number of cell increased and covered almost all the metal surface. These results indicated that the UHP thin rod structure can be very useful in stenting phenomenon (Figure 11).
Figure 11: Culture of MDCK–YFP-keratin-8 cells on thin coiled wire made of UHP iron. (a) Thin coiled wire (0.5< mm diameter) made of UHP iron before use. (b) Cells on surface of UHP iron wire cultured for 3 days (yellow arrows). (c) Cells on surface of UHP iron wire cultured for additional 5 days. (d) Cells cultured for additional 5 days at the same magnification of panel b.
39 | P a g e
3.9 Energy-Dispersive X-ray spectroscopy (EDS) analysis of UHP iron
Energy dispersive X-ray analysis was performed. An analytical techniques used to study elemental analysis or chemical characterization of each sample/metal plate. EDS analysis showed the elements that are present on the UHP Iron surface after three days’ post-cultivation of MDCK/YFP Keratin 8 cell line.
The region of interest (R001); shows the elemental composition of MDCK cells attached area, which composed of high percentage of Carbon (C) 48.1 %, Nitrogen (N) 13.1 %, Oxygen (O) 30.2 %, Sodium (Na) 0.3 % and Iron (Fe) 8.4 %.
The ROI002; showing EDS analysis of area without cell attachment. Although, no cell attached here but still high percentage of Iron (Fe) and Oxygen (O) is present. It is very important characteristic of UHP iron releasing some of the organic materials like collagen etc.to promote cell proliferation which not observed in the case of commercially available alloys.
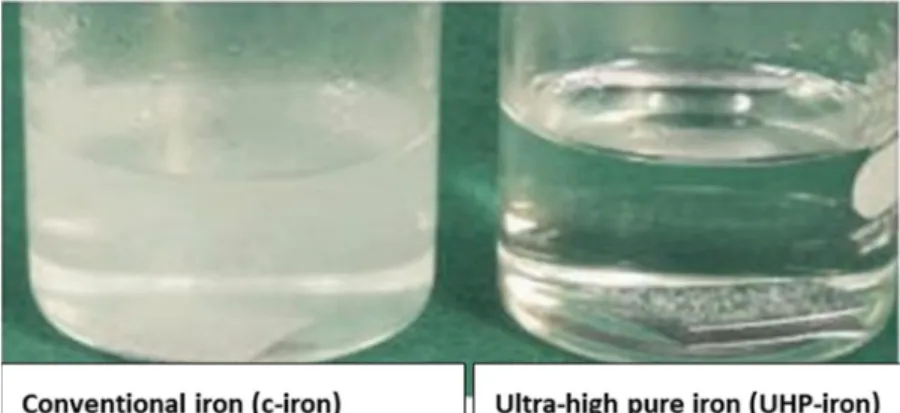
The region of interest (ROI-1); showing the EDS analysis of UHP iron back side where no cell attached and hence having higher percentage of iron (Fe) i.e. 92.3 % and low carbon i.e. 7.7 %.
40 | P a g e
ZAF method
Fitting coefficency : 0.1184
KeV Mass % σ atoms %
C 0.277 33.5 0.2 48.1 N 0.392 10.6 0.2 13.1 O 0.525 28.1 0.3 30.2 Na 1.041 0.4 0.0 0.3 Fe 0.705 27.4 0.6 8.4 Total 100.0 100.0 0.00 1.00 2.00 3.00 4.00 5.00 6.00 7.00 8.00 9.00 10.00 keV 001 0 1000 2000 3000 4000 5000 6000 7000 8000 9000 10000 11000 Counts CKa NKa OKa NaKa FeLl FeLa Fe Ka FeKb OsMz OsMa OsMb OsMr OsLl OsLa
ROI 001
B
41 | P a g e
ZAF method
Fitting coefficency : 0.0517
KeV Mass % σ atoms %
C 0.277 6.4 0.1 20.3 N 0.392 0.5 0.0 1.4 O 0.525 10.1 0.1 24.3 Na 1.041 0.1 0.0 0.2 Fe 0.705 0.0 0.5 52.6 Total 100.0 0.00 1.00 2.00 3.00 4.00 5.00 6.00 7.00 8.00 9.00 10.00 keV 002 0 1000 2000 3000 4000 5000 6000 7000 8000 9000 10000 11000 Counts CKa NKa OKa NaKa FeLl FeLa FeKa FeKb OsMz OsMa OsMb OsMr OsLl OsLa
ROI 002
C
42 | P a g e
ZAF method
Fitting coefficency : 0.0249
(keV) mass % σ atoms %
C 0.277 1.8 0.1 7.7
Fe 0.705 98.2 1.0 92.3
Total 100.0 100.0
Figure 12: EDS analysis of UHP iron surface 3 days after culturing MDCK/YFP keratin 8 cells.
(A) MDCK–YFP-keratin-8 cells on the surface of UHP iron after three days. (B) EDS analysis of UHP iron plate area where cell attached
(C) EDS analysis of area without cell attached
(D) EDS analysis of area of backside on UHP iron plate without cell attached. Scale bar-50 m
0.00 0.80 1.60 2.40 3.20 4.00 4.80 5.60 6.40 7.20 8.00 keV 1 0 30 60 90 120 150 180 210 240 270 300 CPS CK a FeLl FeLa FeKa FeKb
D
43 | P a g e
3.10 Energy-Dispersive X-ray spectroscopy (EDS) analysis of Co-Cr-Mo alloy and Ti-6Al-4V alloy
Furthermore, to compare the elemental composition with that of UHP iron, commercially available alloys, namely Co-Cr-Mo alloy and Ti-6Al-4V alloy, were analyzed. Surprisingly, in the case of Co-Cr-Mo alloy, the area where no cell attached (ROI-1), no Oxygen (O) and Nitrogen (N) were present unlike UHP iron. Furthermore, no release of organic matter was found on the surface of this alloy (Figure 12).
Moreover, in the case of the Ti-6Al-4V alloy, nitrogen (N) was not present in the area to which cells were not attached after 3 days of culture of MDCK cells, although in the area where cells were attached the Carbon, Nitrogen and Oxygen were present like UHP iron (Figure 13).
However, no secretion of organic matter was observed on the surface of Ti-6Al-4V, which was present in the case of UHP iron plate. These results suggested that ultra-high pure (UHP) iron has strong biocompatibility and bioavailability to be used as an implant.
Scale bar- 50 μm
44 | P a g e
ZAF method
Fitting coefficency : 0.0250
KeV Mass % σ atoms %
C 0.277 49.4 0.2 58.6 N 0.392 16.3 0.3 16.5 O 0.525 24.0 0.3 21.3 Na 1.04 1.2 0.0 0.7 Si 1.739 0.3 0.0 0.1 P 2.013 1.3 0.1 0.6 S 2.307 1.1 0.0 0.5 Cr ND ND Co 0.776 6.5 0.2 1.6 Total 100 100.0 0.00 0.80 1.60 2.40 3.20 4.00 4.80 5.60 6.40 7.20 8.00 keV 1 0 30 60 90 120 150 180 210 240 270 300 CPS CKa SiKa CrLl CrL a CrKa CrKb CoLl CoL a CoKa CoKb MoLl MoLa MoLb OsMz OsMa OsMb OsMr
B
45 | P a g e
ZAF method
Fitting coefficiency : 0.0906
(keV) mass % σ atoms %
C 0.277 2.4 0.0 10.5 Si 1.739 1.0 0.0 1.9 Cr 0.573 25.8 0.4 26.2 Co 0.776 65.2 0.4 58.3 Mo 2.293 5.5 0.1 3.0 Total 100.0 100.0
Figure 13: EDS analysis of the surface of a Co-Cr-Mo alloy plate after 3days of culture of MDCK–YFP-keratin-8 cells.
(A) MDCK–YFP-keratin-8 cells on the surface of Co-Cr-Mo alloy (B) EDS analysis of area without cell attached
(C) EDS analysis of area of cell attached, Scale bar- 0.5 m
0.00 0.80 1.60 2.40 3.20 4.00 4.80 5.60 6.40 7.20 8.00 keV 2 0 30 60 90 120 150 180 210 240 270 300 CPS CKa NKa OKa Na Ka SiKa PK a SKa CrLl CrL a Cr Ka CrKb CoL l CoL a CoK a Co Kb OsMz OsM aOsM b OsL l
C
46 | P a g e
ZAF method
Fitting coefficiency : 0.0906
(keV) mass % σ atoms %
C 0.277 50.4 0.2 57.3 N 0.392 19.4 0.3 18.9 O 0.525 25.2 0.3 21.5 Na 1.041 1.7 0.0 1.0 P 2.013 1.4 0.1 0.6 S 2.307 1.0 0.0 0.4 Ti 4.508 1.0 0.1 0.3 Total 100 100.0 0.00 0.80 1.60 2.40 3.20 4.00 4.80 5.60 6.40 7.20 8.00 keV 1 0 30 60 90 120 150 180 210 240 270 300 CPS CKa OKa NaKa MgKa AlKa SiKa CaKa TiLl TiLa TiKa TiKb OsMz OsMa
A
B
47 | P a g e
ZAF method
Fitting coefficiency : 0.0906
(KeV) mass % σ atoms %
C 0.277 3.3 0.0 8.5 O 0.525 17.9 0.2 34.4 Na 1.041 1.7 0.0 2.3 Mg 1.253 0.4 0.0 0.5 Al 1.486 4.2 0.1 4.8 Si 1.739 6.4 0.1 7.0 Ca 3.690 1.0 0.1 0.8 Ti 4.508 65.1 0.5 41.8 Total 100 100.0
Figure 14: EDS analysis of the surface of a Ti-6Al-4V alloy plate after 3 days of culture of MDCK–YFP-keratin-8 cells.
(A) MDCK–YFP-keratin-8 cells on the surface of Ti-6Al-4V alloy (B) EDS analysis of area without cell attached
(C) EDS analysis of area of cell attached, Scale bar- 200 m.
0.00 0.80 1.60 2.40 3.20 4.00 4.80 5.60 6.40 7.20 8.00 keV 2 0 30 60 90 120 150 180 210 240 270 300 CPS CKa NKa OKa NaKa PKa SKa TiLl TiLa TiKa OsMz OsMa OsM b
C
48 | P a g e
3.11 Surface analysis of metal plates through SEM
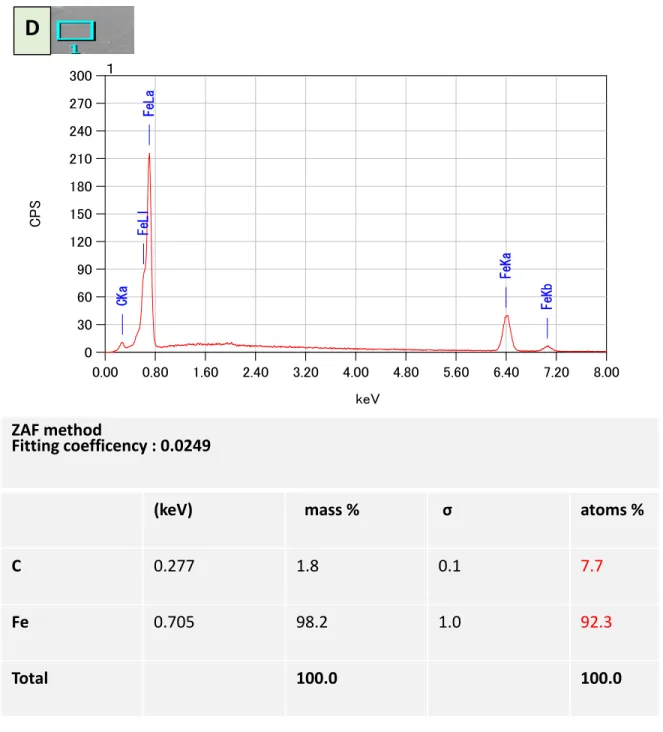
I also analyzed the surface morphologies of each metal plate. In the case of ultra-high pure (UHP) iron the surface was very smooth and shiny (Figure 15 A), while the surface of Co-Mo-Mo alloy seemed a bit rough (Figure 15 B) and the surface of Ti-6Al-4V was the roughest (Figure 15 C) among all of these metals plate.
Figure 15: Scanning electron microscopy analysis of each metal surface (A) Surface of UHP iron
(B) Surface of Co-Cr-Mo alloy (C) Surface of Ti-6Al-4V alloy
3.12 MDCK cells on the surface of other metal plates
The growth of MDCK cells was checked on the surface of other metal plates and in culture dishes. MDCK/YFP keratin 8 cells were cultured in a 35 mm culture dish plate at 37 °C in a humidified atmosphere of 5% CO2 for 3 days. I used the following metals and steel that are commercially
available; SK-5M, SUY-1 and SUS304, respectively. In the case of SK-5M, which is a normal
10 m
49 | P a g e
iron plate (not UHP iron), MDCK cells growth is weak, and the cells on the surface of the culture dish plate are also filamentous like aberrant morphology (Figure 16B).
In addition, I analyzed the growth of cells with SUY-1 and SUS-304, which is a stainless steel plate. In the case of stainless steel, cell growth was arrested by toxic ions generated from these stainless steels in both the surface and culture areas (Figure 16C and D).
Figure 16: Shows the growth of MDCK cells with commercially available implants (A) Control (B) SK-5M (C) SUY-1 (D) SUS-304.
SK-5M normal iron plate, cells did not grow at all on the metal surface & also shows abnormal cell morphology in the outside surrounding area of culture dish. SUY-1 and SUS-304; stainless steel, cells are observed on these metal plate surface are abnormal in morphology.
A
B
C
D
50 | P a g e
3.13 C2C12 proliferation and differentiation analysis with UHP iron
To further illustrate the biocompatibility of ultra-high pure iron, I analyzed the C2C12 differentiation. The C2C12 cells line was used, cultured for 3 days in growth medium, and then the growth medium was replaced with differentiation medium at 37°C. I changed the differentiation medium every 24 hours for 5 consecutive days.
First, the C2C12 cells line was cultured for 3 days using ultra-high pure iron to confirm proliferation. On the third day, C2C12 cells were stained with Calcein AM solution and analyzed cell growth with UHP iron surface and culture dish growth. Interestingly, the growth of C2C12 cells was significant in both cases (Figure 16 A and C). To confirm myotube differentiation analysis, cells were cultured in growth medium for 3 days and after reaching confluence (i.e. > 80% of confluence), growth medium was replaced with differentiation medium for 5 days.
On the 5th day, C2C12 cells were stained with calcein AM solution to analyze myotube differentiation on the surface of UHP iron and in the culture dish area. Interestingly, multiple layers of elongated C2C12 cells were observed with UHP iron surface (Figure 16 B).
Moreover, in the culture dish area also significant differentiation of myotubes were observed (Figure 16 D). These results clearly suggesting that the ultra-high pure (UHP) showed a striking behaviour toward myotubes formation.
51 | P a g e
Figure 16: Flourescence micrscopy images of C2C12 cells line.
(A) Shows the C2C12 cell proliferation after 3 days on the surface of UHP iron surface
(B) Shows myotubes differentiation on the surface of UHP iron after 5 days. (C) Shows the C2C12 cells line proliferation after 3 days in the culture dish area
(D) Myotubes differentiation in the culture dish area after 5 days.
A
B
C
D
52 | P a g e
3.14 Scanning electron microscopy (SEM) analysis of C2C12 cells line
SEM analysis further confirmed the growth and differentiation of the C2C12 cells line on the surface of ultra high pure iron. Scanning electron microscopy results further support C2C12 cells growth and differentiation. C2C12 cells were cultured in a growth medium at 37°C. for 3 days in a 5% humidified CO2 incubator. On day 3, cells were fixed with 2% glutaraldehyde in 30 mM
HEPES-KOH (PH 7.5) for 60 minutes. After dehydration with the ethanol series, the sample was dried with a CO2 critical point dryer and analyzed by SEM. Surface cells grew very well and were
highly confluent (FIG. 17A).
Similarly, C2C12 cells were cultured in growth medium for 3 days, and the growth medium was replaced with myogenic differentiation medium on day 3. The cultured cells were placed in a CO2 incubator for 5 days, and the differentiation medium was changed every 24 hours for 5 days.
On day 5, cells were fixed as described above and analyzed with SEM microscope (Figure 17B).
Figure 17: SEM analysis of C2C12 cells on the surface of UHP-iron.
A) C2C12 cells on the surface of UHP iron after 3 days’ culture. Scale bar- 100 μm.
(B) C2C12 cells on the surface of UHP iron plate SEM after 5 days’ differentiation, multilayers of elongated C2C12 cells on UHP iron surface. Scale bar- 10 μm.
B
A
53 | P a g e
3.15 C2C12 cells proliferation and differentiation analysis using other iron plates
I used commercial iron such as Fe-N and low-purity iron such as super-high pure iron (SHP-HA-AR). The growth of the C2C12 cells line was analyzed before and after differentiation. C2C12 cells were cultured in a growth medium at 37°C for 3 days in a 5% humidified CO2 incubator and
examined for growth on the surface of the plate. These iron plates were also used to analyze myotube differentiation (18 [i]).
In the case of SHP-HA-AR iron (HA-AR; hydrogen annealing as rolling), cell growth was also significant on the surface in the culture dish area. Furthermore, C2C12 differentiation was found to be significant in both cases (ie, metal surface and culture dish surface). Similar results were seen when Fe-N plates were used, with good cell growth and differentiation (Figure 18 [ii]).