JAIST Repository
https://dspace.jaist.ac.jp/
Title
Study on relationship between warmness of speech
and valence, activation or dominance
Author(s)
Miyagawa, Natsumi; Akagi, Masato
Citation
2020 RISP International Workshop on Nonlinear
Circuits, Communications and Signal Processing
(NCSP 2020): 299-302
Issue Date
2020-02-20
Type
Conference Paper
Text version
publisher
URL
http://hdl.handle.net/10119/16232
Rights
Copyright (C) 2020 Research Institute of Signal
Processing Japan. Natsumi Miyagawa and Masato
Akagi, 2020 RISP International Workshop on
Nonlinear Circuits, Communications and Signal
Processing (NCSP 2020), 2020, pp.299-302.
Description
Study on relationship between warmness of speech and valence, activation or dominance
Natsumi Miyagawa and Masato Akagi
Japan Advanced Institute of Science and Technology 1-1 Asahidai, Nomi, Ishikawa 923-1292 JAPAN
E-mail: {s1810178, akagi}@jaist.ac.jp
Abstract
To communicate a robot with a warm voice like humans, it is necessary to understand the characteristics of the warm voice of humans. However, these are not explained clearly yet. In this study, we examined warm voices based on the idea of a multilayer model. We carried out three listening experiments evaluation experiment for warmness for the first layer, evaluation experiment of valence, activation, and dominance for the second layer, and evaluation experiment of semantic primitive for the third layer. Then we examined relationships between the layers of the model. As a result, it was found that the warm voice had a strong positive correlation with Valence. When dominance ratings were low or high, the warmness rating was low. If the dominance rating was close to 0, the warmness rating was high. Moreover, the warm voice had a high positive correlation with Bright and a high negative correlation with Dark, Low and Heavy.
1. Introduction
Currently, the proportion of elderly people is increasing in Japan. The use of communication robots in medical care settings is thus desired due to the shortage of human resources. However, communication robots currently only have inorganic voices, causing many people to distrust them. To make the robots trustier, the voice quality of synthesized speech for the robot should be improved.
Interpersonal communication also conveys personality information and non-verbal information. Especially, the voice quality of speech is an important clue for impressive evaluation. However, there are few examples that describe psychologically and physically how medical care workers speak to patients and what voice quality is suitable for them. In order to reassure patients, caregivers and nurses are expected to be able to speak with warm voices to their patients.
The purpose of this study is to explain psychological characteristics of warm voices.
2. Multi-layer model of warm voice
We assume that variations in warmness ware influenced by the way of expressing the voice. Thus, we examined variations in voices for emotional expression databases, because emotional voices are typically and widely expressed voices
Based on the multi-layer model for emotion perception, a model for perceiving warm voice is constructed to explain warmness. On emotion perception, Huang and Akagi [1] examined the correspondence between emotion categories and semantic primitives (SPs) and found 17 optimal adjectives. Liu et al [2] examined correspondence between valence (V), activation (A) and SPs and determined twenty-eight optimal adjectives. As a result, it was shown that the 17 adjectives introduced by Huang and Akagi [1] are included in the 28 adjectives. Elbarougy and Akagi [3] examined correspondence between the 17 semantic primitives and 16 acoustic features introduced by Huang and Akagi and examined high correlations between them.
Following these studies, this study investigates relationships between warmness and emotion dimensions (V, A and Dominance (D)) and the 17 SPs introduced by Huang and Akagi [1] and defines the warm voice by constructing a multilayer model as shown in Fig. 1. Evaluation experiments are performed to construct a multi-layer model. To construct the first layer, we conduct an experiment to evaluate warmness. Experiments to evaluate V, A and D are performed to investigate relationships between the first and second layers. Evaluation experiments on SPs are performed to investigate relationships between the second and third layers. We describe the methodology of these experiments in the next section.
Figure 1: multi-layer model of warm voice
2020 RISP International Workshop on Nonlinear Circuits, Communications and Signal Processing (NCSP 2020) Honolulu, Hawaii, USA, February 28 - March 2, 2020
3. Methodology
The experimental procedures are shown below. First, an experiment to evaluate the warmness is performed to construct the first layer. To examine relationships between the first and the second layers, we conduct evaluation experiments on V, A and D and examine the correlation between warmness and the emotion dimensions. To examine relationships between the second and third layers, we conduct evaluation experiments on SPs and examine the correlation between emotion dimensions and semantic primitives. Furthermore, referring to these results and the report of Elbarougy and Akagi [3], relationships between the third and fourth layers are considered, and the acoustic features concerning with the SPs are discussed.
3.1 Evaluation experiment for warm
The purpose of this experiment is to evaluate impressions of warm for the first layer in the model. Owing to compare various expression methods, we focused on differences in emotional expression.
3.1.1 Stimuli
Emotional voices recorded in JAIST-ESD emotional speech database were adopted. The speakers were five females who were teachers and students in the same voice actor training school, with different training periods. The word for utterances was /oniichan/( お 兄 ち ゃ ん ). Emotion categories are seven, "joy, anger, sadness, surprise, disgust, and relaxation", and each emotion is expressed in three levels "slight, normal, and very". The experiment is performed using 110 voices with neutral ((7 types x 3 levels + neutral) x 5 speakers).
3.1.2 Experiment procedure
We asked 10 native Japanese (7 males and 3 females) as listeners to evaluate warmness. In the experiment, 110 stimuli were presented randomly. Evaluation was performed on a scale of 0 to 4.0 from "not warm at all" to "extremely warm". The experiment was done in a soundproof room using a PC (Windows 10, MATLAB) and headphones (AKG K272 HD).
3.1.3 Results
The evaluation value of warmness of neutral voice of each speaker was shown in Table1. The average value of the warmness evaluation was shown in Table 2 and the histograms in Figure 2. As the histogram for each speaker, evaluation values on warmness differs depending on the
emotion. Regarding the feelings of "joy" and "relax", warmness was highly evaluated for all speakers. The feelings of "anger" and "disgust" were evaluated for all speakers as low. However, Values of warmness were different among the speakers. In the case of Speaker1, the neutral speech had lower evaluation than that of the other speakers, and the overall evaluation was lower. Even positive emotions are difficult to evaluate as warm. Conversely, the voices of Speaker3 and Speaker5 have higher warmness value on neutral speech compared to that of other speakers, and the overall rating was higher. Also, warm values were higher on voices even with negative emotions. The results suggested that the impression of warmness differs depending on speakers as well as emotion categories.
Table 1: The evaluation value of warmness of neutral voice of each speaker
Speaker1 Speaker2 Speaker3 Speaker4 Speaker5
0.65 0.82 1.67 0.81 1.31
Table 2: The average value of the warmness evaluation of each speaker
Speaker1 Speaker2 Speaker3 Speaker4 Speaker5
1.00 1.19 1.47 1.38 1.71
Figure 2: Histogram of average value of warm evaluation
3.2 Evaluation experiment of valence, activation and dominance
The purpose of this experiment is to evaluate impressions of V, A and D for the second layer in the model. By examining the relationship between warmness
and V, warmness and A, warmness and D, relations between the upper layers of the multilayer model can be constructed.
3.2.1 Stimuli
Experimental stimuli used were the same as those described in 3.1.1.
3.2.2 Experiment procedure
The experiments for VAD evaluation were conducted with 10 native Japanese (seven males and three females) as listeners. The experiment was performed separately for each evaluation item. 110 stimuli were randomly presented in each session. Self-Assessment Manikin (SAM) [4] was used as an index of the axis of the VAD emotion space. V was performed on a scale of -2.0 to 2.0 from "very negative" to "very positive". V was performed on a scale of -2.0 to 2.0 from "very negative" to "very positive". A was performed on a scale of -2.0 to 2.0 from "very calm" to "very excited". D was performed on a scale of -2.0 to 2.0 from "very weak" to "very strong". The experiment was carried out in a soundproof room, and a PC (Windows 10, MATLAB) and headphones (AKG K272 HD).
3.2.3 Results
Figure 3 shows the relationship between warmness and V evaluations. The higher V ratings are, the higher the warmness ratings are. The correlation coefficient is 0.78, indicating a high positive correlation.
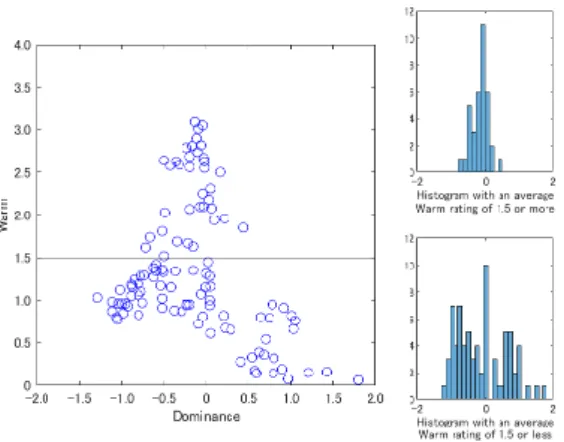
Figure 4 shows the relationship between warmness and D evaluations. The distributions are different when the average warmness score is higher or lower than 1.5. When the warmness value is higher than 1.5, D evaluation value converges to the center. When the evaluation of warmness is lower than 1.5, the evaluation value of D is dispersed. This suggests that, if D is too high or too low, we do not feel warmness.
Figure 5 shows the relationship between the evaluations of warmness and A. The correlation coefficient between values of A and warmth was 0.12. No relationship was obtained.
3.3 Evaluation experiment of semantic primitive
The purpose of this experiment is to evaluate semantic primitives (SPs). The middle part of the multilayer model was constructed by showing the relationships between V, A and D and SPs.
Figure 3: the relationship between the evaluation of warmth and the evaluation of valence
Figure 4: the relationship between the evaluation of warmth and the evaluation of dominance
Figure 5: the relationship between the evaluation of warmth and the evaluation of activation.
3.3.1 Stimuli
Based on the results of the warmness evaluation experiment, 17 voices with a high warmness rating, 18
voices with a low warmness rating, and 5 neutral voices were selected. A total of 40 stimuli were used.
3.3.2 Experiment procedure
Ten native Japanese (seven males and three females) were chosen as listeners. The evaluation items were the 17 adjectives (Bright, Dark, High, Low, Strong, Weak, Heavy, Sharp, Noisy, Quiet, Clam, Unstable, Clear, Well-modulated, Monotonous, Fast and Slow) introduced in the research of Huang and Akagi [1]. The experiment was divided into two sessions. In each session, seven to 10 SPs were evaluated. The stimuli were presented randomly. For each SP, 40 stimuli were evaluated on a five-point scale: 0-Dode not feel at all; 1-Seldom feels; 2-Feels a little; 3-Feels; 4-Feels very much. The experiment was performed in a soundproof room, and a PC (Windows 10, Matlab) and headphones (AKG K272 HD).
3.3.3 Results
The correlation coefficients (CC) between VAD and SPs were calculated, as shown in Table2. In the table, orange color indicates the high positive correlation and light blue indicates the high negative correlation. V has high positive correlations with Bright, while high negative correlations with Dark, Strong, and Heavy. A has high positive correlations with Unstable and Well-modulated. D has high positive correlations with Strong, Heavy, and Noisy. Considering the correlation coefficients between SP and warmness, it was found that there was a high positive correlation between warmness and Bright and that Dark, Low, and Heavy has a high negative correlation with warmness.
4. Discussion
The results so far have shown the relationship between the upper and middle layers of the multilayer model. Warm voice had a high correlation with V, and V had a high correlation with Bright. This revealed the materials that make up the warm voice multi-layer model. The relationship between the lower layers will be explained with reference to previous results and previous research. Elbarougy and Akagi [3] reports that Bright has a positive correlation with power range, the F0 contour, highest F0 and a negative correlation with the first formant frequency. Dark, Low and Heavy all showed opposite results. This shows that acoustic features such as the power range, the F0 contour, highest F0 and the formant frequency are correlated with warm voices.
5. Summary
This study discussed characteristics of warm voices using the concept of a multilayer model. We conducted three listening experiments, evaluation experiment for warm, evaluation experiment of V, A and D, and evaluation experiment of semantic primitive, and examined the relationship between each layer. As a result, it was found that the warm voice had a strong positive correlation with Bight and a strong negative correlation with Dark, Low and Heavy.
Table 3: 17 candidates for semantic primitives and CC
CC Valence Activation Dominance Warm
Bright 0.84 0.51 -0.61 0.83 Dark -0.82 -0.54 0.58 -0.82 High 0.52 0.64 -0.40 0.53 Low -0.68 -0.49 0.60 -0.72 Strong -0.75 0.46 0.87 -0.65 Weak 0.57 -0.35 -0.70 0.58 Heavy -0.79 -0.24 0.74 -0.78 Sharp -0.48 0.67 0.63 -0.42 Noisy -0.61 0.67 0.78 -0.51 Quiet 0.49 -0.54 -0.65 0.54 Clam 0.47 -0.67 -0.59 0.46 Unstable -0.47 0.73 0.66 -0.43 Clear -0.19 0.66 0.36 -0.16 Well-modulated 0.04 0.75 0.22 0.10 Monotonous -0.16 -0.55 -0.01 -0.30 Fast 0.22 0.29 -0.17 0.20 Slow -0.18 -0.24 0.20 -0.15 References
[1] C. Huang, and M. Akagi, “A three-layered model for expressive speech perception,” Speech Communication, 50(10), 810-828, 2008.
[2] X. Liu, R. Elbarougy and M. Akagi, “Study on Nonlinear Relationships between Semantic Primitives and Emotional Dimensions for Improving, Three-layered Model,” Proc. NCSP2019, pp. 522-525, 2019.
[3] R. Elbarougy and M. Akagi, “Improving speech emotion dimensions estimation using a three-layer model of human perception,” Acoust. Sci. & Tech., 35(2), 86-98, 2014. [4] M. Bradley and P. Lang, “Measuring emotion: the
Self-Assessment Manikin and the Semantic Differential,” J. Behav. Ther. Exp. Psychiatry, 25, 49-59, 1994.