Efficacy of Bifidobacterium bifidum G9-1 in
improving quality of life in patients with chronic constipation:
a prospective intervention study
Akiko FUYUKI1, Takuma HIGURASHI1, Takaomi KESSOKU1, Keiichi ASHIKARI1, Tsutomu YOSHIHARA1, Noboru MISAWA1, Michihiro IWAKI1, Takashi KOBAYASHI1, Hidenori OHKUBO1, Masato YONEDA1, Haruki USUDA2, Koichiro WADA2 and Atsushi NAKAJIMA1*
1Department of Gastroenterology and Hepatology, Yokohama City University School of Medicine, 3-9 Fuku-ura, Kanazawa-ku, Yokohama, Kanagawa 236-0004, Japan
2Department of Pharmacology, Shimane University Faculty of Medicine, 89-1 Enyacho, Izumo, Shimane 693-0021, Japan Received October 9, 2020; Accepted December 8, 2020; Published online in J-STAGE January 19, 2021
Chronic constipation is a functional disorder that decreases a patient’s quality of life (QOL). Because dysbiosis has been associated with constipation, we aimed to investigate the efficacy of Bifidobacterium bifidum G9-1 (BBG9-1) in improving QOL in patients with constipation. This was a prospective, single-center, non-blinded, single-arm feasibility trial. A total of 31 patients with constipation and decreased QOL received BBG9-1 treatment for 8 weeks, followed by a 2-week washout period. The primary endpoint was change in the overall Japanese version of the patient assessment of constipation of QOL (JPAC-QOL) score after probiotic administration relative to that at baseline. Secondary endpoints included changes in gut microbiota, stool consistency, frequency of bowel movement, degree of straining, sensation of incomplete evacuation, and frequency of rescue drug use. The overall JPAC-QOL scores and frequency of bowel movement significantly improved after BBG9-1 administration from those at baseline (p<0.01 and p<0.01, respectively). There were no statistically significant changes in other clinical symptoms. Subset analysis revealed that patients with initial Bristol Stool Form Scale stool types of <4 had improvements in stool consistency, a significant increase in the frequency of bowel movements, and a significant alleviation in the degree of straining, following BBG9-1 administration. At the genus and species levels, Sarcina and Sarcina maxima were significantly increased. Functional analysis showed that butanoate metabolism increased significantly, whereas methane metabolism decreased significantly. We concluded that BBG9-1 is safe and improves QOL in patients with constipation. The underlying improvements may be due to changes in stool consistency.
Key words : Bifidobacterium bifidum G9-1, chronic constipation, clinical trial, probiotic, quality of life
INTRODUCTION
Chronic constipation is a common gastrointestinal disorder with a high prevalence (14%) in the general population, and its incidence increases modestly with increasing age [1]. Patients with constipation often suffer from an impaired quality of life (QOL) [2]; this creates a large economic burden on society [3]. Improvements in lifestyle, fiber supplements, and pharmacological therapies are the currently recommended treatments to manage chronic constipation [4]. Despite this, nearly half of the patients with constipation are not fully satisfied with their current treatment, mainly because of the lack of efficacy [5]. There is an ongoing need to improve strategies for treating constipation.
Recently, the association between dysbiosis and constipation has been pointed out [6–8]. For example, the intestinal flora in patients with constipation showed significantly decreased levels of Bifidobacterium or Lactobacillus compared with those in healthy individuals [8].
Probiotics are living microorganisms that confer a health benefit on the host when administered in adequate dosage [9]. Several previous randomized controlled trials have reported that probiotics improve stool frequency and stool consistency in patients suffering from chronic constipation [10–12]; however, the results from these studies are equivocal, and there is a lack of strong evidence for the effectiveness of probiotics.
Bifidobacterium bifidum G9-1 (BBG9-1) is a probiotic that *Corresponding author. Atsushi Nakajima (E-mail: [email protected])
©2021 BMFH Press
Full Paper
This is an open-access article distributed under the terms of the Creative Commons Attribution Non-Commercial No Derivatives (by-nc-nd) License. (CC-BY-NC-ND 4.0: https://creativecommons.org/licenses/by-nc-nd/4.0/)
has been used as an intestinal medicine for decades and has been shown to be effective for treating constipation, although only in animal studies [13, 14]. Furthermore, few studies that have assessed the effect of probiotics on QOL in patients with constipation are available. Therefore, the aim of this feasibility study was to investigate the efficacy of BBG9-1 on QOL in patients with constipation.
MATERIALS AND METHODS
Study design
This was a prospective, single-center, non-blinded, single-arm feasibility trial in patients with constipation who had a decreased QOL. Patients were recruited from the gastroenterology outpatients at Yokohama City University Hospital from June 2017 to February 2019.
Patients
Consecutive patients (age ranging from 20 to 79 years) who were diagnosed with functional constipation, according to the Rome IV criteria [15], or already under treatment for chronic constipation were recruited for this study. The other inclusion criteria for the study were as follows: 1) 20 to 79 years of age as of the date of informed consent and 2) willingness to provide written informed consent. The exclusion criteria were as follows: 1) type 1 or 7 stool consistency scored by the Bristol Stool Form Scale (BSFS) [16]; 2) bowel movements less than once a week, 3) presence of rectal anal dysfunction; 4) an overall Patient Assessment of Constipation of QOL (PAC-QOL) score of less than 1 [17, 18]; 5) the presence of mechanical disorders confirmed by colonoscopy within 5 years before trial entry; 6) concurrent serious cardiovascular, respiratory, renal, hepatic, gastrointestinal (excluding constipation), blood, or neurological diseases; 7) history or current evidence of celiac disease or inflammatory bowel disease; 8) current treatment with steroids or biological products; 9) current evidence of severe psychiatric diseases that could affect the evaluation of study drug efficacy; 10) history or current evidence of abuse of drugs or alcohol; 11) history of
Bifidobacterium allergies; 12) new drug administration for any disease within 4 weeks before entry; 13) adjustment of medication within 4 weeks before entry; 14) administration of drugs currently in development; 15) current participation in other clinical trials or participation in other clinical trials within 12 weeks before entry; 16) administration of other probiotics; and 17) judgement by the investigators as inappropriate candidates for the trial.
Study protocol
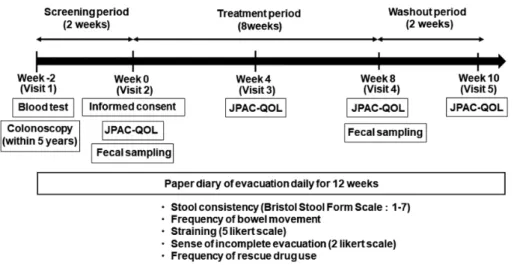
Patients were monitored for a 2-week baseline period during which data on their backgrounds, blood tests, and bowel habits were collected. Patients were also assessed for disease-specific QOL, using the Japanese version of the PAC-QOL (JPAC-QOL) [17, 18]. The enrolled patients received two tablets of BBG9-1 three times per day for 8 weeks, followed by a 2-week washout period. If the participants were already receiving any medication for constipation, they were allowed to continue taking the medications during the study period without any adjustment in dosing. No new medications for the treatment of constipation other than the study product were allowed during the study period. Furthermore, participants were instructed to maintain their diets and dietary supplements as usual during the study period. In the absence of defecation for several days, participants were allowed to take 48 mg of sennoside. During the 10-week study period, participants recorded their daily bowel movements as done during the screening period. Records containing data for more than 5 days per week were required for the data to be considered valid. Fecal samples were collected before the start of treatment and at 8 weeks after BBG9-1 administration for microbiota analysis. All patients were instructed to visit the study site at 4, 8, and 10 weeks after treatment initiation. At each visit, patients completed the JPAC-QOL and were interviewed about any side effects, and their defecation diaries and numbers of residual study products were checked. The scheme of this study is shown in Fig. 1. Study product
The study product was a BBG9-1 tablet (Biofermin® tablets, Biofermin Pharmaceutical Co., Ltd., Kobe, Japan). One tablet
Fig. 1. Study design. Patients were monitored for a 2-week baseline period and assessed for disease-specific QOL, using the Japanese version of the
Patient Assessment of Constipation of quality of life (JPAC-QOL). The enrolled patients received two tablets of BBG9-1 three times per day for 8 weeks, followed by a 2-week washout period. All patients were instructed to visit the study site at 4, 8, and 10 weeks after treatment initiation, and their JPAC-QOL, adverse effects, and defecation diaries were monitored.
contained 12 mg (viable cell count: 1×10⁶–1×10⁹ CFU/g) of Bifidobacterium bifidum. Doctors in charge of the study prescribed the study product at the start of the study at the study site. Participants were instructed to take two tablets of BBG9-1 after each meal every day. Compliance was monitored by counting the remaining drug tablets at the end of the 8-week drug administration period. Patients with less than 80% compliance were excluded from the analysis.
Outcome measures
The primary endpoint of this study was the difference in the overall JPAC-QOL score between before the start of treatment and 8 weeks after the administration of BBG9-1. Furthermore, the changes in the overall JPAC-QOL scores, comparing before treatment with 4 weeks after administration, 8 weeks after administration, and after the 2-week washout period, were analyzed. The PAC-QOL is a reliable and specific self-administered questionnaire that has been developed and validated to assess QOL impairment in patients with chronic constipation [17]. It consists of 28 questions, each with a 5-point Likert scale response (0, not at all; 1, slightly; 2, moderately; 3, quite a bit; 4, extremely or a great deal).
The JPAC-QOL scale also contains four subscales: physical discomfort, psychosocial discomfort, worries/concerns, and satisfaction. The overall score and each subscale score are expressed as the average score of each item [17].
The secondary endpoints were changes in stool consistency, frequency of bowel movement, degree of straining, incomplete sensation of evacuation, frequency of rescue drug use, and alteration of intestinal flora, following BBG9-1 intervention.
Stool consistency was scored using the BSFS, which is a visual scale for stool type graded from type 1 to type 7 (type 1, hard lumps; type 2, sausage shaped but lumpy; type 3, like a sausage but with cracks on the surface; type 4, like a sausage or snake, smooth and soft; type 5, soft blobs with clear-cut edges; type 6, fluffy pieces with ragged edges, a mushy stool; type 7, watery, no solid pieces, entirely liquid) [16]. Patients recorded their own stool consistency according to the BSFS scale in their recording diary. Incomplete sensation of evacuation was assessed on a binary scale (0, absent; 1, present), and the degree of straining was assessed on a 5-point ordinate scale (1, none; 2, mild; 3, moderate; 4, strong; 5, extremely strong). These were also evaluated by patient self-assessment. The mean scores for the baseline period, the latter two weeks of 4 and 8 weeks of BBG9-1 administration, and the washout period were analyzed. Patients who experienced an incomplete sense of evacuation in more than half of their defecation events were defined as experiencing an incomplete sense of defecation. The frequency of bowel movements was defined as the number of days with at least one bowel movement.
Analysis of gut microbiota
Fecal samples were collected before the start of treatment and at 8 weeks after BBG9-1 administration. DNA extraction was performed as described previously [19], and the resulting DNA was stored at −80°C until use. Analysis of the V3–V4 region of bacterial 16S rRNA was performed, as described previously but with minor modifications [20]. Briefly, the amplicons representing the V3–V4 region of 16S rRNA with unique indices incorporated by an Illumina Nextera XT Index kit (Illumina K.K., Tokyo,
Japan) were purified using AMPure XP beads. The purified barcoded library was diluted to 4 nM using 10 mM Tris-HCl (pH 8.0), and then, the same volume was pooled for multiplex sequencing. The multiplexed library pool (10 pM) was spiked with 40% PhiX control DNA (10 pM) and sequenced using a 2 × 250-bp paired-end run on a MiSeq platform using MiSeq Reagent Kit v2 chemistry (Illumina).
Sequence analysis was conducted using the 16S Metagenomics cloud application provided by Illumina, which calculates the number of reads and annotates sequences with the Greengenes database. QIIME Preprocessing and QIIME Visualizations were used for linear discriminant analysis and to construct a dendrogram, respectively. Representative reads for each operational taxonomic unit (OTU) were then assigned to the 16S rRNA gene database with ≥97% identity. Beta diversity was estimated by computing the weighted UniFrac distance between samples, a phylogenetic tree-based metric [21]. Additionally, the predicted functional composition of the gut microbiome was inferred for each stool sample using PICRUSt. Based on the fact that phylogeny and function are closely linked, this method accurately predicts the abundance of gene families from the 16S rRNA information [22]. A previous study showed that the PICRUSt imputed and shotgun sequenced metagenomes show very good correlation, with an average Spearman’s coefficient of around 0.8 [22]. Briefly, metagenome inference was performed with 16S rRNA gene sequences clustered at a 97% identity threshold using a closed reference of the Greengenes (version 13.5) database. The resulting OTU table was then normalized using the 16S rRNA gene copy number, and the predicted gene family abundance was inferred for each sample.
Sample size estimation
Previously, patients with constipation showed an improvement in JPAC-QOL scores, which QOL decreasing by −1.5 ± 0.8 (QOL change; average ± standard deviation [SD]) from 1.9 ± 0.8 (baseline QOL score), after medical intervention [18]. Furthermore, a 1-point improvement in the PAC-QOL score was validated as a relevant definition of significant response for treatment [17]. We used Student’s t-test with 1.7 SD, a two-sided significance level of 5%, and a power of 80% and estimated that a sample size of 25 patients would be necessary. Furthermore, accounting for dropout and accidental error, we considered that 30 patients should be recruited.
Safety and adverse events monitoring
Adverse events were monitored by a doctor at every follow-up visit of the patient to the study site. Adverse events were graded according to the National Cancer Institute Common Toxicity Criteria for Adverse Events (NCI-CTCAE), version 4.0. The protocol stated that if a Grade 3 or more severe adverse event occurred, the patient would be immediately withdrawn from the study.
Statistical analysis
Efficacy analyses were performed by per protocol set. The per protocol set was defined as the population among the full analysis set without serious deviations from the protocol. Safety analyses were performed for all patients who were administered at least one dose of the study product. Changes in the JPAC-QOL overall and subscale scores, stool consistency, frequency of bowel
movement, degree of straining, and frequency of rescue drug use were analyzed using a paired Student’s t-test. Incomplete sensation of defecation and safety were compared using a chi-square test. Data were expressed as average ± SD or median and range values. Statistical significance was set at a p value of <0.05. All statistical analyses were performed using commercially available software (IBM SPSS Statistics, IBM Corp., Armonk, NY, USA).
Regarding the gut microbiota analysis, the Shannon Index, which accounts for both richness and evenness, was calculated using the basic count data to assess for alpha diversity in each group of patients, and Student’s t-test was used to assess intergroup differences. A weighted UniFrac distance was measured using data normalized by regularized logarithm transformation [23] and used for a principal coordinate analysis (PCoA). Samples were classified as pre- or post-treatment samples; compositional differences were tested by a permutational multivariate analysis of variance on the distance matrix. The two groups of patients were then compared by the linear discriminant analysis (LDA) effect size (LEfSe) method, which emphasizes both statistical significance and biological relevance. The algorithm performs a nonparametric factorial Kruskal-Wallis sum-rank test and LDA to determine statistically significant different features among taxa and estimates the size effect of these differences [24]. Differences were considered significant at adjusted p values of <0.05 and a logarithmic LDA score cutoff of ≥2. Key bacterial taxa that emerged from the LEfSe analysis (adjusted p values <0.05 and logarithmic LDA score cutoff ≥2) were visualized using the package qgraph. The analyses were performed using the R statistics program (version 3.4.0).
Ethical considerations and registration
The study protocol followed the Declaration of Helsinki [25] and the Ethics Guidelines for Clinical Research published by the Ministry of Health, Labour and Welfare, Japan. We obtained approval for this study from the Ethics Committee of Yokohama City University Hospital in June 2017. This trial was registered in the University Hospital Medical Information Network
(UMIN) Clinical Trials Registry as UMIN 000029969. Written informed consent for participation in the study was obtained from all participating patients.
RESULTS
Patients were recruited and completed follow-up from June 2017 to February 2019. During the study period, a total of 68 patients were registered; they were assessed for eligibility, and a total of 34 patients entered the study. Out of the 34 enrolled patients, data from 31 patients were analyzed in the study (Fig. 2). Two patients were excluded due to ineligibility noted after registration, while one patient was excluded due to withdrawal of consent. A flow chart describing patient selection and exclusion is shown in Fig. 2. Patient demographic data is presented in Table 1. QOL assessment
The mean overall JPAC-QOL scores at baseline, at 4 and 8 weeks of BBG9-1 administration, and after the 2-week washout period were 1.73 ± 0.54, 1.07 ± 0.63, 0.97 ± 0.65, and 1.1 ± 0.68, respectively. The JPAC-QOL scores for all patients significantly improved after 4 (p<0.01) and 8 weeks (p<0.01) of BBG9-1 administration (Fig. 3a). Furthermore, there was no significant difference in the scores after 8 weeks of administration and after the 2-week washout period. Participants in this study showed similar QOL after discontinuation of the probiotic for 2 weeks.
All the subscale scores in the JPAC-QOL questionnaire were significantly decreased (physical discomfort, p<0.01; worries/ concerns, p<0.01; psychosocial discomfort, p<0.01; satisfaction, p<0.01) after 4 and 8 weeks of BBG9-1 administration (Fig. 3b–e). Stool consistency assessment
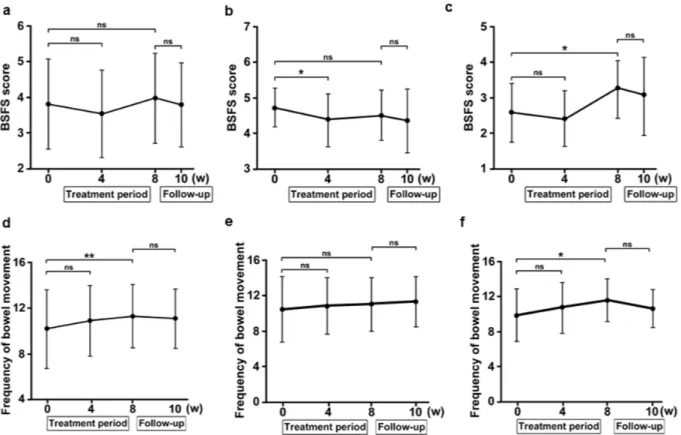
The mean BSFS scores at baseline, after 4 and 8 weeks of BBG9-1 administration, and after the 2-week washout period were 3.82 ± 1.25, 3.55 ± 1.22, 3.98 ± 1.25, and 3.8 ± 1.16, respectively (Fig. 4a). No significant difference was observed in these scores relative to the baseline score.
Fig. 2. Patient exclusion/inclusion flow chart. During the period of June
2017 to February 2019, a total of 68 patients were registered; they were assessed for eligibility, and 34 patients entered the study. Out of the 34 enrolled patients, data from 31 patients were analyzed in the study.
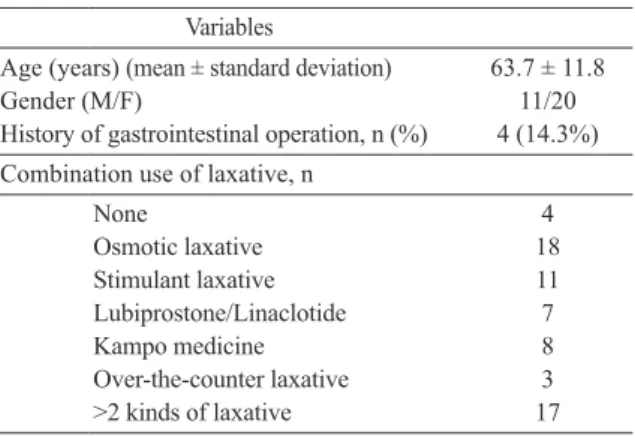
Table 1. Patient demographics (N=31)
Variables
Age (years) (mean ± standard deviation) 63.7 ± 11.8
Gender (M/F) 11/20
History of gastrointestinal operation, n (%) 4 (14.3%) Combination use of laxative, n
None 4 Osmotic laxative 18 Stimulant laxative 11 Lubiprostone/Linaclotide 7 Kampo medicine 8 Over-the-counter laxative 3 >2 kinds of laxative 17
Fig. 3. (a) The overall scores of the Japanese version of the patient assessment of constipation of quality of life (JPAC-QOL) (n=31). (b–e) Subscales
of the JPAC-QOL (n=31): (b) physical discomfort, (c) psychosocial discomfort, (d) worries/concerns, and (e) satisfaction. Statistical differences were evaluated using the paired Student’s t-test. *p<0.05 vs. baseline (0 weeks); **p<0.01 vs. baseline (0 weeks). ns: not significant.
Fig. 4. a–c: Mean Bristol Stool Form Scale (BSFS) scores (a, all patients, n=31; b, subset of patients with the BSFS score of 4 or more, n=18; c, subset
of patients with the BSFS score of less than 4, n=13). d–f: Mean frequency of bowel movements (d, all patients, n=31; e, subset of patients with the BSFS of 4 or more, n=18; f, subset of patients with the BSFS of less than 4, n=13). Statistical differences were evaluated using the paired Student’s t-test. *p<0.05 vs. baseline (0 weeks); **p<0.01 vs. baseline (0 weeks). ns: not significant.
We also conducted a post hoc analysis of the BSFS scores based on the pre-intervention scores. For patients who had a BSFS score of ≥4 at the start of the study (n=18), the mean BSFS scores at baseline, after 4 and 8 weeks of BBG9-1 administration, and after the 2-week washout period were 4.71 ± 0.54, 4.35 ± 0.74, 4.5 ± 0.7, and 4.33 ± 0.9, respectively. The BSFS score at 4 weeks of BBG9-1 administration was significantly different from the baseline score (Fig. 4b, p=0.03). For patients with a BSFS score of <4 at the start of the study (n=13), the mean scores at baseline, after 4 and 8 weeks of BBG9-1 administration, and after the 2-week washout period were 2.59 ± 0.83, 2.43 ± 0.78, 3.27 ± 0.82, and 3.07 ± 1.1, respectively. The BSFS score significantly increased after 8 weeks of BBG9-1 administration (Fig. 4c, p=0.03).
Frequency of bowel movement
The mean overall frequencies of bowel movements at baseline, after 4 and 8 weeks of BBG9-1 administration, and after the 2-week washout period were 10.2 ± 3.42, 10.9 ± 3.07, 11.3 ± 2.77, and 11.1 ± 2.58, respectively. The frequency of bowel movements significantly increased after 8 weeks of BBG9-1 administration compared with the baseline frequency (Fig. 4d, p<0.01).
For patients who had a BSFS score of ≥4 at the start of the study (n=18), the mean overall frequencies of bowel movements at baseline, after 4 and 8 weeks of BBG9-1 administration, and after the 2-week washout period were 10.5 ± 3.75, 10.9 ± 3.24, 11.1 ± 3.75, and 11.4 ± 3.02, respectively. None of these scores were significantly different compared with the baseline score (Fig. 4e). For patients who had a BSFS score of <4 at the start of the study (n=13), the mean frequencies of bowel movements at baseline, after 4 and 8 weeks of BBG9-1 administration, and after the 2-week washout period were 9.9 ± 3.02, 10.8 ± 2.95, 11.5 ± 2.47, and 10.6 ± 2.18, respectively. The frequency of bowel movements significantly increased after 8 weeks of BBG9-1 administration compared with the baseline frequency (Fig. 4f, p=0.04).
Degree of straining assessment
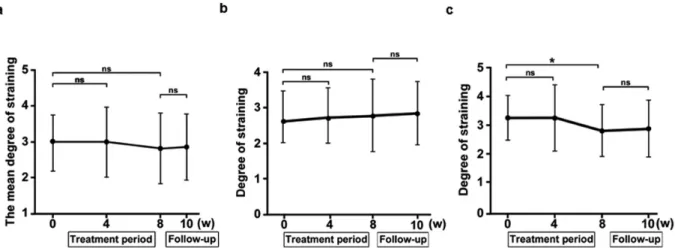
The mean degrees of straining at baseline, after 4 and 8 weeks of BBG9-1 administration, and after the 2-week washout period were 2.96 ± 0.78, 2.98 ± 0.97, 2.79 ± 0.97, and 2.85 ± 0.92, respectively (Fig. 5a). These values were not significantly different
from those at baseline. For patients who had a BSFS score of ≥4 at the start of the study (n=18), the mean degrees of straining at baseline, after 4 and 8 weeks of BBG9-1 administration, and after the 2-week washout period were 2.75 ± 0.73, 2.79 ± 0.78, 2.75 ± 1.03, and 2.84 ± 0.89, respectively. These values were not significantly different from the baseline values (Fig. 5b). However, for patients who had the BSFS score of <4 at the start of the study (n=13), the mean degrees of straining at baseline, after 4 and 8 weeks of administration, and after the 2-week washout period were 3.25 ± 0.79, 3.25 ± 1.16, 2.8 ± 0.9, and 2.87 ± 0.99, respectively. The degree of straining was significantly decreased after 8 weeks of BBG9-1 administration (Fig. 5c, p=0.03). Sense of incomplete evacuation assessment
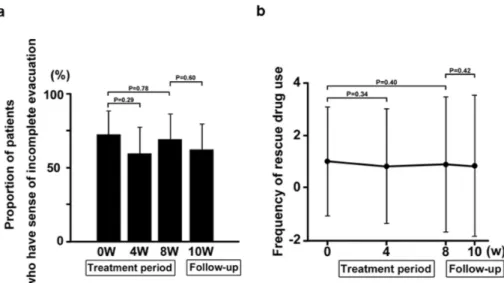
The mean proportions of patients who experienced a sense of incomplete evacuation at baseline, after 4 and 8 weeks of BBG9-1 administration, and after the 2-week washout period were 7BBG9-1% (95% CI, 54.0–87.9), 58.1% (95% CI, 39.7–76.5), 67.7% (95% CI, 50.3–85.2), and 61.3% (95% CI, 43.1–79.5), respectively (Fig. 6a). These values were not significantly different from those observed at baseline.
Frequency of rescue drug use assessment
The number of patients who used a rescue drug at least once during the baseline, 4- and 8-week BBG9-1 administration, and 2-week washout periods were 9, 5, 5, and 6, respectively. A total of 8 patients used a rescue drug during BBG9-1 administration and 2 weeks after discontinuation. Furthermore, the mean frequencies of rescue drug use at baseline, after 4 and 8 weeks of BBG9-1 administration, and after the 2-week washout period were 1.0 ± 2.1, 0.81 ± 2.2, 0.88 ± 2.6, and 0.84 ± 2.7, respectively (Fig. 6b). These values were not significantly different from those observed at baseline.
Analysis of gut microbiota
Regarding gut microbiota, there were no significant changes observed in the Shannon index (evenness) or OTUs following BBG9-1 treatment (Fig. 7a–b). However, chao1 (richness) was significantly increased (Fig. 7c, p<0.05). At the phylum level, Nitrospirae were significantly increased after BBG9-1 treatment. At the genus level, significant increases in Sarcina and 14 other
Fig. 5. a–c: Mean degree of straining (a, all patients, n=31; b, subset of patients with the Bristol Stool Form Scale (BSFS) of 4 or more, n=18; c,
subset of patients with the BSFS of less than 4, n=13). Statistical differences were evaluated using the paired Student’s t-test. *p<0.05 vs. baseline (0 weeks); **p<0.01 vs. baseline (0 weeks). ns: not significant.
Fig. 6. (a) Mean proportion of patients who experienced a sense of incomplete evacuation. Statistical differences were evaluated using the χ2 test. The values after 4 and 8 weeks of BBG9-1 administration were not significantly different from those at baseline. (b) Mean frequency of using rescue laxatives. These values were not significantly different than those observed at baseline. Statistical differences were evaluated using the paired Student’s t-test. The values after 4 and 8 weeks of BBG9-1 administration were not significantly different from those at baseline.
Fig. 7. Changes in microbial diversity following Bifidobacterium treatment measured by (a) the Shannon index, (b) operational taxonomic unit (OTU),
and (c) chao1. The whiskers denote the lowest and highest values within 1.5 IQR from the first and third quartiles. The circles represent outliers beyond the whiskers. The notches show the 95% confidence interval for the medians. The analysis was performed using the paired Student’s t-test. *p<0.05. ns: not significant. (d) principal coordinate analysis (PCoA) ordination plot based on weighted UniFrac distance matrix. Each subject is represented by a dot. Pre-treatment values are presented in red, and post-treatment values are presented in blue. (e) Linear discriminant analysis effect size (LEfSe) analysis of the full patient population both pre and post treatment with Bifidobacterium. *Features with an LDA score ≥2. (f) Cladogram displaying the taxonomic tree of differentially abundant taxa. The histogram represents the LDA scores of bacteria with significant differential abundance between the compared groups (identified by different colors).
kinds of bacteria and significant decreases in Neisseria and 4 other kinds of bacteria were observed after BBG9-1 treatment (Table 2). Additionally, at the species level, Sarcina maxima was significantly increased (Table 3). In the LefSe analysis, the absolute value of the LDA score was ≥2 for Phyllobacteriaceae, Aerococcaceae, Neisseria, Aggregatibacter, Alphaproteobacteria, Haemophilus, and Pasteurellales (Fig. 7e). A cladogram displaying the taxonomic tree of differentially abundant taxa is shown in Fig. 7f. The functional potential of the bacterial assemblies associated with each stool sample was predicted with PICRUSt using level 3 of the Kyoto Encyclopedia of Genes and Genomes (KEGG) orthologs. As assessed with LEfSe at a p value <0.05 and logarithmic LDA score cutoff ≥2, the post-treatment gut microbiome was significantly enriched or depleted in 26 functional categories compared with the pre-treatment gut microbiome. These enriched functional categories (Table 4) were related to carbohydrate metabolism (e.g., propanoate metabolism, butanoate metabolism, starch and sucrose metabolism, and galactose metabolism), amino acid metabolism (e.g., phenylalanine, tyrosine, and tryptophan biosynthesis, tyrosine metabolism, valine, leucine, and isoleucine biosynthesis), metabolism of cofactors, energy metabolism (methane metabolism), and vitamins (e.g., pantothenate and CoA biosynthesis, retinol metabolism, and lipoic acid metabolism). Surprisingly, after BBG9-1 administration, propanoate and butanoate metabolism were significantly increased, and methane metabolism was significantly decreased.
Safety and adverse events
All participants showed over 80% medication compliance. No adverse events were observed during the study period.
DISCUSSION
To the best of our knowledge, this is the first study to assess the efficacy of BBG9-1 and its effect on the QOL of patients with constipation. The overall JPAC-QOL scores and scores of all subscales were improved, and similar QOL scores were observed 2 weeks after the discontinuation of BBG9-1. With respect to constipation-related clinical symptoms, the frequency of bowel movements significantly increased after 8 weeks of BBG9-1 administration and 2 weeks after BBG9-1 discontinuation. A previous meta-analysis reported that probiotics significantly reduced the whole gut transit time, increased stool frequency, and improved stool consistency in patients with functional constipation [26], and our results on the frequency of bowel movements are consistent with these findings.
On the other hand, stool consistency, degree of straining, sense of incomplete evacuation, and frequency of rescue drug use among the patients were not significantly different following BBG9-1 administration. Furthermore, the mean BSFS score of all patients at baseline was 3.82 ± 1.25. This was probably because most of the patients were already taking some form of treatment for constipation before enrolling in this study. A total of eight patients used stimulant laxatives during BBG9-1 administration and 2 weeks after BBG9-1 discontinuation. Stimulant laxatives affected the bowel movement of patients and stool consistency; however, as we previously described, almost all patients were already using some medications, and we allowed them to continue using them. This is a clear reflection of the fact that this study targeted patients with constipation and a low QOL. This could be attributed to the
Table 2. Change of gut-microbiota abundance between pre- and post-Bifidobacterium administration at the genus level (N=31)
Genus Pre (%) Post (%) p value
Sarcina 0.042 0.14 0.046* Neisseria 0.028 0.015 0.002** Johnsonella 0.058 0.071 0.036* Thermodesulfovibrio 0.013 0.019 0.013* Leptotrichia 0.0029 0.0017 0.035* Lentibacillus 0.0067 0.0089 0.047* Yaniella 0.0045 0.0066 0.014* Marinitoga 0.0041 0.0058 0.033* Arcanobacterium 0.002 0.0033 0.027* Phyllobacterium 0.00064 0.0022 0.009** Kineosporia 0.002 0.003 0.037* Pasteurella 0.0016 0.00033 0.003** Pseudidiomarina 0.00042 0.001 0.032* Abiotrophia 0.0014 0.000044 0.029* Ectothiorhodospira 0.00021 0.0007 0.043* Sphaerisporangium 0.00013 0.00057 0.012* Rhodobacter 0.00017 0.00059 0.035* Achromobacter 0.00033 0 0.012* Anaeromusa 0 0.0002 0.044* Halanaerobacter 0 0.0002 0.046*
*p<0.05 vs. baseline (0 weeks); **p<0.01 vs. baseline (0 weeks).
Table 3. Change of gut-microbiota abundance between pre- and post- Bifidobacterium administration at the species level (N=31)
Species Pre (%) Post (%) p value
Anaeromusa acidaminophila 0 0.00042448 0.043* Bacteroides rodentium 0.57 0.31 0.020* Bacteroides uniformis 1.5 0.92 0.044* Bifidobacterium ruminantium 0.008 0.013 0.020* Blautia hydrogenotrophica 0.12 0.24 0.024* Campylobacter faecalis 0 0.00042 0.043* Cohnella laeviribosi 0.0025 0.0049 0.027* Ectothiorhodospira imhoffii 0.00042 0.00127 0.030* Euzebya tangerina 0.0072 0.0099 0.031* Ferrimicrobium acidiphilum 0.00032 0.00117 0.043* Fructobacillus pseudoficulneus 0.0031 0.006 0.044* Fusobacterium nucleatum 0.0023 0.00032 0.012* Fusobacterium periodonticum 0.0129 0.0041 0.045* Halanaerobacter chitinivorans 0 0.00042 0.043* Johnsonella ignava 0.11 0.13 0.044* Kineosporia mikuniensis 0.0035 0.0056 0.028* Lactobacillus pobuzihii 0.00042 0 0.043* Leuconostoc carnosum 0 0.0011 0.048* Marinitoga okinawensis 0.00021 0.0011 0.018* Mycobacterium lepromatosis 0.00053 0.00011 0.043* Neisseria lactamica 0.0011 0.00011 0.048* Neisseria mucosa 0.041 0.027 0.001** Nocardia devorans 0.00042 0 0.043* Paenibacillus filicis 0.00011 0.00053 0.043* Pasteurella pneumotropica 0.0024 0.00064 0.007** Porphyromonas canis 0.0087 0.014 0.038* Prevotella enoeca 0.00042 0 0.043* Prevotella veroralis 0.00084 0.003 0.001** Sarcina maxima 0.08 0.26 0.046* Sphaerisporangium rubeum 0.00021 0.0011 0.009** Streptococcus salivarius 0.00011 0.0014 0.021* Streptomyces roseogilvus 0.00021 0.0011 0.043* Syntrophomonas bryantii 0 0.00042 0.043* Tepidanaerobacter syntrophicus 0.011 0.016 0.049* Thermodesulfovibrio thiophilus 0.026 0.035 0.040* Veillonella denticariosi 0.014 0.006 0.009** Vibrio porteresiae 0.0016 0.004 0.037*
lack of statistical difference in the BSFS scores and frequency of rescue drug use following BBG9-1 administration. However, if the degree of stool consistency at the start of the study is taken into account, it is thought that BBG9-1 might be effective. When the patients were divided into two groups according to their initial stool consistency, it was found that the stool consistency of patients with soft stools (BSFS score of ≥4) changed to a harder consistency after 8 weeks of BBG9-1 administration. On the contrary, patients with hard stools (BSFS score of <4) reported softer stools following BBG9-1 administration. Previous studies have shown that stool consistency with a BSFS score of 4 contributes to QOL improvement in patients with constipation [27]. In this study, BBG9-1 demonstrated a potential to change the stool consistency in patients with a BSFS score of approximately 4, and this contributed to the improvement in QOL.
With respect to degree of straining, patients with hard stools (BSFS score of <4) experienced alleviation of symptoms following BBG9-1 administration. In summary, BBG9-1 may help normalize stool consistency and may contribute to improving stool frequency and straining in patients with hard stools (BSFS score of <4).
With respect to gut microbiota, there were no significant changes in Bifidobacterium following BBG9-1 administration. However, at the genus levels, Sarcina significantly increased, and at the species level, Sarcina maxima, which is known to be a butyric acid-producing bacterium, significantly increased (Table 3). A functional analysis showed supporting data on butyric acid production (Table 4). Furthermore, Bacteroides uniformis and Bacteroides rodentium were both significantly
decreased following BBG9-1 administration (Table 3).
Butyric and propionic acid are types of short-chain fatty acids (SCFAs) and are known to be reduced in patients with constipation [28]. A previous study reported that SCFAs can reduce gut transit time [28]. SCFA production by Sarcina maxima may contribute to some of the positive effects on QOL in patients with constipation. Furthermore, Bacteroides has been reported to increase in patients with constipation. The decrease in Bacteroides may also be related to the improvement of QOL in patients with constipation.
To further explore these hypotheses linking SCFAs to Bifidobacterium treatment, we used PICRUSt to assess the metagenomic profile of the gut microbiota [22]. Interestingly, this functional approach showed that Bifidobacterium treatment was associated with significant shifts in metabolic function in the gut microbiota, mainly impacting the KEGG pathways that relate to metabolism of carbohydrates, especially propanoate and butanoate metabolism. Surprisingly, a decrease in methane metabolism was observed after BBG9-1 administration (Table 4). Previous studies have reported that increases in methane-producing bacteria in the colon inhibit the colonic transit time [29–31]. These results provide exciting new insights about the potential roles of gut microbiota in Bifidobacterium treatment. However, they must be confirmed by further “classical” metagenomics studies to precisely identify which metabolic pathways of the gut microbiota are associated with Bifidobacterium treatment.
Although intriguing, this study has several limitations. First, a placebo effect was not evaluated because this was a non-blinded, single-arm trial. Second, this was a single-center study
Table 4. Pre- and post-Bifidobacterium treatment profiles of the gut microbiota
Level 1 Level 2 Level 3 (N = 31)Pre (N = 31) p valuePost
Metabolism Metabolism of Terpenoids and Polyketides Limonene and pinene degradation 0.08 0.088 0.005**
Metabolism Carbohydrate Metabolism Propanoate metabolism 0.509 0.523 0.007**
Metabolism Amino Acid Metabolism Phenylalanine, tyrosine, and tryptophan biosynthesis 0.889 0.866 0.013*
Metabolism Carbohydrate Metabolism Butanoate metabolism 0.583 0.607 0.013*
Metabolism Carbohydrate Metabolism Starch and sucrose metabolism 1.139 1.114 0.014* Metabolism Metabolism of Cofactors and Vitamins Pantothenate and CoA biosynthesis 0.644 0.632 0.018* Metabolism Xenobiotics Biodegradation and Metabolism Drug metabolism - cytochrome P450 0.036 0.041 0.024*
Metabolism Energy Metabolism Methane metabolism 1.413 1.375 0.027*
Metabolism Xenobiotics Biodegradation and Metabolism Benzoate degradation 0.209 0.226 0.028* Metabolism Xenobiotics Biodegradation and Metabolism Metabolism of xenobiotics by cytochrome P450 0.034 0.04 0.028*
Metabolism Amino Acid Metabolism Tyrosine metabolism 0.352 0.363 0.028*
Metabolism Metabolism of Cofactors and Vitamins Retinol metabolism 0.032 0.035 0.032* Metabolism Metabolism of Terpenoids and Polyketides Biosynthesis of vancomycin group antibiotics 0.061 0.058 0.033* Human Diseases Infectious Diseases Epithelial cell signaling in Helicobacter pylori infection 0.098 0.095 0.037*
Organismal Systems Nervous System Glutamatergic synapse 0.11 0.107 0.037*
Metabolism Xenobiotics Biodegradation and Metabolism Aminobenzoate degradation 0.103 0.112 0.040*
Metabolism Carbohydrate Metabolism Galactose metabolism 0.86 0.842 0.042*
Unclassified Metabolism Nucleotide metabolism 0.037 0.046 0.042*
Human Diseases Neurodegenerative Diseases Amyotrophic lateral sclerosis (ALS) 0.008 0.011 0.045* Metabolism Metabolism of Terpenoids and Polyketides Polyketide sugar unit biosynthesis 0.214 0.206 0.045* Metabolism Lipid Metabolism Synthesis and degradation of ketone bodies 0.021 0.024 0.045* Metabolism Metabolism of Cofactors and Vitamins Lipoic acid metabolism 0.021 0.024 0.047* Metabolism Xenobiotics Biodegradation and Metabolism Dioxin degradation 0.079 0.084 0.047* Human Diseases Neurodegenerative Diseases Huntington’s disease 0.016 0.019 0.049* Metabolism Xenobiotics Biodegradation and Metabolism Caprolactam degradation 0.021 0.029 0.050* Metabolism Amino Acid Metabolism Valine, leucine, and isoleucine biosynthesis 0.831 0.816 0.0498* *p<0.05, vs. baseline (0 weeks); **p<0.01, vs. baseline (0 weeks).
at a university hospital, which makes it difficult to generalize our conclusions beyond the studied population. Third, the sample size was too small to generalize our conclusions. Fourth, most of the patients enrolled in this study had already taken some medication for their constipation. Therefore, stool frequency or other clinical symptoms caused by constipation were likely to be already moderately controlled. However, the discontinuation of current medications is not ethical, meaning that we had to permit the patients to continue with their previous medication together with the administration of the probiotic.
CONCLUSION
In this study, BBG9-1 was found to be safe and to improve the QOL of patients with constipation. Thus, BBG9-1 may be an effective treatment option for chronic constipation. The mechanism of the improvement in QOL remains to be explored. To confirm these data, a placebo-controlled, double-blinded randomized controlled trial is warranted.
AUTHOR CONTRIBUTIONS
AF and TH equally contributed to this study as co-first authors. AF, TH, and AN conceived the study. AF and TH conducted the study. TK, HO, KA, TY, NM, and MY recruited the patients. KW and HU analyzed the fecal microbiome. AF, TK, and MI analyzed the data, and AF drafted the initial manuscript. TH was responsible for the revision of the manuscript. AN supervised the study. All authors have read and approved the final manuscript.
FUNDING
This trial was sponsored by Biofermin Pharmaceutical Co., Ltd.
CONFLICTS OF INTEREST
AN received research funding from Biofermin Pharmaceutical Co., Ltd. The other authors report no conflicts of interest.
ACKNOWLEDGEMENTS
We thank Kyoko Koike and Ayako Ujiie for their clerical assistance. We also thank Kyoko Kato for her technical assistance in the microbiome analysis.
REFERENCES
1. Suares NC, Ford AC. 2011. Prevalence of, and risk factors for, chronic idiopathic constipation in the community: systematic review and meta-analysis. Am J Gastroenterol 106: 1582–1591, quiz 1581, 1592. [Medline] [CrossRef]
2. Wald A, Scarpignato C, Kamm MA, Mueller-Lissner S, Helfrich I, Schuijt C, Bubeck J, Limoni C, Petrini O. 2007. The burden of constipation on quality of life: results of a multinational survey. Aliment Pharmacol Ther 26: 227–236. [Medline] [CrossRef]
3. Sun SX, Dibonaventura M, Purayidathil FW, Wagner JS, Dabbous O, Mody R. 2011. Impact of chronic constipation on health-related quality of life, work productivity, and healthcare resource use: an analysis of the National Health and Wellness Survey. Dig Dis Sci 56: 2688–2695. [Medline] [CrossRef]
4. Basilisco G, Coletta M. 2013. Chronic constipation: a critical review. Dig Liver Dis 45: 886–893. [Medline] [CrossRef]
5. Johanson JF, Kralstein J. 2007. Chronic constipation: a survey of the patient perspective. Aliment Pharmacol Ther 25: 599–608. [Medline] [CrossRef]
6. Dimidi E, Christodoulides S, Scott SM, Whelan K. 2017. Mechanisms of action of probiotics and the gastrointestinal microbiota on gut motility and constipation. Adv
Nutr 8: 484–494. [Medline] [CrossRef]
7. Ohkusa T, Koido S, Nishikawa Y, Sato N. 2019. Gut microbiota and chronic constipation: a review and update. Front Med (Lausanne) 6: 19. [Medline] [CrossRef]
8. Khalif IL, Quigley EM, Konovitch EA, Maximova ID. 2005. Alterations in the colonic flora and intestinal permeability and evidence of immune activation in chronic constipation. Dig Liver Dis 37: 838–849. [Medline] [CrossRef]
9. Hill C, Guarner F, Reid G, Gibson GR, Merenstein DJ, Pot B, Morelli L, Canani RB, Flint HJ, Salminen S, Calder PC, Sanders ME. 2014. The intestinal scientific association for probiotics and prebiotics consensus statement on the scope and appropriate use of the term probiotic. Nat Rev Gastroenterol Hepatol 11: 506–514.
[Medline] [CrossRef]
10. Yang YX, He M, Hu G, Wei J, Pages P, Yang XH, Bourdu-Naturel S. 2008. Effect of a fermented milk containing Bifidobacterium lactis DN-173010 on Chinese constipated women. World J Gastroenterol 14: 6237–6243. [Medline] [CrossRef]
11. Möllenbrink M, Bruckschen E. 1994. [Treatment of chronic constipation with physiologic Escherichia coli bacteria. Results of a clinical study of the effectiveness and tolerance of microbiological therapy with the E. coli Nissle 1917 strain (Mutaflor)]. Med Klin (Munich) 89: 587–593 (in German). [Medline]
12. Koebnick C, Wagner I, Leitzmann P, Stern U, Zunft HJ. 2003. Probiotic beverage containing Lactobacillus casei Shirota improves gastrointestinal symptoms in patients with chronic constipation. Can J Gastroenterol 17: 655–659. [Medline] [CrossRef]
13. Isa Y, Oogushi S, Yamashita M, Ishihara Y, Sakutani W, Shimakawa M, Arai T, Ohno H. 2003. Effect of Bifidobacterium bifidum G9-1 on a constipation model induced by low-fiber diet in rats. Jpn J Med Pharm Sci 49: 745–751.
14. Makizaki Y, Maeda A, Oikawa Y, Tamura S, Tanaka Y, Nakajima S, Yamamura H. 2019. Alleviation of low-fiber diet-induced constipation by probiotic Bifidobacterium
bifidum G9-1 is based on correction of gut microbiota dysbiosis. Biosci Microbiota
Food Health 38: 49–53. [Medline] [CrossRef]
15. Lacy BE, Mearin F, Chang L, Chey WD, Lembo AJ, Simren M, Spiller R. 2016. Bowel disorders. Gastroenterol 150: 1393–1407. [CrossRef]
16. Longstreth GF, Thompson WG, Chey WD, Houghton LA, Mearin F, Spiller RC. 2006. Functional bowel disorders. Gastroenterology 130: 1480–1491. [Medline] [CrossRef]
17. Marquis P, De La Loge C, Dubois D, McDermott A, Chassany O. 2005. Development and validation of the patient assessment of constipation quality of life questionnaire. Scand J Gastroenterol 40: 540–551. [Medline] [CrossRef]
18. Nomura H, Agatsuma T, Mimura T. 2014. Validity and reliability of the Japanese version of the patient assessment of constipation quality of life questionnaire. J Gastroenterol 49: 667–673. [Medline] [CrossRef]
19. Matsuki T, Watanabe K, Fujimoto J, Takada T, Tanaka R. 2004. Use of 16S rRNA gene-targeted group-specific primers for real-time PCR analysis of predominant bacteria in human feces. Appl Environ Microbiol 70: 7220–7228. [Medline] [CrossRef]
20. Fadrosh DW, Ma B, Gajer P, Sengamalay N, Ott S, Brotman RM, Ravel J. 2014. An improved dual-indexing approach for multiplexed 16S rRNA gene sequencing on the Illumina MiSeq platform. Microbiome 2: 6. [Medline] [CrossRef]
21. Lozupone C, Knight R. 2005. UniFrac: a new phylogenetic method for comparing microbial communities. Appl Environ Microbiol 71: 8228–8235. [Medline] [CrossRef]
22. Langille MG, Zaneveld J, Caporaso JG, McDonald D, Knights D, Reyes JA, Clemente JC, Burkepile DE, Vega Thurber RL, Knight R, Beiko RG, Huttenhower C. 2013. Predictive functional profiling of microbial communities using 16S rRNA marker gene sequences. Nat Biotechnol 31: 814–821. [Medline] [CrossRef]
23. Love MI, Huber W, Anders S. 2014. Moderated estimation of fold change and dispersion for RNA-seq data with DESeq2. Genome Biol 15: 550. [Medline] [CrossRef]
24. Segata N, Izard J, Waldron L, Gevers D, Miropolsky L, Garrett WS, Huttenhower C. 2011. Metagenomic biomarker discovery and explanation. Genome Biol 12: R60.
[Medline] [CrossRef]
25. World Medical Association 2013. World Medical Association Declaration of Helsinki: ethical principles for medical research involving human subjects. JAMA 310: 2191– 2194. [Medline] [CrossRef]
26. Dimidi E, Christodoulides S, Fragkos KC, Scott SM, Whelan K. 2014. The effect of probiotics on functional constipation in adults: a systematic review and meta-analysis of randomized controlled trials. Am J Clin Nutr 100: 1075–1084. [Medline] [CrossRef]
27. Ohkubo H, Yoshihara T, Misawa N, Ashikari K, Fuyuki A, Matsuura T, Higurashi T, Imajo K, Hosono K, Yoneda M, Kobayashi N, Saito S, Nakajima A. 2019. Relationship between stool form and quality of life in patients with chronic constipation: an internet questionnaire survey. Digestion 1: 1–8. [Medline] [CrossRef]
28. Shi Y, Chen Q, Huang Y, Ni L, Liu J, Jiang J, Li N. 2016. Function and clinical implications of short-chain fatty acids in patients with mixed refractory constipation. Colorectal Dis 18: 803–810. [Medline] [CrossRef]
29. Sahakian AB, Jee SR, Pimentel M. 2010. Methane and the gastrointestinal tract. Dig Dis Sci 55: 2135–2143. [Medline] [CrossRef]
30. Pimentel M, Lin HC, Enayati P, van den Burg B, Lee HR, Chen JH, Park S, Kong Y, Conklin J. 2006. Methane, a gas produced by enteric bacteria, slows intestinal transit and augments small intestinal contractile activity. Am J Physiol Gastrointest Liver Physiol 290: G1089–G1095. [Medline] [CrossRef]
31. Lee KM, Paik CN, Chung WC, Yang JM, Choi MG. 2013. Breath methane positivity is more common and higher in patients with objectively proven delayed transit constipation. Eur J Gastroenterol Hepatol 25: 726–732. [Medline] [CrossRef]