D a y ti m e l o c a l w i n d p a t te r n s b a s e d o n d i v e r g e n c e fi e l d o v e r t h e Ka n to P l a i n i n s u m m e r a n d t h e i r re l a t i o n s h i p s w i th l o c a l te m p e r a tu re d i s tr i b u ti o n
a n d p re s s u re d i s tr i b u ti o n a ro u n d J a p a n
Yo s h i h i to S E TO
D e p a rt m e n t o f G e o g ra p h y
G r a d u a t e S c h o o l o f U rb a n En v i ro n me n t a l S c i e n c e s To k y o Me t ro p o l i t a n U n i v e rs i t y
Ma rc h 2 0 1 5
Table of Contents
Acknowledgements ... vi
Abstract ... vii
1. Introduction ... 1
2. Data and method ... 7
2.1. Data used ... 7
2.2. Estimation of roughness parameter and correction of wind speed ... 9
2.3. Calculating the amount of convergence/divergence ... 15
2.4. Methods for the analyses ... 16
2.5. Selection of sunny light-wind days ... 17
3. Wind patterns and divergence field on sunny light-wind days ... 19
3.1. Distribution of wind and divergence field ... 19
3.2. Characteristics of the variation pattern of divergence ... 21
3.3. Classification of sunny light-wind days ... 25
3.4. Relationship between the synoptic-scale pressure gradient ... 27
4. Wind patterns and divergence field on each category ... 30
4.1. Wind patterns and divergence field ... 30
4.2. Decadal variation of pressure pattern and wind field ... 37
5. Relationship between wind systems and temperature distribution ... 44
5.1. Characteristics of temperature distribution on sunny light-wind days ... 44
5.2. Characteristics of temperature distribution on each category... 45
5.3. Temperature difference between coast and inland and its relationship with wind field ... 47
6. Discussions ... 53
7. Conclusions ... 57
References ... 60
List of Figures
Fig. 1. Map of the study area showing distribution of observatories.
Fig. 2. Distribution map showing observatories used for the analysis of temperature.
Fig. 3. The observational height of the wind speed at each observatory.
Fig. 4. The roughness parameter and the correction factor for adjustment of wind speed at each observatory.
Fig. 5. Differences between 1981 and 2009 in the wind speed at the height of anemometer for each observatory when the wind speed at the standard height (50 m) is 10 m/s.
Fig. 6. Distribution map showing observatories used for selection of sunny light-wind days.
Fig. 7. Distribution maps showing composite wind barbs and convergence/divergence on sunny light-wind days.
Fig. 8. Distribution maps showing the factor loading of the EOF analysis for the hourly convergence/divergence amount on sunny light-wind days.
Fig. 9. Time series of hourly mean EOF score on sunny light-wind days.
Fig. 10. Distribution maps showing composite wind barbs and convergence/divergence on days with positive anomaly of EOF1 score.
Fig. 11. Distribution maps showing composite wind barbs and convergence/divergence on days with negative anomaly of EOF1 score.
Fig. 12. Distribution maps showing composite wind barbs and convergence/divergence on days with positive anomaly of EOF2 score.
Fig. 13. Distribution maps showing composite wind barbs and convergence/divergence on days with negative anomaly of EOF2 score.
Fig. 14. Distribution maps showing composite wind barbs and convergence/divergence on days with positive anomaly of EOF3 score.
Fig. 15. Distribution maps showing composite wind barbs and convergence/divergence on days with negative anomaly of EOF3 score.
Fig. 16. The dendrogram of cluster analysis representing the process of linking the clusters.
Fig. 17. Time series of hourly mean EOF score on each category classified by the cluster analysis.
Fig. 18. Zonal and meridional components of the geostrophic wind on each sunny light-wind days for each category.
Fig. 19. Distribution maps showing composite wind barbs and convergence/divergence on Category A days.
Fig. 20. Distribution maps showing composite wind barbs and convergence/divergence on Category B days.
Fig. 21. Distribution maps showing composite wind barbs and convergence/divergence on Category C days.
Fig. 22. Distribution maps showing composite wind barbs and convergence/divergence on Category D days.
Fig. 23. Distribution maps showing composite wind barbs and convergence/divergence on Category E days.
Fig. 24. Distribution of vertical wind speeds at 975 hPa and surface wind barbs at 15:00 JST on each category of sunny light-wind days (2006–2011).
Fig. 25. Meridional and vertical components of wind on the vertical north–south cross section along the 139.5°E line at 15:00 JST on each category of sunny light-wind days (2006–2011).
Fig. 26. Distribution maps showing composite sea level pressure (hPa) and surface wind vector (m/s) on each category of sunny light-wind days.
Fig. 27. Distribution maps showing sea level pressure (hPa) and surface wind vector (m/s) on July and August.
Fig. 28. Distribution maps showing sea level pressure (hPa) and surface wind vector (m/s) on 1979–1989.
Fig. 29. Distribution maps showing sea level pressure (hPa) and surface wind vector (m/s) on 1990–2000.
Fig. 30. Distribution maps showing sea level pressure (hPa) and surface wind vector (m/s) on 2001–2011.
Fig. 31. Distribution maps showing composite temperature on sunny light-wind days.
Fig. 32. Distribution maps showing composite temperature anomaly on Category A days.
Fig. 33. Distribution maps showing composite temperature anomaly on Category B days.
Fig. 34. Distribution maps showing composite temperature anomaly on Category C days.
Fig. 35. Distribution maps showing composite temperature anomaly on Category D days.
Fig. 36. Distribution maps showing composite temperature anomaly on Category E days.
Fig. 37. Distribution maps showing composite surface air temperature anomaly (°C) on each category of sunny light-wind days.
Fig. 38. Distribution maps showing composite wind barbs and convergence/divergence on TK-T ≥ 2.5°C cases.
Fig. 39. Distribution maps showing composite wind barbs and convergence/divergence on TK-T < 1.5°C cases.
Fig. 40. Distribution maps showing temperature anomaly on TK-T ≥ 2.5°C cases.
Fig. 41. Distribution maps showing temperature anomaly on TK-T < 1.5°C cases.
List of Tables
Table 1. Land utilization divisions and classified categories.
Table 2. Number of sunny light-wind days and relative frequency of each category on each 11-year period.
Table 3. Number of sunny light-wind days and relative frequency of each category on 1979–1989.
Table 4. Number of sunny light-wind days and relative frequency of each category on 1990–2000.
Table 5. Number of sunny light-wind days and relative frequency of each category on 2001–2011.
Table 6. Number of sunny light-wind days of each TK-T category and relative frequency of each category.
Table 7. Number of sunny light-wind days and relative frequency of each TK-T category on each 11-year period.
Acknowledgements
First, I would like to express my sincere gratitude to my supervisor, Professor Hideo Takahashi of Department of Geography, Tokyo Metropolitan University (TMU) for his helpful support and excellent suggestions on my study. I am very thankful for valuable comments and suggestions from Professor Jun Matsumoto and Associate Professor Hiroshi Matsuyama of Department of Geography (TMU). I would like to thank Professor Takehiko Mikami of Department of History, Teikyo University for giving the start of my research.
AMeDAS data by the Japan Meteorological Agency, MICS data by the Japan Coast Guard/Japan Oceanographic Data Center, and data for air pollution monitoring stations by each prefectural government were used in this study. I would like to extend my sincere appreciation to each institution for the continuous monitoring of data. The digital elevation model published by the Geospatial Information Authority of Japan, the Generic Mapping Tools (GMT), and the Grid Analysis and Display System (GrADS) were used to draw the maps in this study.
I would also like to thank to all members of the Laboratory of Climatology and Department of Geography (TMU) for their support and helpful comments.
Finally, my deepest thanks extend to my parents, family and friends for their encouragement, understanding and support.
Abstract
Local wind systems, such as sea and valley breezes, are common to the Kanto Plain on sunny summer days when there are small synoptic-scale pressure gradients. Local wind systems should affect the temperature distribution at the regional scale because of the advection of cold air from the surrounding sea areas, adiabatic processes caused by vertical air motion, the occurrence of differences in wind speeds, and other factors. Many researchers have proposed that the Foehn phenomenon makes a significant contribution to the occurrence of extremely high temperatures in the inland area of the Kanto Plain. Conversely, it has been found that the number of days when high temperatures occur in the Kanto Plain and the prevailing wind is weak has been increasing.
However, the relationship between this observation and diurnal variations in the wind distribution, and the extended sea breeze (ESB) transition has not been analyzed sufficiently. The structure of the wind system over the Kanto Plain in summer is very complicated because sea breezes from multiple directions affect the plain. In addition, changes in local wind systems should be affected by the synoptic-scale pressure gradient. Therefore, systematic analyses of the relationships between local wind systems, the temperature distribution, and the synoptic field from the viewpoint of long-term changes are required. According to numerical model studies, the penetration of sea breeze fronts inland tends to be delayed in the inland side of the Tokyo Metropolitan area because of the effects of the urban area. However, it has been problematic to verify whether long-term changes have occurred from observational data.
In this study, the wind system distribution over the Kanto Plain was examined focusing on the distributions of convergence/divergence amount of the surface winds (hereinafter referred to as divergence field) to reflect wind system structures such as the vertical flow of the sea breeze front and local wind circulation. Multivariate statistical analysis was used to assess the variations of the divergence field in the daytime on sunny summer days. The local wind system was classified based on the temporal variations in the wind system distribution. The purpose of this study was to examine the relationship between the local wind systems, temperature distribution, and a synoptic field (such as the prevailing wind and pressure pattern), and to determine the
changes in the synoptic field that are related to the structures of the wind systems over the Kanto Plain, where an increase in the temperature has been observed in recent years.
In addition to long-term atmospheric reanalysis data, dense surface observation data obtained by the Automated Meteorological Data Acquisition System, the Maritime Information and Communication System, and the air pollution monitoring stations for July and August from 1979 to 2011 (i.e., 33 years) were used. The wind speed at a standard height of 50 m, calculated using the logarithmic law of the wind speed, was used when the divergence field was analyzed because the anemometers at different observatories were at different heights. Estimated roughness parameters from the land uses around each observatory were used in the wind-speed correction procedure. The pressure gradient and the geostrophic wind were calculated from the sea level pressure in the Kanto region and used as indices to describe the prevailing winds in the study area. Empirical orthogonal function analysis was conducted on the hourly divergence field data between 09:00 JST and 17:00 JST on 369 sunny light-wind days when the geostrophic wind speed in the Kanto region was 6 m/s or less. This allowed the three principal components with the scores for different temporal variation patterns to be obtained. The first principal component showed north–south variations in the convergence and divergence areas, which were related to the development of the sea breeze and the sea breeze front. The second principal component showed the strength of divergence corresponding to the down-flow areas of sea breeze and valley breeze circulations. The third principal component showed the strength of convergence around the prefectural border of Tokyo and Saitama related to southerly sea breezes. Cluster analysis was applied to the time series for the scores for the three principal components, and this allowed the wind systems on sunny light-wind days to be put into five categories (A–E) based on spatial and temporal variations in the wind systems.
There were relationships between the pressure gradients (geostrophic wind) and classified categories. The geostrophic wind direction changed from northwesterly to southeasterly in the following order: 81 days in Category A, 90 days in Category B, 85 days in Category C, 56 days in Category D, and 57 days in Category E. The surface wind patterns changed in a similar way
for the different categories, from the dominance of southerly sea breezes with increasing wind speeds to the dominance of easterly sea breezes. The weakest geostrophic wind and typical sea breeze system close to average on sunny light-wind days were found in Category C. The distributions of areas of divergence and convergence in the morning led us to conclude that valley breeze circulation in the northern part of the Kanto region and sea breeze circulation in the southern part of the Kanto region were present independently in all of the categories. However, the differences in the strengths of the east wind from Kashima-nada, corresponding to the pressure gradient, in these areas became distinct in the afternoon. Moreover, the penetration of the sea breeze front caused by the southerly sea breezes from Tokyo Bay and Sagami Bay, and the ESB transition were earliest in Category A, were two to four hours later in Categories C and D, and were not observed in Category E.
The correspondences between the categories and the temperature and pressure distributions were investigated using composite analysis. The Pacific High ridge is located in the southern part of Japan, so the prevailing wind in the Kanto region was southwesterly in Category A. The penetration of low-temperature easterly sea breezes was not observed in Category A, and high temperatures were found in the inland area of the Kanto Plain and along the Kashima-nada coast.
The increase in the temperature in the inland area might be related to the low wind speeds that occur in the mornings, and the high temperatures that were found in the northern Kanto region, especially in the inland areas, were compared with the temperatures that were found in the southern Kanto region. High temperatures and surface wind divergences were observed over a wide area along the south coast of Japan, so a temperature increase caused by adiabatic compression in the down-flow area of the Pacific High, which expanded to the south of Japan, may have occurred in Category A. In contrast, in Categories C and D, temperature increases were not observed along the Kashima-nada coast and high temperatures were observed in the southern Kanto region (e.g., in Tokyo). Low temperatures were observed over the whole Kanto region in Category E.
It has been suggested from numerical model calculations that the penetration of the sea breeze
front stagnates in the inland side of the Tokyo Metropolitan area. However, the relative frequencies of Categories A and B (where the penetration of the sea breeze front and the ESB transition occur a few hours earlier than average on sunny light-wind days) have been increasing over the last 30 years. In other words, changes in the synoptic field in recent years (despite increased urbanization) have caused the penetration of the sea breeze front and the ESB transition to start earlier. The extension of the Pacific High after the rainy season has been biased toward the south of Japan, with southwest winds occurring in the Kanto region, in recent years.
This is likely to be related to the increase in the relative frequency of Category A. The analysis that focuses on the magnitude of the temperature difference between the southern Kanto region and the inland parts of the northern Kanto region was conducted, and this analysis led us to conclude that high temperatures occurred in the inland area when the temperature difference was large. Moreover, the wind system distribution when this occurred was consistent with the characteristics of Categories A and B, in which increasing trends have been observed in recent years. These factors confirm that the increased occurrence of high temperatures in the inland area of the Kanto Plain and changes in wind patterns are related to each other.
As described above, local wind systems over the Kanto Plain on sunny light-wind days in summer are closely related to the pressure gradient around Japan because of the differences that occur in the pressure patterns affecting the speed of the penetration of the sea breeze front and the speed at which the ESB transition becomes dominant. We conclude that, on sunny light-wind days when the Foehn phenomenon does not appear, the appearance frequency of the pressure pattern that appears the Pacific High ridge to the south of Japan increased, and that this is associated with changes that have occurred in the wind system over the Kanto Plain, and the high temperatures that have been recorded in the inland area of the Kanto Plain in recent years.
1. Introduction
The Kanto Pl ain is t he most ex tensi ve pl ain i n Japan. Its eastern and southern sides face water bodies such as Tokyo Bay, Sagami Bay, and Kashi ma -nada, and its west ern and nor thern si des are surr ounded by mountai ns such as the Kant o Mount ains. Such geographi cal featur es contribute to the appea rance of local wind syst ems, incl udi ng land -sea breezes and mount ain -valley breezes , gener ated by t her mal eff ects on sunny summer days. Land -sea breezes ar e generated by a pressure gradient caused by t he differ ence in ther mal charact eristics bet ween t he se a and land. Its occurr ence di ffers dependi ng on cli mate conditions and pressur e gr adient . Usuall y, when the pr evailing wind blows toward the l and, the int ensit y of sea breeze increases; when the prevailing wind blow s t oward the sea, it becomes weaker (Piel ke, 1974; Asai, 1996) . Land -sea breezes often combi ne wit h local wind syst ems i nfluenced by t he characteristics of t opogr aphy (Asai, 1996). Due t o the complex di stributi on of the sea and land, and t he mountai ns surroundi ng the Plai n, the wind syst ems over the Kanto Pl ain are also complex. In t he Kanto Plai n, diur nal vari ati ons of land -sea breezes have little seasonal variati on s ( Fuj ibe, 1981) . If the pressure gr adient under synoptic conditi ons is small, t he diur nal variation i n wind systems occur s mostl y due to land -sea breezes ( Fuj ibe, 1985) . Therefore, local wi nd syst ems in the Kanto region are dominat ed by the diur nal variation in land -sea breezes during summer when the pressure gradi ent under synopti c conditions is smaller than wint er.
In regards t o t he wind syst em over the Kanto Plain duri ng sunny summer days , Kawamura ( 1970, 1974) point ed out that in contrast to the occurrence of sea breezes wit h the wind directi on orthogonal to the coastline i n the mor ning, t he inland wind system beco mes uncl ear in t he after noon, and all areas of t he Kanto Pl ain ar e cover ed by a southerl y wi nd. Fuj ibe and Asai (1984) conduct ed a detailed obser vational st udy in t he coastal zone of Sagami Bay in order to examine the vertical str ucture and di urnal variati on of land -sea breezes i n Sagami Bay. The results showed t hat the sea breeze start s to blow fr om the coastal lower l ayer and increase s i n thi ckness. In t he afternoon, the sea breeze extends i n both hori zont al and vertical directi ons.
The sea breeze di mi nis hes from the coastal lower layer as t he pressure gr adient near the coast decr eases in the lat e after noon. Fuj ibe and Asai (1979) showed t hat i n additi on t o t ypical l and -sea breezes , large -scale winds that play an i mportant role i n the di urnal variation of wind systems over the whol e Kanto Plai n exist. This is someti mes ca lled t he “ext ended sea breeze (ESB)”, and its existence has also been poi nted out in the Nobi Plain and the Kinki region (Mori et al., 1994; Ito h, 1995) . The for mation of the ESB i n t he Kanto Plain has been exami ned usi ng t he result s of vertical obser vations (Fuj ibe and Asai , 1979; Kurita et al ., 1988, 1990) and numer ical model calculati ons (Kondo, 1990a). These studies show t hat although a complex wind system consist ing of local winds, such as land -sea breezes and mountai n -valley br eezes , i s obser ved i n the morni ng, these l ocal winds become integrated in the aft ernoon. Consequentl y, a large -scale wind bl ows
towar d the t her mal low that developed over the mountainous ar ea of cent ral Japan. In additi on, i t has been point ed out that t he vall ey -shaped i nland terrains and t he distance to the coastli ne act to combine t he sea and valley breeze (Kondo, 1990b).
These local wind systems are closel y associated with summe r cli mat e charact eristi cs such as temperat ure di stribution over the Kant o Pl ain , such as suppr ession of dayt i me t emperat ure ri se due to t he penetration of low-temperature sea breeze (Mi kami, 2006) and adiabatic heati ng in the basin bottom and inland plain associat ed wit h subsidence fl ow generated as a compensation flow of valley wi nd (K uwagata et al. 1990). In r ecent years, there has been an increasing trend in t he number of hot days i n the i nland area of the Kanto Pl ai n. This trend is exten sive from the area around Tokyo to Saitama Prefecture and the sout hern part of Gunma Pr efecture ( Fuj ibe, 1998).
The heat island effect generated by urbani zation i s consi dered as a reason for this tr end (Japan Met eorological Agency, 2005). However, the f act ors and the increasi ng trend of t he h i gh temperature var y depending on the t ype of prevaili ng wind. When ther e is an extreme h i gh temperature wit h maxi mum temperatur es of 38 °C or more (e.g., a maxi mum temperatur e of 40.9 °C was recorded in Kumaga ya on August 16, 2007) , the prevailing winds b low towar d the west, and a contribution from the westerl y Foehn blowing over the mountai ns i s i ndicat ed (e.g., Takane and K usaka, 2011). On t he other hand, it has been pointed out that a si gnifi cant increasi ng trend exists for hi gh temperatur es occurri ng i n the Kanto Plai n on days when the prevailing wi nd
is weak, the sout her n wi nd is predominant, and t he heating effect of the Foehn phenomenon is small (Fuj ibe, 1998) . The temper ature i ncr ease in the boundar y layer due to urbani zati on and changes in t he wi nd syst em o ver the Kanto Pl ain are possible causes of such trend s. Based on numeri cal calculati ons, Kusaka et al. (2000) confir med an incr ease i n the t emperatur e in the inland si de of Tokyo due to changes i n the penetration patt er n of the sea breeze f ront caused by changes in the land use associat ed with urbani zati on.
Such a change in the wind system was accompanied by strengthening of convergence on the inland si de of Tokyo. Fuj ibe et al. (2002) showed that a wind pattern exists i n which wi nds blowi ng from t he East (Kashi ma -nada) and t he Sout h ( Sagami Bay) converge around Tokyo prior t o the occurrence of heavy rai nfall i n Tokyo, which is i nvol ved in i ncreasing the precipitation intensit y. This i mpli es that changes in t he wind syst em are rel ated to t he increase in heavy rain fall.
However, whil e it has been suggested that for t he appearance of the wind system patter ns related to the occurr ence of heavy rain f all, the pr essure fiel d over the Kant o r egion is more i mportant than the effects of urban areas (Sa wada and Takahashi, 2007); t hus, the causes for the change in the wind system are debatable (Fuj ibe, 2003) . In addition, it is known t hat the local wind system in t he Kanto Pl ain i s aff ect ed by the synopti c -scale pr essur e gr adient ( Suzuki and Kawamura, 198 7), and the wind syst ems change accordi ng to the dir ection and magnit ude of t he pressure gr adient . For example, sea breeze is strengthened when the dir ection of t he geostr ophi c
wind ( corresponding t o t he pressur e gradi ent) matches that of the sea breeze.
However, when the direction of t he geostr ophic wind i s opposi te, t he sea breeze i s rarel y generated ( Yoshi kado, 1978; Yoshi kado , 1981) . Since the relationship between geostr ophi c wi nd and gr ound surf ace wind i s affected by factors such as topogr aphy, it varies based on the direction of the geostr ophi c wind (Mori, 1985); the geostr ophic wind al one cannot explain t he changes in the wind system. On t he ot her hand, Fuj ibe (2003) pointed out t hat long -ter m changes i n t he occurr ence frequency of geostrophi c winds and the local wind system in the Kanto r egion have occurred between 1920 s and 1990s on sunny summer days . These changes may be r elat ed to the increasi ng t rend i n hi gh temperatur es and the occurr ence of heavy rain fall. However, lit tle research concer ning the occurr ence patterns of the wind system over t he Kanto Plai n has been conducted. The r elationshi p between changes in the local wind circulation associated with t he for mation of the ESB and t he pressure gr adient under synoptic conditions, and the l ong-ter m c hanges in t hese factors have al so not been studied in dept h.
Moreover, it is ther ef ore i mport ant to deter mine the diurnal var iations i n the relati onshi p among l ocal wind systems over t he Kant o Plai n . However, each local wi nd system has a t hree -di mensi onal structure, and it is necessar y to understand t he vertical structure of t he wi nd system , although direct obser vation is di fficult. Ther efore, anal ys i s based on obser vati onal data was often perfor med f or t ypical cases. As one example, the convergence/ di vergence of the surface wind in multiple cases was obtained
from Automat ed Meteorological Data Acquisition System ( AMeDAS) of the Japan Meteor ologi cal Agency (JMA) , and t he di urnal variat ion in the convergence/ di vergence fiel d and the char acteristic local wind system wer e examined (Takahashi, 1998) . However, suff icient anal ysis of t he relationship between local wi nd systems related t o the for mati on of the ESB based on obser vational dat a have not been perf o r med; t hus f urther st udy on the structure of each l ocal wi nd system is necessar y.
The purpose of thi s st udy is to examine t he relati onship bet ween the l ocal wind systems, temperature distribution, and a synoptic fi eld ( such as the prevaili ng wi nd and pressur e patter n), and t o deter mine t he changes i n t he synoptic fiel d that ar e related to t he str uct ures of the wind syst ems over the Kanto Plai n, where an increase i n the t emperature has been obser ved in recent years. To understand the vertical structure of the wind system, the convergence/ di vergence fiel d of the sur face wind obt ained fr om detail ed obser vational dat a i s used . Convergence and di vergence ar eas of the surface wind are thought to correspond to t he upward and dowanwar d fl ow areas in the l ower at mospheric layers based on the continuous equati ons assuming an incompressible gas. Thus, the y ar e used as the index for t he verti cal movement of the at mosphere, whi ch i s di f fi cult to obser ve di rectl y.
2. Data and method 2.1. Data used
In additi on to t he A MeDAS obser vational data, weather data fr om Mariti me Inf or mation and Communication Syst em ( MICS) of the Japan Oceanographic Data Cent er and data from air pollution monitori ng s t ation s of each prefect ural government were al so used to underst and t he wi nd sys tem in detail. The peri od of data used were Jul y and August from 1979 to 2011 ( i .e., 33 year s); cases of sunny summer days , when t he local wind system is expect ed to appear, ar e also incl uded . The distributi on of obser vatories used for the anal ysi s and t he st udy area are shown in Fi g. 1.
Obser vat ories are considered t o be different locations if the distance between t hem exceeds a certain amount (latitude –l ongit ude difference of 10 seconds, and a n elevation diff erence of 3 m). Onl y those obser vat ories where the missi ng value s were less than 25% duri ng t he 11 -year inter vals (1979–1989, 1990–2000 and 2001–2011) were used. Obser vatori es wit hin the study area i nclude 65 obser vatori es for AMeDAS, 7 obs er vatories for MICS, and 213 obser vat ories for the air polluti on monitoring s tati ons. However, in the composite anal ysis conducted by sel ecting specific cases, si nce the missi ng mi ght be concentrated on the cases, onl y those obser vatories wher e the mi ssing val ues were less t han 20% were used. In t his st udy, hourl y data on t he hour are use d, but since the obser vation ti me s differ for MICS obser vatories dependi ng on t he period (e.g. at 25 and 55 mi nutes past ever y hour) , data from 20 min utes bef ore and after the hour were used. Overall ,
87% of t he M ICS dat a used for the anal ysi s were taken bet ween 10 min utes before and aft er t he hour.
For temperat ure analysis, data from AMeDAS and the air polluti on monitoring station s were used. Considering t hat the measurement environment s of air pollution monitoring s t ations ar e di fferent fr om t hose of AMeDAS obser vat ori es, air poll ution monitoring s tati ons with si gnificant difference in measurement temperature s compar ed to AMeDAS were excluded.
The average temperat ures (at 15: 00 JST) at AMeDAS obser vat ories i n each prefect ure on sunny li ght -wind days (di scussed in secti on 2.5 ) were obtained.
Then, onl y the air pol lution monitori ng s tat ions i n each prefectur e were used with t he f ollowing conditions: t he avera ge val ue of temperature deviation from average temper ature at AMeDAS is within ±1 °C , the maxi mum and mini mum value is wit hin ±6 °C and the number of days when the deviati on i s within ±4 °C ar e more than 95% of sunny li ght -wind days. Because fewer locations have data for temperat ure than wind, data from AMeDAS obser vatories t hat have not moved f or 31 years or l onger wer e connected and used. Temperat ures were not correct ed for el evati on, and obser vat ories located at an elevation of 200 m or l ess were used f or temperat ure anal ysis ; 51 obser vatories for AMeDAS and 53 obser vat ories of air poll ution monitoring stations . Obser vat ories used f or the anal ysis of temperatur e are shown i n Fi g. 2.
For the anal ysis of pr essure patter ns and temper atu re field around Japan , the dail y average val ue of sea level pressure, surface wi nd and temperatur e
data from the Japanese 25 -year Reanalysis and JMA Cli mate Data Assi milati on System (JRA -25/JCDAS) wer e used ( Onogi et al., 2007) . In additio n, t o examine that t he convergence/di vergence fi eld of the surface wind corr espond s to the verti cal flow i n t he lower at mospheric layers, the anal ysi s data produced by t he operational Mesoscal e Model (MSM) of JMA was also used.
2.2. Estimation of roughness parameter and correction of wind speed To underst and the wi nd system in detail , multi ple obser vational data are used. However, the height of anemometer varies f or each obser vator y, and it is not appr opriate to use these obser vational values for t he calculating t he amount of convergence/di vergence. The ver tical profil e of wind s peed withi n the surface layer depends on the r oughness of the gr ound surface. When the at mospheric stabilit y is neutral, wind speed profil e i s expressed by t he logarithmic law (e.g., Kondo, 1999 ). Therefore, t he hei ght of anemomet er at each obser vat or y and the r oughness parameter are applied t o a wind -speed correcti on equation based on the l ogarit hmi c law of wi nd speed ( Equati on 1), and t he wind speed at the standar d hei ght ( 50 m) is esti mated fr om the hourl y obser ved wi nd:
(1)
wher e is t he obser vational hei ght , is the st andard hei ght , is the obser ved wi nd speed, is t he wind speed f or the st andard hei ght, and is the roughness par ameter. Based on t his met hod, Kondo et al . ( 1991) defined
the r epresentati ve wi nd speed equi valent t o the wind speed at 50 m above gr ound, which i ncludes the effects of l ocal t opography and ground conditi ons of the surr ounding ar ea . In this study, the amount of convergence/di vergence is calculat ed on the basis of this wi nd speed, and the standard hei ght at which the wind speed is obt ained was set at 50 m above gr ound.
To obtai n t he roughness parameter, the vert ical profile of wind speed and air te mperature must generall y be obser ved by obser vation tower s, but it i s difficult t o do so at numerous obser vat ori es (Kondo and Yamazawa, 1983).
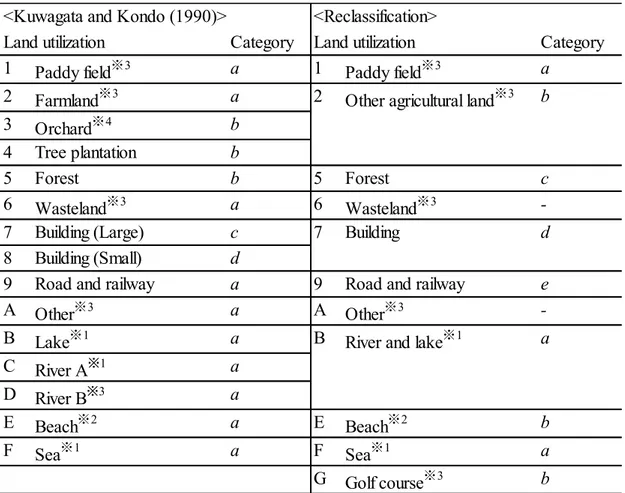
Kondo and Yamazawa (1986) used an e xperi mental equation to show t he relationship between roughness paramet er obtained thr ough obser vations at several obser vat ories and t he land use conditions of the surr ounding area. In this st udy, t he met hod of esti mation pr opos ed by Kuwagata and K ondo (1990) and land utili zation data around t he obser vatories were used to esti mat e t he roughness par ameter at each obser vat or y ( Seto and Takahashi , 2011) . Land utili zation data suppl ied by the Mi nistr y of Land, Infrastr ucture, Transport and Tourism, Japan , and the 1976, 1987, 1997, and 2006 editi ons of “ National Land Numerical Inf or mation (land use fr agment ed mesh data)” was used . This data cover s t he whole Kanto regi on at a spatial resol ution of approxi matel y 100 m.
First, t he t ypes of land use were cl assified on the basis of the charact eristics of the ground surface conditions and the r oughness length.
Table 1 shows t he land use t ypes fr om the l and use dat a and t he classification categori es used i n Kuwagata and Kondo (1990). Next , as t he area that affect s
the obser ved wind by surface r oughness , we consi dered t he ar ea with a radi us 100 ti mes t he obser vational hei ght ( maxi mum of 2.5 km) with t he obser vator y at the center. Then, the area f or each land use t ype around an obser vator y was measured using Geogr aphic Infor mation System ( GIS) , and the ar ea ratios of each cat egor y w ere substitut ed int o the experi ment al equation in order t o obtain the roughness parameter 0 (cm) . However, the roughness parameter for t he homogeneo us gr ound surf ace condition is obtained separatel y, as indicated in Table 1. Equati on 2 pr esent s t he experi ment al equation for the 1976 land use data that was used by Kuwagata and Kondo (1990) :
(2)
wher e to are the ar ea r atios of each cat egor y in 1976, as shown in Table 1. However, in the data obtained i n 1987, 1997, and 2006, t he cl assification of agricultural land and building sites (excluding paddy fields) are diff erent from the land use dat a obt ained in 1976, and the roughness parameter cannot be esti mated. Thus, Seto and Takahashi (2011) conduct ed a multiple regressi on anal ysis using the roughness paramet er i n 16 di fferent wind directions at 181 observatories in t he Kant o region obtained from the data in 1976 as the dependent variables, and the area ratio s of each category obtai ned by recl assif ying t he l and use t ype as the i ndependent variabl es. Then, t hey created an experi ment al equati on that all ows the esti mation of the roughness parameter applicabl e fo r all the years ( Equation 3):
(3)
wher e to are t he area rati os of each cat egor y after recl assifi cation, as shown in Table 1. The det er minati on coefficient of this experi mental equati on is 0.80, and numbers below the d eci mal poi nt in each coeffi cient and constant ter m were rounded. Moreover, as golf courses were not present in the data prior t o t he r eclassifi cation, they were tr eated i n t he same manner as ot her agricult ural land. To i mpr ove t he fit in the regressi on ana l ysis, t wo land use types (wasteland and other land uses) are excluded f rom t he area calculation.
In thi s st udy, roughness parameter is obt ained f or each obser vatory for each year usi ng Equation 3, and the wind speed was correct ed using t he roughness parameter of 1976 for 1979 –1981, 1987 f or 1982 –1991, 1997 for 1992 –2001, and 2006 f or 2002 –2011.
In thi s st udy, wi nd speed correction based on t he logarithmic law assumes that the at mospheric stabilit y is neutr al. Thus, when the at mospher e is unstable con dition on sunny summer days, an error mi ght occur in the wi nd speed correcti on . Set o and Takahashi ( 2011) corrected the wi nd speed i n the same way. Then, they compar ed the esti mated values wit h t he measur ed values usi ng t he obser ved wi nd speed fr om multipl e hei ghts at the sa me location and showed t hat t he err or bet ween the esti mated and measured wind speed is not si gnificant even when the at mospheric st abilit y is not neutral. If the wind speed is cor rected taki ng at mospheric stabilit y in to considerati on, the vertical profil e of temperat ure at each obser vat or y must be considered;
thus, t he correction method becomes complex. Moreover, i n this st udy, the data wer e put i nto gri d points (discussed i n the next section), and locali zed
effects at each obser vator y were spatiall y averaged. Based on these factors, it was deter mi ned t hat wind speed can be corrected without considering the at mospheric stabilit y.
Fi gur e 3 shows the obser vational hei ght of the wind speed for each obser vator y i n 1981 and 200 9. These years were selected because there were unavailable obser vatories due t o the movement in the first and last two years of the peri od . There are not many obser vator ies that have large di fferences i n the obser vati on al hei ght from year to year. At some obser vatori es wher e the obser vational hei ght i s low, t he amount of wind speed correction can be large . In order to prevent t hat the amount of t he correction is extremel y large , when the obser vati onal hei ght is 10 m or less, a correction was made as sumi ng that the obser vational hei ght was 10 m. Fi gure 4 shows the r oughness parameter for each obser vat or y f or each year, and t he correcti on fact or for adj usting the obser ved wi nd speed to the wi nd speed at the standar d hei ght ( 50 m). The correcti on f actor of wind speed corr esponds t o the coeffi cient for in Equati on 1 and can be obtai ned if obser vational hei ght and r oughness parameter of each obser vator y are det er mi ned. Roughness par ameter is large in t he ur ban areas of the Tokyo Metr opoli tan area , medium in t he suburbs, and small in the coastal areas and ar eas with far ming such as r ice paddies . Compared wit h 1976, in 1987, 1997, and 2006, ob ser vatories wit h roughness parameter exceedi ng 90 cm increased in Saitama Prefect ure, wester n Tokyo, and nort hwestern Chiba Prefect ure. This change li kel y accompanies the expansion of urban areas i n recent year s. The correcti on factor shoul d
increase when t he r oughness parameter is l arge and t he obser vat ional hei ght is low. In t he are as with incr eased roughness par ameter, the correcti on factors i ndeed showed an increasing trend. Despit e t he large roughness parameter i n Tokyo, many obser vatories had a l ow corr ect ion f actor. This is likel y because ther e are many obser vatories wit h hi gh obser vati onal hei ght s.
In t his st udy, to r emove the eff ects of obser vational hei ght var iance, the obser ved wind was corrected to the wind speed at the st andard hei ght based on the representati ve wind speed. Changes in the r oughness parameter are consi dered t o make the correcti on based on the l and use abou t every 10 years.
Since representati ve wind speed includes t he effects of land features around the obser vatories, alt hough smaller than t he obser ved wind, the effect on wind speed associat ed with urbani zati on i s included. However, by maki ng correcti ons with consideration gi ven t o the change i n r oughness par ameter, long-ter m changes in the wind sy st em due to ant hropogenic eff ects will be inconspicuous and we are able t o capt ure the change due to nat ural fact ors. In addition, t he di fferences of the effect on wind speed associated with urbani zation at each obser vat or y will be removed. Fi gure 5 shows t he differences between 1981 and 2009 in t he wind speed at the hei ght of anemometer f or each obser vator y, calculated from the correct ion fact or shown in Fi g. 4 , when the wind speed at t he standard hei ght is 10 m/s . The differences of the effect on wind speed due to t he changes i n roughness parameter are small (withi n 0.3 m/ s) at many obser vatori es . However, the wind speed decr eased (appr oxi matel y 1 m/s) on the areas wi th i ncreased
roughness parameter and l ow obser vational hei ght , such as the coast of Tokyo Bay.
2.3. Calculating the amount of convergence/divergence
Befor e cal culating t he amount of convergence/di vergence, wind -speed corrected wind data were put i nto grid point s in order t o spatiall y average t he local effects incl uded in the obser ved wi nd at each obser vat or y. A method was used in whi ch vector averages wei ghted by reci procal number of t he distance from the obser vator y to the gri d point were treated as t he grid poi nt value for wind at all obser vat ories l ocated within a certai n distance fr om each gri d point (Takahashi , 1998). Gri d po ints were established wit h inter vals of 0.072° i n t he latit udi nal dir ection and 0.088° i n the longitudinal directi on (approxi matel y 8 km), and wi nd at obser vat ories locat ed within a radius of 16 km from each gri d point was refer en ced. The grid point i nter vals and t he reference radius were deter mi ned in order to obtain the meaningful distributi on of the wi nd and convergence/ di vergence even in areas with fewer obser vatories , such as the norther n Kanto region . The amount of convergence/ di vergence at each grid poi nt was obtained by appl ying the plane approxi mation method to the wi nd surrounding 25 grid poi nts ( withi n a radius of 23 km). The pl ane approxi mati on met hod (Tanaka et al., 1997) di vides the wind int o an east –west and a north –sout h component, and the zonal and the meridi onal wind ar e fitted on a plane using the least -square method , r especti vel y. Then, based on the r ate of change of each component ,
the amount of convergence/ di vergence is obtained.
2.4. Methods for the analyses
First, in or der to identif y t he days under synopti c conditi ons when t he local wind system is expected to appear, sunny li ght -wind days were select ed.
For t hese select ed cases, composi te anal ysis of wind and convergence/ di vergence field was conducted. Temporal changes in the charact eristics of t he aver age wi nd and di vergence /convergence fiel d on sunny li ght -wind days were exami ned. Next, i n order to extr act the spati al pattern with large vari ation in the convergence/di vergence field , t hat changes due to the variati on i n l ocal wind system development and the effects of the prevaili ng wind, pri ncipal component anal ysis was conducted for hourl y convergence/ di vergence amount at dayti me on sunny li ght -wind days.
Further more, cl uster anal ysis was appl ied to the obtained pri ncipal component scor es i n order to classif y t he sunny li ght -wi nd days. From these anal yses, the cause of predominant changes in t he convergence/ di vergence amount can be i nvest igated. The charact er istics of t he wind system pattern can also be exami ned fr om t he perspecti ve of local wind cir culation t hat changes the convergence/di vergence amount and variations in t he prevaili ng wind.
The relationship with the pressure gradient and the char acteristi cs of the wind system, and convergence/ di vergence f ield on each cl assified categor y were examined. The decadal changes in t he appearance fr eq uency of each
categor y have also been exami ned . Along with deter mini ng the wi nd vari ation trend i n recent years , the changes in t he pressure patterns that cause the wi nd system changes have been consi dered . Characteri stics of the temperatur e distributi on closel y associated wit h the wi nd fi eld have also been examined, and through t he decadal changes in t he synoptic fiel d, effects of t he wi nd system changes on t he temperatur e fi eld in t he Kanto Pl ain have been consi dered.
2.5. Selection of sunny light -wind days
Because di urnal vari ation in l ocal wind systems is not disti nct when prevaili ng winds are strong, selecti on of “sea breeze days ” on whi ch t he local wind system characteristi cs become apparent while prevaili ng wind i s weak are oft en perf or med ( e.g., Yoshi kado 1978; Borne et al. 1998) . In this study, sunny li ght -wind days when the local wind system is expect ed to appear were selected . 369 sunny l ight -wind days were selected from Jul y and August i n 1979–2011 based on the foll owi ng crit eria: the geostr ophi c wind speed obtained f rom t he pressure gradient was 6 m/s or less, and more than 8 hours of sunshine durati on and less t han 1 mm of dail y precipitati on w ere obser ved at more than 7 of el even JMA st ations located in t he Kant o Plain (Fi g. 6) . Since the sunshine r ecorder was changed bet ween 1986 and 1990 (Jordan st yle to rota ti ng mirr or st yle), t he threshol d sunshine duration was set t o 7.2 hours after this change.
As a representati on of prevailing wind in the study area, geostrophic wind
speed was calcul ated usi ng Equation 4 by obtaini ng the pressure gradient from the dail y mean s ea level pressur e from meteorol ogical obser vatori es by fitting t he plain usi ng the l east -squar e met hod:
(4)
wher e is t he geostrophic wind speed, (=1.225 kg/ m3) is the ai r densit y for standar d at mosphere conditions at sea level , (=7.292×10- 5 rad/s) is the angul ar velocit y of rot ation of the Earth , is the latit ude (36 °N), and is the magnit ude of t he pressure gradient (Pa/ m). For the obser vatories f or sea l evel pressure, 7 JMA stations (based on Fuj ibe, 2003) —Onahama, Choshi, Katsuura, Ir ozaki, Takada, Ai kawa, and Ni igata —which surround the Kant o Plain al ong the coast al areas where t he eff ects on dayti me pressure fall ar e small were selected ( Fi g. 6) .
3. Wind patterns and divergence field on sunny light -wind days 3.1. Distribution of wind and divergence field
First, t o under stand usual wi nd patterns and characteristics of areas of convergence/ di vergence on sunny li ght -wind days, a composite anal ysis was conducted i n which the wi nd and the amount of convergence/di vergence during 369 sunny li ght -wind days were aver aged over each hour.
Fi gur e 7 shows the di stribution of wind and convergence/di vergence ever y 2 h from 09:00 to 17:00 on sunny li ght -wi nd days. At 09:00 ( Fig. 7a) , t he wind speed was gener all y low, but the sea breeze blowing orthogonal t o the coastline was obser ved i n Sagami Bay, Suruga Bay, and Tokyo Bay. In contrast , di vergence area existed along the prefect ural bor der of Gunma and Saitama, whi ch was t hought to correspond to the valley breeze circulation, and the wind systems existed blowing towar d the mountai ns. Weak nort heast wind was also bl owi ng from Sait ama Prefecture to wester n Tokyo.
At 11:00 ( Fi g. 7b) , sea and va ll ey breezes developed si gnificantl y and wi nd speeds incr eased in al most all the areas. In the Tokyo Metropolit an area , by 09:00 (Fi g. 7a) , the sea breeze t hat was li mi ted to the coastal ar eas , bega n to blow over a wi de area , while a convergence area that was li kel y corresponded to t he sea br eeze fr ont for med from east ern Kanagawa Pr efect ure to t he Tokyo Metropolit an area . A di vergence area clearl y developed in Tokyo Bay and t he wester n part of Sagami Bay, and wind blew from di vergence area to convergence a r ea. We can t heref ore assume the existence of the sea breeze circulation t hat the downwar d flow at t he di vergence area blew toward the
convergence area and flows upward ther e. In t he norther n Kanto region , valley br eezes devel oped and southeast wind was i ntensifi ed . In southern Saitama Prefect ure, however, although the wind directi on changed t o southeast, rel ati vel y weak wind area still r emai ned. Th i s weak wind area was located on t he inland side of the sea breeze front t hat blew across the Tokyo Metropolit an area , and corresponded to t he area with weak wind for med i n front of th e area wher e the sea breeze fr ont sta gnat ed i n the inl and side of the urban area , as the air pressur e in the Tokyo Metropolit an ar ea became lower than that of the subur bs (Yoshi kado and Kondo , 1989; Yoshi kado, 1990). T he di vergence area from the pref ectural bor der of Gunma and Saitama to Tochi gi Prefect ure showed ex pansi on compared t o 09:00 ( Fi g. 7a) and the amount of di vergence also incr eased. Further mor e, fr om Chi ba to I bar aki Prefect ures , discontinuit y was noted bet ween east wind from Kashi ma -nada and south wind from Tokyo Bay, creati ng a convergence area.
At 13: 00 ( Fi g. 7c) , sea breeze was intensifi ed and the wind speed increase d from Tokyo Bay and nearby coast as well as from souther n Saitama to Kanagawa Pr efectur es. On the other hand , t he center of t he convergence area near the Tokyo Metr opolitan area sli ghtl y shifted inl and . The weak wi nd ar ea near Saitama Prefect ure became i ndisti nct around this ti me, but winds tended to be weaker t han the surroundi ng area. Amount of convergence/ divergence i n the areas, where si gnificant convergence/di vergence were noted in t he mor ning, maxi mi zed around thi s ti me.
Wind i n the whol e K anto r egion was strongest from 15:00 (Fi g. 7d) t o
17:00 ( Fi g. 7e) . Sea breeze fr om Kashi ma -nada increased as well, but the wind di rection changed sli ghtl y t o southeast, and the di scontinuity of wind direction obser ved in the i nland area beca me indistinct ar ound t hi s ti me. Th is change of wi nd direct ion was explai ned by Yoshi kado (1976) as t he merging of the sea breezes from Kashi ma -nada and Kuj ukuri -hama accompanyi ng t he expansion of t he hor izontal scale of sea breeze . The sout herl y wind fr om Tokyo Bay and the east erl y wi nd from the Pacific Ocean were ob ser ved along the pref ectural bor der of Chiba and Ibaraki , and a c onvergence area was for med her e. In addition, wind convergence existed i n the Tokyo Metropolit an area and near t he prefectur al border of Tokyo and Saitama during the day, appearing t o surround Tokyo Bay. As the ESB devel oped, convergence/ di vergence area s correspondi ng to the si gnificant sea breeze circulation in the mor ning and t he di vergence ar ea near t he prefectural bor der of Gunma and Saitama corresponding t o valley br eeze circul ation graduall y decreased in t he area and became weaker.
3.2. Characteristics of the variation pattern of divergence
Temporal change s in t he amount of convergence/di vergence in the dayti me and di urnal variati ons in the amount of convergence/ di vergence are affect ed by diurnal variations in the prevaili ng wind and l ocal wind system devel opment . A si gni ficant spatial variati on patter n was theref ore extracted from t he dail y convergence/ di vergence fiel ds, and the cau ses for the principal variations in t he amount of convergence/di vergence were examined to
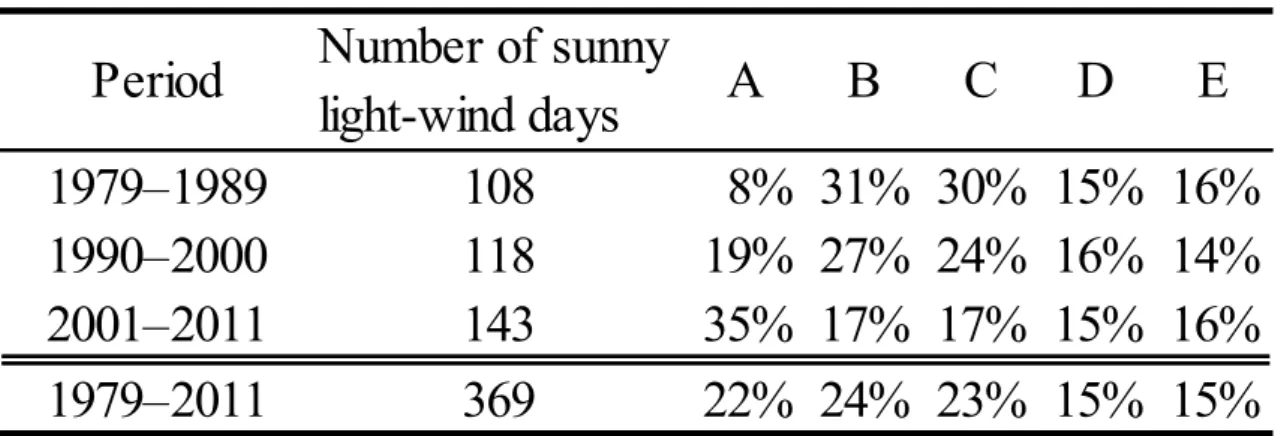
classif y the sunny li ght -wind days from t he perspecti ve of the local wind circulation and synoptic field variations. At the same ti me, it i s thought that the converge nce/ di vergence field change s along wit h the decadal changes in the wind syst em; thus, the decadal changes in the appear ance f requency of classified wi nd systems on sunny li ght -wi nd days can also be discussed. The empiri cal ort hogonal function (EOF) anal ysis , also called pri ncipal component anal ysis , was conducted on the hourl y amount of convergence/ di vergence between 09:00 and 17:00 on sunny li ght -wind days in the Kanto Plai n in order t o exami ne the princi pal variatio n pattern of convergence/ di vergen ce fiel d on sunny li ght -wi nd days. The hourl y convergence/ di vergence amount in grid points at an elevation of 200 m or lower was used. Any gri d poi nts where val ues coul d not be obtained due t o missi ng within 10 days at each grid point were inter polated wit h the aver age values of all t he other sunny li ght -wind days.
Fi gur e 8 shows the di stribution of t he fact or loadi ng of the EOF anal ysis for the first t o thi rd principal components, and Fi g ure 9 shows the ti me seri es of the hourl y mean EOF score of each principal component. EOF scores ar e indicated by t he values nor mali zed by the st andard devi ati on of each principal component . The contributi on rate of each principal component was 13.4% for the first principal component, 11.2% for the second pri ncipal component , and 7.5% for the third pr incipal component . Cumulati ve contribution up t o t he third pri ncipal component was 32.1% and was not ver y large. However, since the diurnal variation in the EOF scores for the f ourth
and latt er principal components is unclea r, t he fir st to thir d principal components wer e used in this st udy. Furt her more, the days when the EOF score for each hour was an average value plus st andard deviati on of 0.5 or more (average val ue minus 0.5 standard deviation or l ess) wer e defined as days with positi ve anomal y (or days with negati ve anomal y) for each hour.
For ever y 2 h fr om 09: 00 to 17:00, the distribution of wind and convergence/ di vergence amount on days wi th positi ve and negati ve anom al y for each princi pal component are shown i n Fi g s. 10 to 15.
The first princi pal compone nt had a spatial patter n with negati ve factor loading fr om Kanagawa Prefecture to the prefect ural border of Tokyo and Chiba, and positi ve f actor loading for east ern Sa it ama Pr efect ur e and Chi ba to Ibaraki Pr efectur e s. Thi s di stributi on corresponded t o t he border of convergence and di vergence areas that t ypi call y appear ed i n the dayti me on sunny li ght -wi nd days . EOF scores showed a diurnal variati on wi th a positi ve peak at 10: 00 and a negati ve peak at 16:00. On days wit h positi ve anomal y at each hour ( Fi g. 10) , compared wit h an aver age of sunny li ght -wi nd days (Fi g.
7), southerl y sea breeze was weak. Yet, on days wit h negati ve anomal y (Fi g.
11), sout herl y sea breeze became pr edomi nant and the wind speed increased.
Penetr ation of t he sea br eeze front ont o t he i nland area was f ast as well . Based on t hese factor s, it is thought that t he first pri ncipal component was related to t he diur nal variati on in sea br eeze development and temporal variations of each case, and indi cate d t he nort h–south variations of the convergence and di vergence areas of t he sea breeze f ront .