Evaluation of Efficiency of Reservoir Sediment Flushing in Kurobe River
Tetsuya SUMI1
1 Member of JSCE, Associate Professor, Dept. of Civil and Earth Resources Eng., Kyoto University (Katsura, Nishikyo-ku, Kyoto, 615-8540, Japan)
E-mail: [email protected]
From viewpoint of the comprehensive sediment management in a sediment routing system, it is important to select appropriate sediment management strategy in each storage reservoirs. In the Kurobe River, coordinated sediment flushing operations of Dashidaira and Unazuki dams have been executed since 2001. These flushing operations have advantages on effective use of river water to discharge sediment using sediment erosion and transport phenomena by temporal reservoir drawdown operation.
If examining reservoirs satisfy suitable conditions, this sediment flushing operation is one of the most attractive methods from the point of view of necessary costs and contribution for sediment supply to downstream. Possibility to apply this sediment flushing operation to reservoirs is largely dependent on the sediment flushing efficiency (Fe =S/W) that is defined by the sediment volume (S) and the water consumption (W). The sediment flushing efficiency changes widely by various factors such as configuration of reservoir, elevation of sediment scouring gates, volume and grain size of deposited sediment, discharge rate during sediment flushing, duration time from the start of draw down flushing and so on. In order to forecast the sediment flushing efficiency, it is important to analyze erosion process of sediment in reservoirs.
In this paper, the coordinated sediment flushing of Dashidaira and Unazuki dams in the Kurobe river that is the representative case of sediment flushing in Japan is discussed, and the effective operation and the sediment flushing efficiency are studied through by monitoring of erosion process of deposited sediment in Dashidaira and Unazuki reservoir.
Key Words : Reservoir sediment management, sediment flushing, flushing efficiency, Kurobe river
1. APPROPRIATE SELECTION OF RESERVOIR SEDIMENT
MANAGEMENT
Sediment management in reservoirs is largely classified into three approaches: 1) to reduce sediment inflow to reservoirs, 2) to route sediment inflow so as not to accumulate in reservoirs, and 3) to remove sediment accumulated in reservoirs.
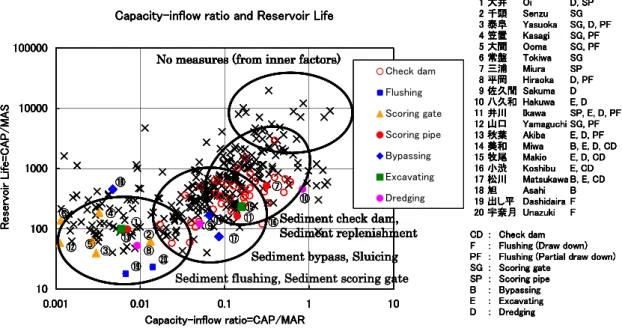
Fig.1 shows Japanese large dams, higher than 15m and larger than one million m3 storage volume, that are plotted by the parameter of the turnover rate of water (CAP/MAR=Total capacity/Mean annual runoff) and sediment (CAP/MAS=Total capacity/Mean annual inflow sediment).
In Fig.1, existing practice of sediment management in reservoirs can be specified referring to these parameters. It is understood that selected measures have changed in order of the sediment flushing, the sediment bypass, sediment check dam and excavating, and dredging as CAP/MAR increases (decrease in the turnover rate) roughly.
This is because the sediment management measures are greatly dependent on the volume of water that can be used for the sediment transport. Here, the quality of sediment (size etc.) and the river environmental conditions which may restrict the sediment discharge are not considered.
It is important to clarify the range that the sediment flushing or the sediment bypass that uses the tractive force for the sediment discharge can be applied for selecting the sediment management strategy. Especially, it is a trade-off in the sediment flushing between maximizing sediment discharge and minimizing environmental impacts on the downstream river.
2. THE COORDINATED SEDIMENT FLUSHING IN KUROBE RIVER
(1) Project outline
Unazuki dam, completed in 2001 by the Ministry of Land, Infrastructure and Transport, and Dashidaira dam, completed in 1985 by the Kansai
D-18
Fourth International Conference on Scour and Erosion 20081 大井 Oi D, SP 2 千頭 Senzu SG 3 泰阜 Yasuoka SG, D, PF 4 笠置 Kasagi SG, PF 5 大間 Ooma SG, PF 6 常盤 Tokiwa SG 7 三浦 Miura SP 8 平岡 Hiraoka D, PF 9 佐久間 Sakuma D 10 八久和 Hakuwa E, D 11 井川 Ikawa SP, E, D, PF 12 山口 Yamaguchi SG, PF 13 秋葉 Akiba E, D, PF 14 美和 Miwa B, E, D, CD 15 牧尾 Makio E, D, CD 16 小渋 Koshibu E, CD 17 松川 Matsukawa B, E, CD
18 旭 Asahi B
19 出し平 Dashidaira F 20 宇奈月 Unazuki F CD : Check dam F : Flushing (Draw down) PF : Flushing (Partial draw down) SG : Scoring gate
SP : Scoring pipe B : Bypassing E : Excavating D : Dredging
Capacity-inflow ratio and Reservoir Life
10 100 1000 10000 100000
0.001 0.01 0.1 1 10
Capacity-inflow ratio=CAP/MAR
Reservoir Life=CAP/MAS
Check dam Flushing Scoring gate Scoring pipe Bypassing Excavating Dredging
②
①
⑤ ③
⑥
⑧
⑦
⑨
⑰
⑩
⑪
⑫ ⑬
⑱
⑮
⑯
⑲ ⑳
④ ⑭
No measures (from inner factors)
Sediment check dam, Sediment replenishment Sediment bypass, Sluicing Sediment flushing, Sediment scoring gate
1 大井 Oi D, SP
2 千頭 Senzu SG 3 泰阜 Yasuoka SG, D, PF 4 笠置 Kasagi SG, PF 5 大間 Ooma SG, PF 6 常盤 Tokiwa SG 7 三浦 Miura SP 8 平岡 Hiraoka D, PF 9 佐久間 Sakuma D 10 八久和 Hakuwa E, D 11 井川 Ikawa SP, E, D, PF 12 山口 Yamaguchi SG, PF 13 秋葉 Akiba E, D, PF 14 美和 Miwa B, E, D, CD 15 牧尾 Makio E, D, CD 16 小渋 Koshibu E, CD 17 松川 Matsukawa B, E, CD
18 旭 Asahi B
19 出し平 Dashidaira F 20 宇奈月 Unazuki F CD : Check dam F : Flushing (Draw down) PF : Flushing (Partial draw down) SG : Scoring gate
SP : Scoring pipe B : Bypassing E : Excavating D : Dredging
Capacity-inflow ratio and Reservoir Life
10 100 1000 10000 100000
0.001 0.01 0.1 1 10
Capacity-inflow ratio=CAP/MAR
Reservoir Life=CAP/MAS
Check dam Flushing Scoring gate Scoring pipe Bypassing Excavating Dredging
②
①
⑤ ③
⑥
⑧
⑦
⑨
⑰
⑩
⑪
⑫ ⑬
⑱
⑮
⑯
⑲ ⑳
④ ⑭
No measures (from inner factors)
Sediment check dam, Sediment replenishment Sediment bypass, Sluicing
1 大井 Oi D, SP
2 千頭 Senzu SG 3 泰阜 Yasuoka SG, D, PF 4 笠置 Kasagi SG, PF 5 大間 Ooma SG, PF 6 常盤 Tokiwa SG 7 三浦 Miura SP 8 平岡 Hiraoka D, PF 9 佐久間 Sakuma D 10 八久和 Hakuwa E, D 11 井川 Ikawa SP, E, D, PF 12 山口 Yamaguchi SG, PF 13 秋葉 Akiba E, D, PF 14 美和 Miwa B, E, D, CD 15 牧尾 Makio E, D, CD 16 小渋 Koshibu E, CD 17 松川 Matsukawa B, E, CD
18 旭 Asahi B
19 出し平 Dashidaira F 20 宇奈月 Unazuki F CD : Check dam F : Flushing (Draw down) PF : Flushing (Partial draw down) SG : Scoring gate
SP : Scoring pipe B : Bypassing E : Excavating D : Dredging
Capacity-inflow ratio and Reservoir Life
10 100 1000 10000 100000
0.001 0.01 0.1 1 10
Capacity-inflow ratio=CAP/MAR
Reservoir Life=CAP/MAS
Check dam Flushing Scoring gate Scoring pipe Bypassing Excavating Dredging
②
①
⑤ ③
⑥
⑧
⑦
⑨
⑰
⑩
⑪
⑫ ⑬
⑱
⑮
⑯
⑲ ⑳
④ ⑭
No measures (from inner factors)
Sediment check dam, Sediment replenishment
1 大井 Oi D, SP
2 千頭 Senzu SG 3 泰阜 Yasuoka SG, D, PF 4 笠置 Kasagi SG, PF 5 大間 Ooma SG, PF 6 常盤 Tokiwa SG 7 三浦 Miura SP 8 平岡 Hiraoka D, PF 9 佐久間 Sakuma D 10 八久和 Hakuwa E, D 11 井川 Ikawa SP, E, D, PF 12 山口 Yamaguchi SG, PF 13 秋葉 Akiba E, D, PF 14 美和 Miwa B, E, D, CD 15 牧尾 Makio E, D, CD 16 小渋 Koshibu E, CD 17 松川 Matsukawa B, E, CD
18 旭 Asahi B
19 出し平 Dashidaira F 20 宇奈月 Unazuki F CD : Check dam F : Flushing (Draw down) PF : Flushing (Partial draw down) SG : Scoring gate
SP : Scoring pipe B : Bypassing E : Excavating D : Dredging
Capacity-inflow ratio and Reservoir Life
10 100 1000 10000 100000
0.001 0.01 0.1 1 10
Capacity-inflow ratio=CAP/MAR
Reservoir Life=CAP/MAS
Check dam Flushing Scoring gate Scoring pipe Bypassing Excavating Dredging
②
①
⑤ ③
⑥
⑧
⑦
⑨
⑰
⑩
⑪
⑫ ⑬
⑱
⑮
⑯
⑲ ⑳
④ ⑭
No measures (from inner factors)
1 大井 Oi D, SP
2 千頭 Senzu SG 3 泰阜 Yasuoka SG, D, PF 4 笠置 Kasagi SG, PF 5 大間 Ooma SG, PF 6 常盤 Tokiwa SG 7 三浦 Miura SP 8 平岡 Hiraoka D, PF 9 佐久間 Sakuma D 10 八久和 Hakuwa E, D 11 井川 Ikawa SP, E, D, PF 12 山口 Yamaguchi SG, PF 13 秋葉 Akiba E, D, PF 14 美和 Miwa B, E, D, CD 15 牧尾 Makio E, D, CD 16 小渋 Koshibu E, CD 17 松川 Matsukawa B, E, CD
18 旭 Asahi B
19 出し平 Dashidaira F 20 宇奈月 Unazuki F CD : Check dam F : Flushing (Draw down) PF : Flushing (Partial draw down) SG : Scoring gate
SP : Scoring pipe B : Bypassing E : Excavating D : Dredging
Capacity-inflow ratio and Reservoir Life
10 100 1000 10000 100000
0.001 0.01 0.1 1 10
Capacity-inflow ratio=CAP/MAR
Reservoir Life=CAP/MAS
Check dam Flushing Scoring gate Scoring pipe Bypassing Excavating Dredging
②
①
⑤ ③
⑥
⑧
⑦
⑨
⑰
⑩
⑪
⑫ ⑬
⑱
⑮
⑯
⑲ ⑳
④ ⑭
No measures (from inner factors)
Sediment check dam, Sediment replenishment Sediment bypass, Sluicing Sediment flushing, Sediment scoring gate
Fig. 1 Representative sediment control examples in Japan (Relationship between capacity-inflow ratio and reservoir life)
1,600-
1,400-
1,200-
1,000-
800-
600-
400-
200-
0 10-
20- 30-
40- 50-
60 km-
The distance from the sea.
Altitute
m
Kurobe dam 1,448.000
Sen-nin dam 851.000
Koyadaira dam 529.400
Dashidaira dam 343.000 Unazuki dam
245.000
Aimoto Shimokurobe 1,600-
1,400-
1,200-
1,000-
800-
600-
400-
200-
0 10-
10- 20- 20-
30- 30-
40- 40-
50- 50-
60 km- 60 km-
The distance from the sea.
Altitute
m
Kurobe dam 1,448.000
Sen-nin dam 851.000
Koyadaira dam 529.400
Dashidaira dam 343.000 Unazuki dam
245.000
Aimoto Shimokurobe
Fig.2 Kurobe river basin
Fig.3 Unazuki dam and Dashidaira dam
electric power co. are both located in the downstream of Kurobe river basin (Fig.2). They have been constructed as the first dam with full- scale sediment flushing gates in Japan in place of securing 100 years’ sedimentation volume since extremely a lot of sediment volume compare to these possible reservoir capacities was expected (Fig.3). Sediment flushing also has the following purposes; 1) sustaining these original functions such as flood control and hydro power, 2) maintaining sediment routing system in the basin. Actually, beach erosion progresses in the downstream coastal areas and the necessity of the sediment supply is extremely high.
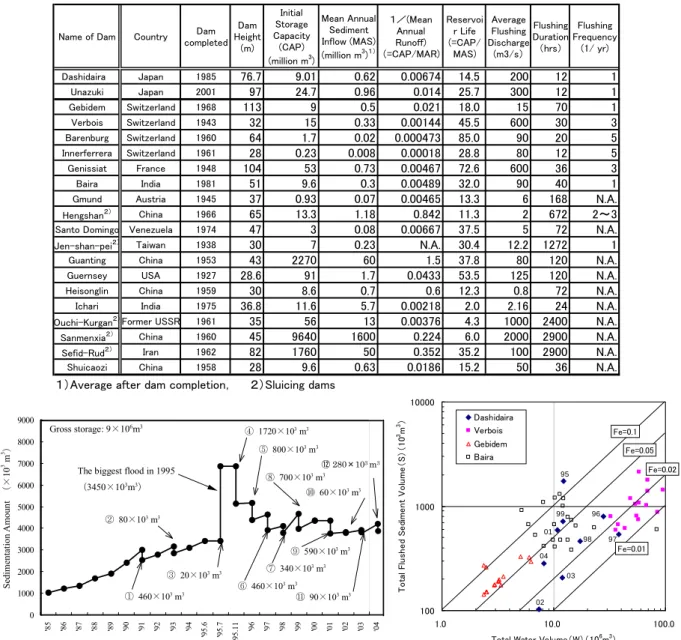
In Dashidaira dam, the sediment flushing of 18 times in total have been carried out by July, 2007, and the sediment of 6 million m3 or more that equaled to 2/3 or more of the total reservoir capacities in total was discharged as in Fig.4. In
addition, after completion of Unazuki dam, a coordinated sediment flushing of these dams have started and the sediment flushing of 7 times and sediment sluicing of 7 times have been carried out up to July, 2007. The sediment flushing is executed at the first major flood event every year and the sediment sluicing is done at the successive bigger ones by the same reservoir operation to prevent additional sediment deposit in the reservoir.
At present, sediment flushing operation in the Kurobe river is aiming at maintaining a constant bed form without storing sediment in the reservoir as much as possible by executing at the natural flood events between June and August. As a result, the water quality deterioration such as at the sediment flushing in 1991 doesn’t occur recently and it contributes to maintain the reservoir capacity greatly. The present rule that executes the sediment flushing according to the natural flood in a constant
Table 1 Sediment flushing dams in the World
Name of Dam Country Dam completed
Dam Height
(m) Initial Storage Capacity (CAP) (million m3)
Mean Annual Sediment Inflow (MAS) (million m3)1)
1/(Mean Annual Runoff)
(=CAP/MAR) Reservoi
r Life (=CAP/
MAS) Average Flushing Discharge
(m3/s)
Flushing Duration
(hrs)
Flushing Frequency
(1/ yr)
Dashidaira Japan 1985 76.7 9.01 0.62 0.00674 14.5 200 12 1
Unazuki Japan 2001 97 24.7 0.96 0.014 25.7 300 12 1
Gebidem Switzerland 1968 113 9 0.5 0.021 18.0 15 70 1
Verbois Switzerland 1943 32 15 0.33 0.00144 45.5 600 30 3
Barenburg Switzerland 1960 64 1.7 0.02 0.000473 85.0 90 20 5
Innerferrera Switzerland 1961 28 0.23 0.008 0.00018 28.8 80 12 5
Genissiat France 1948 104 53 0.73 0.00467 72.6 600 36 3
Baira India 1981 51 9.6 0.3 0.00489 32.0 90 40 1
Gmund Austria 1945 37 0.93 0.07 0.00465 13.3 6 168 N.A.
Hengshan2) China 1966 65 13.3 1.18 0.842 11.3 2 672 2~3
Santo Domingo Venezuela 1974 47 3 0.08 0.00667 37.5 5 72 N.A.
Jen-shan-pei2) Taiwan 1938 30 7 0.23 N.A. 30.4 12.2 1272 1
Guanting China 1953 43 2270 60 1.5 37.8 80 120 N.A.
Guernsey USA 1927 28.6 91 1.7 0.0433 53.5 125 120 N.A.
Heisonglin China 1959 30 8.6 0.7 0.6 12.3 0.8 72 N.A.
Ichari India 1975 36.8 11.6 5.7 0.00218 2.0 2.16 24 N.A.
Ouchi-Kurgan2)Former USSR 1961 35 56 13 0.00376 4.3 1000 2400 N.A.
Sanmenxia2) China 1960 45 9640 1600 0.224 6.0 2000 2900 N.A.
Sefid-Rud2) Iran 1962 82 1760 50 0.352 35.2 100 2900 N.A.
Shuicaozi China 1958 28 9.6 0.63 0.0186 15.2 50 36 N.A.
1)Average after dam completion, 2)Sluicing dams
0 1000 2000 3000 4000 5000 6000 7000 8000 9000
'85 '86 '87 '88 '89 '90 '91 '92 '93 '94 '95.6 '95.7 '95.11 '96 '97 '98 '99 '00 '01 '02 '03
① 460×103 m3
② 80×103 m3
③ 20×103 m3
④ 1720×103m3
⑤800×103m3
⑥ 460×103m3
⑦340×103m3
⑧700×103m3
⑨590×103m3
⑩60×103m3
⑪90×103m3 Sedimentation Amount(×103 m3)
Gross storage: 9×10⁶m3
The biggest flood in 1995
(3450×103m3)
‘04
⑫280×103 m3
100 1000 10000
1.0 10.0 100.0
Total Water Volume(W)(106m3) Total Flushed Sediment Volume(S)(103m3) Dashidaira
Verbois Gebidem
Baira Fe=0.05
Fe=0.02
Fe=0.01 Fe=0.1
95
96
97 98 99 01
02 03 04
Fig.4 Sedimentation volume change in Dashidaira dam Fig.5 Water volume and flushed sediment volume in sediment flushing dams
frequency so that the interval should not become longer agrees well with the findings in Switzerland and France that have longtime results for the sediment flushing. It becomes a good reference to promote the reservoir sedimentation management in the future very much.
(2) Sediment flushing efficiency
Furthermore, it is a very much interest how much efficiencies have been obtained by these sediment flushing operations.
Table 1 shows sediment flushing dams in
the world. Among them, the relation between the water consumption and the amount of the sediment flushing was shown in Fig.5 about four dams, Dashidaira dam in Japan, Gebidem and Verbois dams in Switzerland and the Baira dam in India, where each flushing result was recorded. Here, the water consumption for the sediment flushing is only calculated during the fully draw down period though the fine sediment discharge actually starts from the reservoir drawdown period and this water volume should be included in the water consumption.
Figure shows sediment flushing efficiency (Fe
=S/W) calculated by the sediment volume (S) and the water consumption (W). Among them, sediment flushing efficiency in Gebidem dam is comparatively high since the sediment flushing is executed with a low flow discharge for a long time.
Moreover, in Baira dam, flushing efficiency is also comparatively high though there are some fluctuations. On the other hand, since Verbois dam is located at the mainstream of the Rhône River and the sediment flushing is executed with a large amount of water from Lac Léman, the sediment flushing efficiency is not large. In Dashidaira dam, though there are great fluctuations in the amount of the flushing sediment and the water consumption, the flushing efficiency is not so high similarly to Verbois dam except one after the big flood in 1997.
In these four dams, the sediment flushing is strictly managed in Dashidaira and Verbois dams so as not to cause a remarkable water quality change to the downstream river by maintaining considerably a lot of water discharge compare to the amount of sediment. As a result, in consideration of the downstream river environment, enough volume of water is required so that the flushing efficiency may be decreased. In the sediment flushing of Kurobe River, the sediment flushing is executed by securing enough river discharge just after the natural floods and also the additional discharge is recently examined to wash out the fine sediment silted in the downstream river channel and thus the sediment
flushing needs more volume of water.
The sediment flushing efficiency of other dams is shown in Fig.6. The sediment flushing efficiency is about Fe =0.01-0.15, and it thought to be decreased to about Fe =0.05 or less when consideration to the river environment is especially necessary.
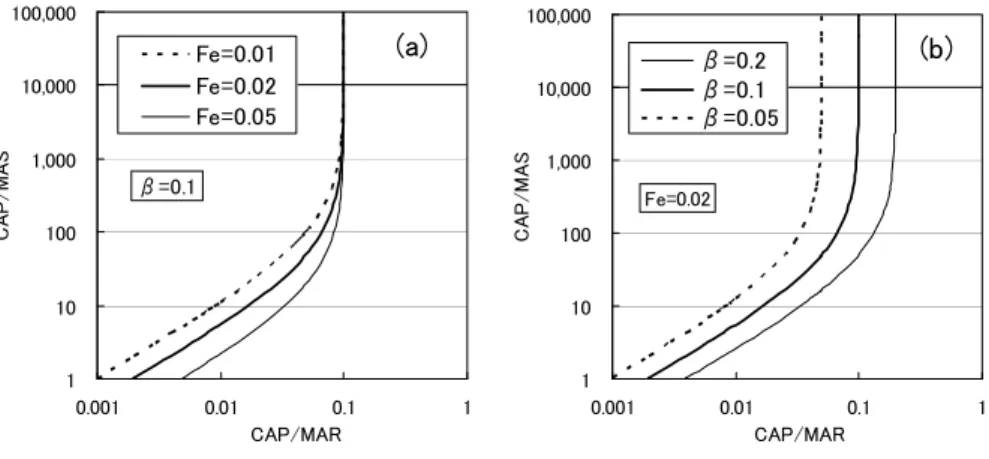
(3)Feasibility evaluation of the sediment flushing According to the research on the feasibility evaluation of the sediment flushing, a possible range of the sediment flushing can be obtained by the following equation by the parameters shown in Fig.1. Here, the sediment flushing efficiency and the proportion of the water consumption by the sediment flushing to the mean annual runoff volume (MAR) are defined Fe and β respectively.
⎟⎠
⎜ ⎞
⎝⎛ − MAR F CAP
MAR CAP MAS
CAP
e β
> (1)
In Fig.7 (a) and (b), possible range of the sediment flushing in the case where Fe changes to 0.01, 0.02 and 0.05 under the fixed β=0.1, and in the case where β changes to 0.05, 0.1, 0.2 under the fixed Fe =0.2 are shown respectively. Sediment flushing is feasible in the left side of each line.
According to them, the change in Fe mainly influences within the small range of CAP/MAS and even a small turnover rate of the reservoir, e.g. large CAP/MAR, becomes a possible increase of Fe under constant β. If the river environmental is considered, possible range of the sediment flushing becomes narrower because Fe should be estimated low. On the other hand, if β can be increased, the sediment flushing possibility will be increased under the same Fe since the water volume ratio for the sediment flushing increases. However, β and the original storage purposes of the reservoir are in the relation of the trade-off and too large β can not be assumed.
Even in Dashidaira dam, β are ranging between 0.01 and 0.07 from 2001 to 2007 actually.
0 0.05 0.1 0.15 0.2
Flushing efficiency Fe
Da s hi da i ra Gebi dem V erboi s B a i ra B a renburg F errera Santo Dom i ng o J en-s ha n-pei Sef i d-R ud Shui ca ozi
Fig. 6 Sediment flushing dams and flushing efficiency
3. EVALUATION OF THE SEDIMENT FLUSHING EFFICIENCY BY MONITORING OF SEDIMENT FLUSHING PROCESS
As we can find in Figs.5 and 6, the sediment flushing efficiency changes widely by various factors such as configuration of reservoir, elevation of sediment flushing gates, volume and grain size of deposited sediment, discharge rate during sediment flushing, duration time from the start of draw down flushing and so on. In order to forecast the sediment flushing efficiency, it is important to understand the erosion process of sediment in reservoirs. Photo 1 shows erosion process of deposited sediment in Dashidaira reservoir in 2003. We can find that longitudinal and lateral erosions created by river bed degradation and side bank erosion.
Recently, we have conducted field measurements of sediment erosion process with 3D laser scanning technology in Unazuki reservoir (Sumi, Murasaki, Fujinaga, Nagura and Tamaki, 2004, Sumi, Murasaki, Nagura, Tamaki and Imaki, 2005). The 3D laser scanner used for the measurement is shown in Photo 2. Side bank erosion process of sand bars formed in the Unazuki reservoir and water surface profiles near by banks have been measured as shown in Fig.8. By these data, we could estimate that side bank of the height of 1.0-1.2m was eroded with the speed of 7.5m/hr.
Slope of water surface is also estimated as 1/75 and water waves generated by the anti-dune are also observed. Since the bed morphological change where water and sandbars exist together complicatedly can be also measured even in a night time, this technique can be used to understand sediment transport in a reservoir and to estimate the sediment volume flushed out by the operation.
Time and spatial variations of reservoir surface velocities during drawdown and flushing period
were also measured by PIV (Particle Image Velocimetry) using CCTV camera and image data processor (Sumi, Murasaki, Taira, Shinbo, Nagura, and Tamaki, 2007). These data can be converted to actual velocities by the 3D laser scanner data. Both reservoir water level and flow velocity changing during the drawdown and flushing period are very much helpful for us to understand sediment erosion and discharge processes from the reservoir.
From the viewpoint of the comprehensive sediment management in a sediment routing system, monitoring of quantity and quality of sediment transport during these flushing events in rivers and reservoirs is also very important. Field observation was carried out to measure suspended sediment concentration (SS) both by the manual sampling and SMDP (Suspended Sediment Concentration Measuring System with Differential Pressure Transmitter), turbidity by a turbidimeter for high sediment concentrations and grain size distribution (Sumi, Baiyinbaoligao and Morita, 2007). Based on these data, movement of the suspended sediment load discharged from Unazuki dam during flood, flushing and sluicing periods were clarified.
1 10 100 1,000 10,000 100,000
0.001 0.01 0.1 1
CAP/MAR
CAP/MAS
β=0.2 β=0.1 β=0.05
Fe=0.02
(b)
1 10 100 1,000 10,000 100,000
0.001 0.01 0.1 1
CAP/MAR
CAP/MAS
Fe=0.01 Fe=0.02 Fe=0.05 β=0.1
(a)
Fig. 7 Possible range of the sediment flushing
((a) Proportion of the water consumption to the mean annual runoff volume β is fixed; (b) Sediment flushing efficiency Fe is fixed)
Photo 1 Sediment Flushing in Dashidaira Reservoir
4. CONCLUSION
The conclusions of this paper are as follows.
1) From viewpoint of the comprehensive sediment management in a sediment routing system, it is important to select appropriate sediment management strategy in each reservoir. Existing practices of sediment management in reservoirs can be specified referring to the parameter of the turnover rate of water and sediment.
2) In Kurobe River, coordinated sediment flushing operations of Dashidaira and Unazuki dams have been successfully executed since 2001 and these flushing operations are contributing to sustain these original functions such as flood control and hydro power and to maintain sediment routing system in the basin.
3) Possibility to apply the sediment flushing operation to reservoirs is largely dependent on the sediment flushing efficiency that is defined by the sediment volume and the water consumption. The sediment flushing efficiency changes widely by various factors such as configuration of reservoir, elevation of sediment scouring gates, volume and grain size of deposited sediment, discharge rate during sediment flushing, duration time from the start of draw down flushing and so on.
4) In order to forecast the sediment flushing efficiency, it is important to understand the erosion process of sediment in reservoirs such as longitudinal and lateral erosions created by river bed degradation and side bank erosions.
5) 3D laser scanning technology and PIV are useful to monitor sediment erosion process in a
reservoir and to evaluate the sediment flushing efficiency.
REFERENCES
1) Atkinson, E.: The feasibility of flushing sediment from reservoirs, Report OD137, HR Wallingford, 1996.
2) Morris, G.L. and Fan, J.: Reservoir sedimentation handbook, McGraw Hill Publishes, New York, 1998.
3) Sumi, T., Murasaki, M., Fujinaga, K., Nagura, Y. and Tamaki, H.: Study on Measurement of Erosion-Deposition Process of Reservoir Sediment during Flushing Operation, Annual Journal of Hydraulic Eng., JSCE, Vol.48, pp.1147- 1152, 2004(Japanese).
4) Sumi, T., Murasaki, M., Nagura, Y., Tamaki, H. and Imaki, T.: Study on Measurement of Erosion-Deposition Process of Reservoir Sediment during Flushing Operation (Part 2), Annual Journal of Hydraulic Eng., JSCE, Vol.49, pp.1033- 1038, 2005(Japanese).
5) Sumi, T. and Iguchi M.: Technical Feasibility Study of Sediment Flushing in Reservoirs using the RESCON Model, Journal of Japan Society of Dam Engineers, 15(2), pp.92-105, 2005(Japanese).
6) Sumi, T., Takata, Y., Iguchi M. and Nakanishi, Y.:
Feasibility Study of Sediment Flushing Operation in Reservoirs using the RESCON Model, Advances in River Engineering, JSCE, Vol.11, pp.285-290, 2005 (Japanese).
7) Sumi, T. and Kanazawa, H.: Environmental Study on Sediment Flushing in the Kurobe River, 22nd International Congress on Large Dams, Barcelona, Q.85-R.16, pp.219-242, 2006.
8) Sumi, T., Baiyinbaoligao and Morita, S.: Characteristics of Fine Sediment Discharge during Sediment Flushing of Unazuki dam, Journal of Hydroscience and Hydraulic Engineering, JSCE, Vol.25, pp.99-106, 2007.
9) Sumi, T., Murasaki, M., Taira, K. Shinbo, K. Nagura, Y. and Tamaki, H.: Study on Measurement of Fine Sediment Discharge Process during Sediment Flushing using PIV, Annual Journal of Hydraulic Eng., JSCE, Vol.51, pp.1075- 1080, 2007(Japanese).
10) White, W. R., Attewill, L., Ackers, J. and Wingfield, R.:
Guidelines for the flushing of sediment from reservoirs, Report SR 566, HR Wallingford, 2000.
Section 5 Line 7
(Riegle LMS-Z210) 2-300m, 2.5cm
accuracy Unazuki dam Sand bar
Side bank
Ononuma
in Unazuki reservoir
3D laser scanner
Section 5 Line 7
(Riegle LMS-Z210) 2-300m, 2.5cm
accuracy Unazuki dam Sand bar
Side bank
Ononuma
in Unazuki reservoir
3D laser scanner
Photo 2 Sediment Flushing in Unazuki Reservoir and 3D laser scanner
縦断面7_水面勾配
-24.4 -24.2 -24 -23.8 -23.6 -23.4 -23.2
0 5 10 15 20 25 30
15:02 15:15 15:30 15:44 16:01 16:16 16:31 16:45 17:00
Water surface: Line 7
断面5_側岸変化図
-24.4 -24.2 -24 -23.8 -23.6 -23.4 -23.2 -23 -22.8 -22.6 -22.4
20 25 30 35 40 45
15:02 15:15 15:30 15:44 16:01 16:16 16:31 16:45 17:00 (m)
(m)
Side bank slope; Section 5
Side bank Sand bar
Water surface
Waterwaves generated by the antidune
縦断面7_水面勾配
-24.4 -24.2 -24 -23.8 -23.6 -23.4 -23.2
0 5 10 15 20 25 30
15:02 15:15 15:30 15:44 16:01 16:16 16:31 16:45 17:00
Water surface: Line 7
断面5_側岸変化図
-24.4 -24.2 -24 -23.8 -23.6 -23.4 -23.2 -23 -22.8 -22.6 -22.4
20 25 30 35 40 45
15:02 15:15 15:30 15:44 16:01 16:16 16:31 16:45 17:00 (m)
(m)
Side bank slope; Section 5断面5_側岸変化図
-24.4 -24.2 -24 -23.8 -23.6 -23.4 -23.2 -23 -22.8 -22.6 -22.4
20 25 30 35 40 45
15:02 15:15 15:30 15:44 16:01 16:16 16:31 16:45 17:00 (m)
(m)
Side bank slope; Section 5
Side bank Sand bar
Water surface
Waterwaves generated by the antidune
Fig.8 Process of the side bank erosion and water surface changes in the channel