C09
Three-dimensional Numerical Modeling of Free-flow Sediment Flushing: a case study in Kurobe
River
〇Taymaz ESMAEILI, Tetsuya SUMI, Sameh A. KANTOUSH
1. Introduction
The loss of reservoir storage volume due to the sediment deposition reduces the dam’s effective life time and also diminishes the reservoir function for flood control purpose, hydropower generation, irrigation and water supply which represents a substantial economic loss (Morris and Fan, 1998; Shen, 1999). Various measures including sediment dredging, sediment routing, bypassing, flushing, sluicing and upstream sediment trapping have been used to control the progressive sedimentation in reservoirs. Of all the mentioned measures, flushing plays a major role in reservoir storage capacity restoration since it is an efficient hydraulic technique for sediment removal (Liu et al., 2004). In Japan, generally, the sediment yield by rivers is high due to the geologically young mountains, steep slope, and flashy flow regimes as well as wide spread landslides. Consequently, incoming sediment loads to the reservoirs fed by these rivers are high (e.g. Kurobe River located in Toyama prefecture).
Drawdown flushing involves a complete lowering of the water level by opening the low-level outlet to temporarily establish riverine flow (i.e. free flow) towards the outlet. The accelerated flow erodes a channel through the deposits and flushes out both fine and coarse sediment (Morris and Fan, 1998). Because of the sufficient rain fall, economic advantages through independency from the other facilities, and potential for high efficiency, drawdown flushing is feasible in reservoirs located across the Kurobe River (e.g. in Dashidaira reservoir). However, sediment flushing in reservoirs located across the Kurobe River is a challenging work because of the significant difference of grain size distribution in upstream and downstream areas of the reservoir. While the upstream areas are covered with gravel and cobble sized bed materials, fine type sediments (e.g. small sand, silt and
clay) have been widely distributed in the downstream areas.
Dashidaira dam with 76.7 (m) height has been constructed in 1985 by Kansai Electric Power Company across the Kurobe River and sediment flushing operation has been performed since 1991 through the bottom outlets (Liu et al., 2004; Minami et al., 2012). Although Dashidaira reservoir is a narrow shaped, there is a wide middle segment in the reservoir. The flushing channel characteristics (e.g. location, shape and size) in this segment have a considerable contribution in preserving the reservoir storage capacity and enhancing the flushing efficiency. Thus, it is important to have an assessment of the impacts of an upcoming drawdown flushing operation and morphological bed changes in the reservoir to conduct a sustainable sediment management strategy. Numerical models were developed as an alternative to avoid scaling problems of physical models and also because of an expected time and cost reduction (Chandler et al., 2003).
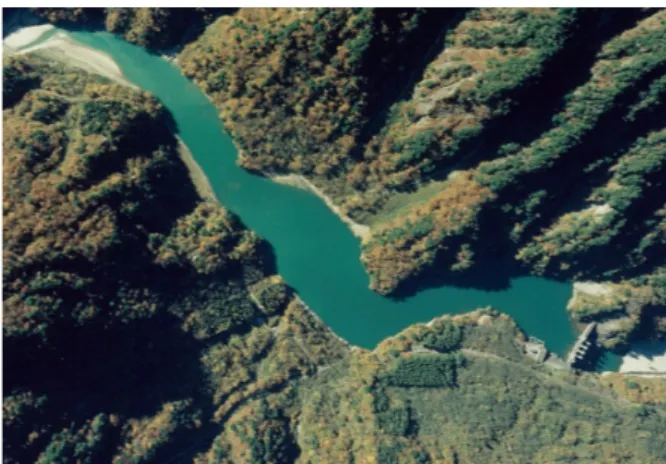
An aerial photo from Dashidaira reservoir has been illustrated in Figure 1. The narrow shape and meandering form of the channel can be clearly observed.
Fig. 1 Aerial photo of Dashidaira reservoir taken in the almost full water level condition
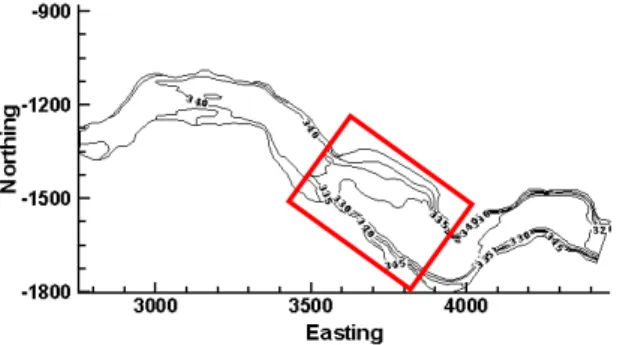
Figure 2 shows the topographic map of Dashidaira reservoir which was extracted from the surveying data before the sediment flushing operation in 2012.
In the present study a fully 3D numerical model was employed to simulate the free- flow flushing process in Dashidaira reservoir conducted in 2012. Measured bed levels before and after the flushing operation were used for the model verification purpose. A sensitivity analysis was carried out including different bed load transport formulas (e.g. Van Rijn and Meyer-Peter-Müller) to discover the effect of mainly empirical parameters on the calculated morphological bed changes.
2. Numerical model
The applied Computational Fluid Dynamic (CFD) code solves the mass conservation equation together with the Reynolds-averaged Navier-Stokes equation to compute the water motion for turbulent flow in three dimensions. The finite volume approach is employed, as discretization scheme. The convective term in the Reynolds-averaged Navier-Stokes equations is solved by a second order upwind scheme. The turbulence is modeled by the standard k-ε model, using the constant empirical values.
The grid is non-orthogonal, unstructured and adaptive which moves vertically with changes in the bed and free-water surface. Thus, just the water body is modeled. The grid is regenerated after each time step and an employed wetting/drying algorithm enables the model to have a varying number of grid
cells (e.g. in vertical direction) with respect to the changes in water and bed level. The wetting/drying algorithm eliminates cells with a smaller water depth than a defined boundary.
3. Conclusions
A 3D Numerical model can properly simulate the flushing channel evolutionary pattern under the real boundary conditions (e.g. unsteady hydrodynamic conditions). Both Van Rijn and MPM bed load sediment transport formulas can represent the volume of flushed out sediment during the flushing process in a certain range. MPM formula provides a better prediction of bed level variation in the upstream area covered by the coarser materials. On the other hand, Van Rijn’s formula showed a better performance in areas closer to the dam in where the bed is mainly covered with the fine material and also the reservoir is deeper. Also, the helical flow and consequent erosion and deposition pattern in channel bends could be identified by the model, which represents an advantage over 2D modeling.
References
Chandler, K., Gill, D., Maher, B., Macnish, S. and Roads, G. (2003): Cooping with maximum probable flood-an alliance project delivery for Wivenhoe Dam, Proceedings of 43rdconference, Hobart, Tasmania. Liu, J., Minami, S., Otsuki, H., Liu, B., and Ashida, K. (2004): Prediction of Concerted Sediment Flushing, Journal of Hydraulic Engineering, ASCE, Vol. 130, No. 11, pp. 1089-1096.
Minami, S., Noguchi, K., Otsuki, H., Fukuri, H., Shimahara, N., Mizuta, J., and Takeuchi, M. (2012): Coordinated sediment flushing and effect verification of fine sediment discharge operation in Kurobe River, Proc. ICOLD conference, Japan, Kyoto.
Morris, G. L., and Fan, J. (1998): Reservoir Sedimentation Handbook: Design and Management of Dams, Reservoirs and Watersheds for Sustainable Use, McGraw-Hill, New York.
Shen, H. W. (1999): Flushing sediment through reservoirs, Journal of Hydraulic Research, Vol. 37, No. 6, pp. 743-757.
Fig. 2 Measured topography of Dashidira reservoir before the flushing event. The wide middle segment