Isl1β over-expression with keyβ cell
transcription factors enhances
glucose-responsive, hepatic insulin production
and secretion
著者
Jung Yunshin
year
2018
その他のタイトル
Isl1βと膵β細胞に重要な転写因子の過剰発現は、
肝臓でのグルコース応答性インスリン産生及び分泌
を促進する
学位授与大学
筑波大学 (University of Tsukuba)
学位授与年度
2017
報告番号
12102甲第8750号
URL
http://doi.org/10.15068/00152259
Isl1β over-expression
with key β cell transcription factors
enhances glucose-responsive,
hepatic insulin production and secretion
(
Isl1β と膵 β 細胞に重要な転写因子の過剰発現は、
肝臓でのグルコース応答性インスリン産生及び分泌を促進する
)
2017
筑波大学グローバル教育院
School of the Integrative and Global Majors in University of Tsukuba
Ph.D. Program in Human Biology
筑 波 大 学
University of Tsukuba
博 士 (人間生物学) 学 位 論 文
Ph.D. dissertation in Human Biology
Isl1β over-expression with key β cell transcription factors
enhances glucose-responsive, hepatic insulin production and secretion
Yunshin Jung
ABSTRACT
Adenoviral gene transfer of key β cell developmental regulators including Pdx1, Neurod1 and Mafa (PDA) has been reported to generate insulin-producing cells in liver. However, PDA insulin secretion is transient and glucose unresponsive. Here, I report that an additional β cell developmental regulator, insulin gene enhancer binding protein splicing variant (Isl1β), improved insulin production and glucose-responsive insulin secretion in PDA mouse. Microarray gene expression analysis suggested that adenoviral PDA transfer required an additional element for mature β cell generation, such as Isl1 and Elf3 in liver. In vitro promoter analysis indicated that splicing variant Isl1, Isl1β is an important factor for transcriptional activity of insulin gene. In vivo bioluminescence monitoring using insulin promoter-luciferase transgenic (MIP-Luc-VU) mice verified that adenoviral PDA-Isl1β transfer produced highly intense luminescence from the liver which peaked at day 7 and persisted for more than 10 days. Using insulin promoter-GFP transgenic (MIP-GFP) mice, I further confirmed that Isl1β supplementation to PDA augmented insulin-producing cells in liver, insulin production and secretion, and β cell related genes. Finally, PDA-Isl1β combination ameliorated hyperglycemia in diabetic mice for 28 days and enhanced glucose tolerance and responsiveness. Thus, my results suggest that Isl1β is a key additional transcriptional factor for processing the generation of insulin producing cells in liver in combination with PDA.
ACKNOWLEDGMENTS
I thank Dr. Manami Hara (The University of Chicago, USA) for kindly providing MIP-GFP mice. I thank Ruyi Zhou for her amazing support in performing many experiments and Toshiki Kato for isolating tremendous number of GFP+ liver cells day and night. I thank Jeffrey K Usui for his active support in discussion and proofreading the manuscript. I thank Dr. Masafumi Muratani for helping me analyze the microarray result and Dr. Hisashi Oishi for helping me carry out this work. I also thank professor Margarete M.S. Heck for active discussion and interpreting the data. I give thanks to professor Satoru Takahashi for supervising me and for endless support and trust. I also thank Mrs. Masami Ojima for her excellent technical assistance and Mrs. Yukiyo Ida for her efficient secretarial assistance.
TABLE OF CONTENTS
Page
Abstract ... 1
Acknowledgement ... 2
Table of contents ... 3
Chapter 1: General introduction ... 5
1.1. Diabetes and β cell generation ... 5
1.2. In vivo β cell generation through direct reprogramming ... 5
1.3. Function of Isl1 in pancreas ... 6
1.4. Overview and Objectives ... 6
Chapter 2: Materials and Methods ... 7
1.1. Animals ... 7
1.2. Adenovirus production and injection ... 7
1.3. Fluorescence-activated cell sorting (FACS) of GFP expressing liver cells ... 7
1.4. Microarray analysis, Promoter analysis, Pathway analysis ... 8
1.5. Heat map and Microarray based filtering algorithm ... 9
1.6. Plasmid construct and Luciferase assay ... 9
1.7. Western blot ... 9
1.8. Bioluminescence imaging ... 10
1.9. Immunohistochemistry ... 10
1.10. Total liver RNA extraction, cDNA synthesis and quantitative Real-time RT-PCR ... 10
1.11. Measurement of insulin content ... 11
1.12. Fed blood glucose and Body weight measurement ... 11
1.13. Diabetes induction ... 11
1.14. Glucose and Hormone Assays ... 11
1.15. Statistical analyses ... 12
Chapter 3: Results 1.1. Microarray analysis of PDA driven insulin-producing cells in liver ... 13
1.3. In vivo validation of additional factor, Isl1β, using MIP-Luc-VU ... 14
1.4. In vivo validation of PDA+Isl1β using MIP-GFP ... 15
1.4.1. Isl1β addition enhanced insulin production and secretion in MIP-GFP mice... ... 16
1.4.2. Overexpression of Isl1β activates key β cell gene expressions……...…16
1.5. Application of PDA+Isl1β in diabetic mice ... 17
Chapter 4: Discussion ... 18
Chapter 5: Figures and Legends ... 22
1.1. Confirmation of PDA adenoviral gene induction in PDA-cell. ... 22
1.2. Isolation and analysis of GFP expressing insulin-producing cells in liver (PDA-cell) using MIP-GFP mice ... 23
1.3. Microarray based filtering algorithm to choose candidate genes in combination to PDA and candidate gene validation. ... 24
1.4. Bioluminescence screening image of combinatorial effects of Isl1β and PDA using MIP-Luc-VU ... 25
1.5. PDA+Isl1β adenoviral treatment increased insulin production and secretion at day 7 in MIP-GFP mice. ... 26
1.6. PDA+Isl1β adenoviral treatment increased insulin production and secretion at day 7 in MIP-GFP mice. ... 28
1.7. Adenoviral gene transfer of PDA+Isl1β increased β cell related genes in liver at day 7. ... 29
1.8. Streptozotocin induced diabetic mice improved glycemic control and response after treating with Ad-PDA+Isl1β. ... 30
Chapter 6: Tables ... 31
1.1. The list of primer and their sequences used in this study ... 31
1.2. The list of antibody used in this study ... 32
Chapter 7: Summary and Conclusion ... 33
Chapter 1: General introduction
1.1. Diabetes and β cell generation
β cell replacement as diabetes treatment is a desirable therapeutic approach. One of the existing β cell sources is human cadaveric pancreatic islet, but lifetime immunosuppressive drug administration and organ scarcity demand alternative supply (1, 2). The ultimate solution is generation of insulin-producing β-like cells that mimic the insulin production and release function of endogenous pancreatic β cells. In vitro β cell generation from induced pluripotent stem cells or embryonic stem cells (iPSC or ESC) (3, 4), although very progressive, has potentially limited clinical application as: 1) The existing genetic diabetic predisposition could affect the cell pluripotency (5, 6); 2) The reprogramming process and subsequent expansion of iPSCs can cause genetic and epigenetic abnormalities, possibly triggering autologous immune response (7, 8); 3) It requires time and money consuming multi-step procedures to produce and maintain sufficient amount of β cell mass and to transplant (9).
1.2. In vivo β cell generation through direct reprogramming
An alternative strategy is in vivo direct reprogramming into β-like cell from extrapancreatic tissues including liver by force-expressing insulin-activating key β cell developmental transcription factors such as pancreatic and duodenal homeobox gene 1 (Pdx1), basic helix-loop-helix transcription factor (Neurod1) and MAF basic leucine
zipper (Mafa) (10–13). Pdx1, a key pancreatic developmental regulator, was reported for the ability of hepatic insulin production transiently, but not of glucose response (10). Neurod1, an endocrine specification regulator, showed higher efficacy in liver insulin production than Pdx1, but glucose stimulated insulin secretion was negligible, even under longer expression (11). Addition of β cell specific maturation marker, Mafa, to Pdx1 and Neurod1, demonstrated greatly increased hepatic insulin production capacity and yet, transient and glucose-unresponsive insulin secretion was not improved (12,13). Taken together, previous studies suggest that this three-gene combination (PDA) was not sufficient to prolong insulin production nor to generate
glucose-responsive β-like cells (10–13) from liver, and thereby requires additional transcription factor.
1.3. Function of Isl1 in pancreas
Insulin enhancer binding protein-1 (ISL-1), a member of LIM-homeodomain family, is a well-known activator of insulin gene (14,15) and essential for the development of pancreas (16). It also plays a crucial role in proliferation, maturation and functional maintenance of pancreatic islet cells including β cell (17–20). Isl1-deficient mice in β cell had shown to fail functional maturation of β cell and consequently developed diabetes (17,19). In particular, Isl1 was reported to physically interact with NeuroD to synergistically activate insulin transcription (21,22)and to directly regulate the gene transcription of Mafa (17) and Pdx1 (19). This supports the approach of Isl1 as a key extrapancreatic insulin producing factor, which was first introduced by Kojima et al.’s study from immature rat intestinal stem cell (IEC-6) (23). Single overexpression of Pdx1 in IEC-6 failed to generate insulin producing cells, which was resolved by additional treatment of Isl1 but without functional maturation (23). However, the role of Isl1 in generating β cell through directly converting mouse liver has not been investigated yet.
1.4. Overview and Objectives
In this study, I report a comparative gene-expression analysis of PDA-driven liver insulin-producing cells for the first time, in order to discover additional element, i.e. Isl1β, Isl1 splicing variant. I then demonstrate that the adenoviral expression of Isl1β, in combination to PDA in mouse liver improved insulin production and glucose-responsive insulin secretion.
Chapter 2: Materials and Methods
1.1. Animals
All experiments were conducted according to the relevant Japanese and institutional law and guidelines and authorized by the University of Tsukuba animal ethics committee (authorization number 13-072). The purchase and maintenance of transgenic mice MIP-Luc-VU [FVB/N-Tg(ins-luc)-VUPwrs/J, #JAX:007800] were described previously (13,24). MIP-GFP transgenic mice expressing green fluorescent protein under mouse insulin 1 promoter were kindly gifted from Dr. Manami Hara (The University of Chicago, USA) and maintained by breeding with Jcl:ICR mice (Clea Japan, Tokyo, Japan) (13). Mice were euthanized at the appropriate time points with carbon dioxide gas.
1.2. Adenovirus production and injection
Recombinant adenoviruses expressing GFP (Ad-GFP), LacZ (Ad-LacZ), polycistronic mouse Pdx1, Nuerod1 and Mafa (Ad-PDA) and mouse Isl1β (Ad-Isl1β) were generated using the ViraPower Adenoviral Gateway Expression kit (Life Technologies) as previously described (13). Polycistronic PDA is linked through P2A and T2A as follows: Pdx1-P2A-Neurod1-T2A-Mafa. Isl1α, Isl1β and Elf3 were cloned from MIN6 cDNA. Isl1β was confirmed by negative PCR amplification from 69 missing base pair sequences in splicing variant.Virus propagation, purification and titer determination were carried out following previously published methods (13). The efficacious adenoviral gene transfer delineates the virus titer of 2.5x10⁹ infectious units. Adenovirus was injected into 7-8 weeks old mice through tail vein at free fed status.
1.3. Fluorescence-activated cell sorting (FACS) of GFP expressing liver cells
At day 7 of adenoviral injection into MIP-GFP mice (25), liver perfusion was conducted under anesthesia. 37°C pre-warmed 0.5 mM EGTA-Hanks buffer (Gibco) was perfused through hepatic portal vein, followed by 1 mg/ml collagenase II (Gibco) containing 5 mM CaCl2-Hanks buffer. Liver was dissected and chopped into
small pieces by scissors, washed with cold Hanks buffer and filtered through 70 µm cell strainer (BD Bioscience). Collected liver cells were centrifuged at 1000 rpm for 1 minute; supernatant was discarded to remove blood cells. Cell pellets were washed with cold Hanks buffer twice. At final washing, cell pellets were re-suspended with 2% FBS, 2 mM EDTA, DMEM (all Gibco) and subjected to FACS (MofloXdp, Beckman) by GFP expression.
1.4. Microarray analysis, Promoter analysis, Pathway analysis
Total RNA was extracted from three MIP-GFP mice and pooled by equal RNA concentrations to synthesize a single cDNA sample from each mouse. Liver and pancreatic islets pooled from 3 mice, without adenoviral infection were used as negative and positive control, respectively. Pancreatic islets were isolated by the standard collagenase digestion protocol using Collagenase type V (Wako), and then hand-picked (26). NucleoSpin RNA kit (Macherey-Nagel) was used to isolate RNA from collected tissues. First-cycle cDNA, cRNA and second-cycle cDNA were synthesized according to the protocol of the Ambion WT Expression Kit (Life Technologies). cDNA was fragmented and labeled using the GeneChip WT Terminal Labeling and Control Kit (Affymetrix) and hybridized to the GeneChip MoGene-1_0-st-v1 cassettes array (Affymetrix), at 45°C for 17 hours. The GeneChip arrays were scanned using the GeneChip Scanner 3000 (Affymetrix). Image files were created using the GeneChip Command Console (Affymetrix); data were normalized using the Affymetrix Expression Console software. Gene expression values were compared by 2-fold cut-off [Fig. 3(a,b)]. Then gene ID was converted using an open web-base tool, Galaxy (#SCR006281) (27) and gene annotation was obtained from UCSI genome browser (28,29). Promoter region of 300 bp upstream was analyzed by the online motif-based sequence analysis tool, the MEME Suite (Motif-based sequence analysis tools, #SCR001783) from “DREME and TOMTOM” (30,31). Pathway analysis was performed through an open-source software DAVID (#SCR001881) using the database of Kyoto Encyclopedia of Genes and Genomes (KEGG, #SCR012773) (32,33).
1.5. Heat map and Microarray based filtering algorithm
Using the sane microarray data set in Figure 2, heatmap was created using an open-source application of microarray software suite, multiexperiment viewer (Tm4: MeV, #SCR001915) [Fig. 2(b)] (34). Venn diagram of microarray scatter plot was created by a free web application, (GeneVenn, #SCR012117) [Fig. 3(c)] (35). Tissue differential expression was verified using an online software tool, Beta Cell Gene Atlas database (T1DBase, #SCR007959) [Fig. 3(d)] (36).
1.6. Plasmid construct and Luciferase assay
Previously constructed pGL2/RIPII-251 plasmid was used for luciferase assay [Fig. 3(g)] (37). Adenoviral vectors pAd-PDA, pAd-Isl1α, pAd-Isl1β and pAd-Elf3 were co-transfected with pGL2 constructs in 293A cell for 24 hours using polyethylenimine (PEI, Polysciences). Luciferase activities were normalized to Renilla luciferase activity according to the Dual Luciferase Reporter Assay System (Promega).
1.7. Western blot
293A cells transfected for 24 hours in luciferase assay were lysed with 20 mM Tris-HCl (pH 7.5), 150 mM NaCl, 1 mM Na2EDTA, 1 mM EGTA, 1% NP-40, 1% sodium deoxycholate, 2.5 mM sodium pyrophosphate, 1 mM β-glycerophosphate, 1 mM Na3VO4, 1 µg/ml leupeptin and complete protease inhibitor cocktail (Roche). Protein concentrations were measured with coomassie protein assay reagent (Thermo Scientific). 20 µg of protein extracts were run on 10% SDS-polyacrylamide gels, followed by electrophoretic transfer to a polyvinylidene difluoride (pvdf) membrane (Merck Millipore). After 1 hour blocking at room temperature with 5% skim milk (Wako), immunoblots were incubated at 4°C in primary antibodies overnight against Pdx1 (Abcam, #AB777178), NeuroD (Santa Cruz, #AB2282474), MafA (Bethyl Laboratories, #AB1279486), Isl1 (DSHB, #AB528315), Elf3 (R&D systems, #AB2278132) and β-actin (MBL, #AB10697035). Blots were then incubated with secondary antibodies for 1 hour at room temperature and proteins were detected using chemiluminescence HRP substrate (Millipore).
1.8. Bioluminescence imaging
At day 0, adenoviruses (Ad-GFP, Ad-PDA, and Ad-Isl1β) were transferred into the MIP-Luc-VU mice (13,24). The bioluminescence signals were detected after 5 minutes of D-luciferin injection (Promega) intraperitoneally with the dosage of 5 mg/kg body weight using an IVIS spectrum (Caliper Life Sciences). Bioluminescence images were obtained within 1 minute integration time. Isometric regions of interest (ROIs) were automatically captured to quantify the signals emitted from the liver by Living Image software (Xenogen Corporation).
1.9. Immunohistochemistry
At 1 week of adenoviral treatment, livers from MIP-GFP mice were collected. Tissue was fixed in 4% PFA on ice for 4 hours, followed by 30% sucrose PBS solution, overnight at 4°C. Fixed liver was embedded in O.C.T compound (Tissue-Tek), frozen and sliced by 5 µm thickness using a cryostat (Leica). Primary antibodies were applied to the sections: anti-Insulin antibody (Abcam, #AB306130), Glucagon (Takara, #AB2619627), Pdx1 (Abcam, #AB777178), anti-NeuroD (Santa Cruz, #AB2282474), anti-MafA (Bethyl Laboratories, #AB1279486) and anti-Isl1 (D41SHB, #AB528315) overnight at 4°C. Secondary antibody conjugated with Alexa 594 or 633 (Life Technology, #AB2534120 or #AB2535739) was incubated with nuclear staining using DAPI (Invitrogen, #AB2307445) at room temperature for 1 hour. Section images were obtained using Biorevo BZ-9000 microscope (Keyence) and BZ-II Analyzer software (Keyence).
1.10. Total liver RNA extraction, cDNA synthesis and quantitative Real-time RT-PCR
Total liver RNA was extracted by using standard Trizol RNA extraction method (ISOGEN). 1 µg of cDNA was synthesized following the protocol of QuantiTect Reverse Transcription kit (Qiagen). Real-time RT-PCR was performed with SYBR Green PCR master mix (Takara) using the Thermal Cycler Dice Real Time system (Takara) to detect gene expression level, and normalized to Hprt. All primer sequences are listed in Table 1.
1.11. Measurement of insulin content
Hepatic insulin contents at 7 days of adenovirus treatment and pancreatic insulin contents at 28 days of STZ induction were extracted using the standard acid-ethanol method as previously described (13,38). Then insulin contents were measured by an insulin enzyme-linked immunesorbent assay kit (Morinaga). Total protein concentration was calculated using coomassie protein assay reagent (Thermo Scientific) to normalize insulin contents.
1.12. Fed blood glucose and body weight measurement
MIP-GFP mice were treated with either Ad-PDA+LacZ or Ad-PDA+Isl1β and analyzed blood glucose after 1 week of adenoviral treatment at free fed status. Fed blood glucose was measured in the late morning after 1 hour of fasting from tail snip. Before 1 hour fasting in the morning, body weight of the animal was measured at day 0, 3 and 7 of adenoviral treatment.
1.13. Diabetes induction
A single injection of streptozotocin (STZ) (Wako) was intraperitoneally administered to 5 weeks old wild-type mice (ICR) to induce diabetes at a dosage of 200 mg/kg body weight dissolved in 0.1 M citrate buffer (pH 4.5). Plasma glucose level was measured with one-touch blood glucometer (Medi-safe-reader, Terumo). After 5 days of STZ induction, hyperglycemic mice are selected by examining fasting blood glucose ( > 200 mg/dl) and fed blood glucose ( > 400 mg/dl). Fasting blood glucose concentration was measured after 16 hours of fasting; fed blood glucose was measured in the late morning after 1 hour of fasting.
1.14. Glucose and Hormone Assays
After 1 week of STZ induction, diabetic animals were administered with one third of standard adenovirus titer. At day 7 of adenoviral treatment, mice were challenged with glucose intraperitoneally after overnight fasting (16 hours) at a dosage of 2 g/kg body weight and measured plasma glucose levels at 0, 15 and 30 minutes and every 30 minutes for 2 hours. Serum insulin was collected at 0 and 30
minutes and measured using an ultrasensitive insulin enzyme-linked immunesorbent assay kit (Morinaga).
1.15. Statistical analyses
All data values are presented as means ± s.e.m. of minimum three independent experiments. Probability values were calculated by using unpaired Student’s t-test or two-way ANOVA followed by Tukey’s Honest Significant Difference for multiple comparison analysis, unless otherwise mentioned. P-values less than 0.05 were considered significant.
Chapter 3: Results
1.1. Microarray analysis of PDA driven insulin-producing cells in liver
In order to analyze the defects of insulin-producing liver cells generated by three key trasncription factors including Pdx1, Neurod1 and Mafa (PDA) at gene level, I injected PDA recombinant adenovirus (Ad-PDA) into transgenic mice which express green fluorescent protein under the control of mouse insulin 1 promoter (MIP-GFP) (25). Based on previous results that PDA gene expression persists after 7 days of infection (13), I isolated GFP expressing cells in liver, extracted RNA and synthesized cDNA from three mice at day 7 of PDA injection [Fig. 1(a)]. After confirming successful PDA gene induction in mouse liver [Fig. 1(b-d)], I compared the expression levels of Ins1 and Ins2 in PDA expressing liver cells (PDA-cell) and pancreatic islet. This data revealed approximately 50-fold differences [Fig. 2(a)] and thus indicate that adenoviral overexpression of PDA in liver is insufficient to activate comparable insulin transcription to mature β cells.
To examine differential gene expression patterns between PDA-cell and pancreatic islet, I conducted microarray gene expression analysis (34) [Fig. 2(b)]. Importantly, PDA-cell did not upregulate most of β cell hallmark genes (4) including Nkx2.2, Pax6, Isl1, Ucn3 and probably endogenous Pdx1 [Fig. 2(b)]. I then designed special primers that exclusively detect endogenous expression of Pdx1, Neurod1 and Mafa from amplifying 3’ UTR region [Fig. 2(c)]. qRT-PCR analysis using the endogenous primers further verified that the expression levels of β cell hallmark genes were negligible [Fig. 2(d)], consistent with microarray results. These data suggest that PDA-cell requires other regulators to improve insulin production and/or glucose responsiveness.
1.2. Screening of additional factor(s) by microarray-based algorithm
In searching for the additional factor for PDA-cell, I devised a filtering algorithm to select islet-enriched genes that were not upregulated in PDA-cell. Firstly, two microarray gene scatterplots showed unique islet-enriched gene profiles in each group [Fig. 3(a,b)]. I obtained 2478 genes by interesting those two different islet-enriched gene sets (A and B from Figure 3(a) and 3(b), respectively), using an open
web application software, GeneVenn (35) to remove background effect caused by adenovirus delivery [Fig. 3(c)]. Next, 87 genes were acquired from overlap of explicit gene expressions in both pancreas and pancreatic islet cells to eliminate genes expressed in pancreatic exocrine tissue but not in islet [Fig. 3(d)]. Tissue expression pattern was then evaluated, which marked 24 genes as pancreatic islet specific, using an open-source software, Beta Cell Atlas (36) [Fig. 3(d)]. These candidate genes were highly expressed in pancreatic islet but undetectable in both hepatocyte and PDA-cell [Fig. 3(e)], further confirmed by qRT-PCR analysis [Fig. 3(f)]. Finally, I selected two transcription factors: Isl1 and Elf3. Because it was reported that splicing variant Isl1 (Isl1β) is more potent insulin activator than canonical Isl1 (Isl1α) and confined to β cell lines (39,40), I decided to examine Isl1β, too. To verify the effects of those transcription factors on insulin expression, I performed in vitro insulin promoter assay using rat insulin promoter II (37), as major regulatory elements are mostly shared between rat insulin promoter II and mouse insulin I promoter [Fig. 3(g)]. Promoter assay clearly showed that Isl1β had the most additive effect on insulin promoter activity [Fig. 3(h)]. Given that expression levels of transfected genes were all similar by western blot [Fig. 3(h)], these data suggest that Isl1β is one of the important transcriptional factors to increase insulin promoter activity in combination with PDA.
1.3. In vivo validation of additional factor, Isl1β, using MIP-Luc-VU
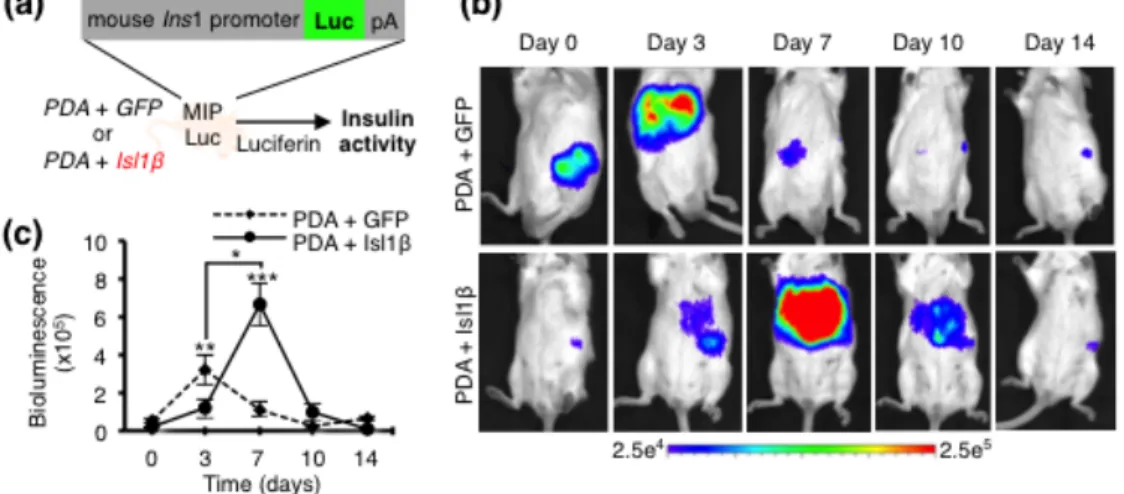
To examine the transcriptional activity of the intrahepatic insulin gene in a noninvasive manner, I monitored the bioluminescence emissions from transgenic mice (MIP-Luc-VU) expressing luciferase under the control of the mouse insulin 1 promoter (24), after adenoviral treatment. I injected adenoviral Isl1β (Ad-Isl1β) into MIP-Luc-VU mice at 8 weeks old age with combination of adenoviral PDA (Ad-PDA). I monitored insulin transcriptional dynamics after luciferin injection (5 mg/kg body weight, IP) into Ad-PDA+Isl1β mouse for two times per week by detecting hepatic signals, emitted from the upper abdomen of the animal [Fig. 4(a)]. Transcriptional activity of hepatic insulin promoter of Ad-PDA+GFP peaked at day 3 and gradually disappeared at day 7 from the liver [Fig. 4(b,c)]. In contrast, hepatic insulin transcriptional peak of Ad-PDA +Isl1β was shifted to day 7 and transcriptional activity lasted over 10 days in the liver, indicating that Ad-PDA+Isl1β treatment
prolonged insulin production through increasing insulin promoter activity about 2-fold compared to control [Fig. 4(c)]. These in vivo results further support that Isl1β is one of the additional key transcriptional factors for insulin production and extension in combination with PDA.
1.4. In vivo validation of Ad-PDA+Isl1β using MIP-GFP
1-4-1. Isl1β addition enhanced insulin production and secretion in MIP-GFP mice.
To further explore additive effects of Isl1β in vivo, I injected adenoviral PDA+Isl1β and PDA+LacZ into MIP-GFP mice (25) at 8 weeks old age. To first confirm the adenoviral gene transfer in liver at day 7, I performed immunofluorescent analysis with each antibody including Isl1β, Pdx1, NeuroD, MafA, Insulin and Glucagon. The results showed that all genes were successfully expressed in liver [Fig. 5(a-c)], and GFP expressing cells were frequently overlapped with Pdx1, NeuroD, MafA [Fig. 5(a-c)] and Insulin signals [Fig. 5(d)] but not with Glucagon [Fig. 5(e)]. Notably, Isl1β signal was well correlated with GFP expressing cells, indicating that Isl1β is important for hepatic insulin production [Fig. 4(a)].
I then compared PDA, Isl1β and Ins1/2 levels by qRT-PCR analysis from day 7 of whole liver RNA, but interestingly, both Insulin and PDA levels were increased by the addition of Isl1β [Fig. 6(a,b)], when the same virus titer of Ad-PDA was delivered to each group. Thus, I first assumed that Isl1β addition would augment hepatic insulin transcriptional activity by increasing GFP expressing cell number and/or GFP intensity. To test this possibility, I quantified GFP expressing cells by FACS after collagenase liver perfusion and GFP expressing cells by Ad-PDA+Isl1β treatment were increased more than 10-fold compared to control [Fig. 6(c)]. Moreover, qRT-PCR analysis of isolated GFP expressing cells showed that Isl1β expression significantly increased the expression levels of Ins1 and Ins2, suggesting that Isl1β contributes to both qualitative and quantitative hepatic insulin production [Fig. 6(d)].
To further evaluate insulin production and secretion properties in mice treated with adenovirus, I measured the contents of both hepatic and plasma insulin. Hepatic insulin contents of Ad-PDA+Isl1β were 1.7-fold higher compared to Ad-PDA+LacZ [Fig. 6(e)]; plasma insulin level was 1.9-fold higher in Ad-PDA+Isl1β mice [Fig. 6(f)].
Consequently, blood glucose level was lower in Ad-PDA+Isl1β mice, but none of the mice fell into hypoglycemic shock nor exhibited abnormal eating behavior as indicated by insignificant body weight differences [Fig. 6(g,h)]. Taken together, those significantly higher levels of hepatic and plasma insulin suggest that the ectopic expression of Isl1β resulted in increased amount of insulin synthesis, processing and secretion in combination with PDA.
1-4-2. Overexpression of Isl1β activates key β cell gene expressions.
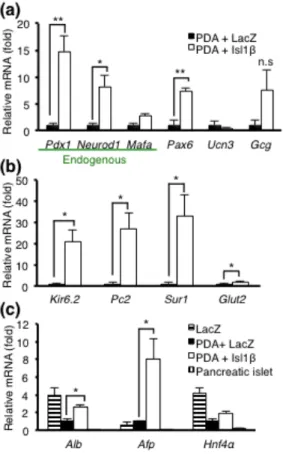
To assess gene expression changes of key β cell and hepatocyte markers in the liver of Ad-PDA+Isl1β, I performed qRT-PCR analysis using total RNA from mouse whole liver. Because, Ad-PDA+Isl1β treatment resulted in an increase of Pdx1 and Neurod1 compared to Ad-PDA+LacZ [Fig. 6(a)], I assumed that Isl1β might activate endogenous expression levels of intrahepatic Pdx1 and Neurod1 as previously reported (41). To address this assumption, I again used specifically designed endogenous primers [Fig. 2(c)] for β cell specific genes, such as Pdx1, Neurod1, Mafa, Pax6, and Ucn3, and an α cell specific marker, Gcg [Fig. 7(a)]. The results confirmed that overexpression of Isl1β upregulated hepatic endogenous genes of Pdx1, Neurod1 and Pax6 but not endogenous Mafa and Gcg significantly, which could be explained by less abundant Isl1 co-factors in liver, required for potent Mafa activation (20,42,43). Moreover, Ad-PDA+Isl1β treatment markedly increased the mRNA levels of β cell functional genes involved in glucose stimulated insulin secretion such as Kir6.2, Pc2, Sur1 and Glut2 [Fig. 7(b)]. Unexpectedly, Isl1β addition also increased hepatocyte markers including Alb, Afp, and Hnf4α, although Alb and Hnf4α levels remained lower than the control liver [Fig. 7(c)]. This result suggests that Isl1β additional treatment does not contribute to liver dedifferentiation at day 7. Taken together, these data indicate that Isl1β assists to obtain several key β cell markers and functional genes, but not to inhibit liver markers, thereby suggesting a partial effect.
1.5. Application of Ad-PDA+Isl1β in diabetic mice
streptozotocin (STZ) into ICR mice, which caused hyperglycemia (higher than 200 mg/dl glucose) after 4 days. I treated mice systemically, 7 days after STZ injection, with Ad-PDA+LacZ, or Ad-PDA-Isl1β adenovirus and monitored fasting blood glucose concentrations for 28 days. Mice treated with Ad-PDA+LacZ initially maintained normal fasting blood glucose levels for one week but progressively increased fasting blood glucose levels [Fig. 8(a)]. In contrast, mice treated with Ad-PDA+Isl1β showed a remarkable decrease in blood glucose levels from 400 mg/dl to below 100mg/dl after adenoviral treatments and maintained blood glucose levels below 200 mg/dl for two weeks, which remained at approximately 200 mg/dl for one month [Fig. 8(a)]. Blood glucose area under the curve (AUC) clearly showed that Ad-PDA+Isl1β treatment ameliorated blood glucose levels more efficiently compared to Ad-PDA+LacZ group [Fig. 8(b)]. At 28 days, I confirmed complete β-cell ablation by demonstrating negligible pancreatic insulin contents from adenoviral treated diabetic mice [Fig. 8(c)], which eliminates residual β cell effects. Because Ad-PDA+Isl1β treatment induced more mature and biologically active hepatic insulin production and secretion, I conclude that hepatic insulin production induced by Ad-PDA+Isl1β decreased blood glucose levels in STZ-induced diabetic mice.
To assess the contribution of Ad-PDA+Isl1β treatments to glucose homeostasis, I performed intraperitoneal glucose tolerance test (IP-GTT, 2 g glucose/kg) after 7 days of adenoviral treatments in STZ-induced diabetic mice [Fig. 8(d)]. Compared to Ad-PDA+LacZ mice, mice treated with Ad-PDA+Isl1β had a marked improvement in glucose clearance after glucose injection [Fig. 8(d)], as it was illustrated by area under the curve [Fig. 8(e)].
To further characterize glucose-stimulated hepatic insulin production and secretion in mice treated with Ad-PDA+LacZ or Ad-PDA+Isl1β in STZ-induced diabetic mice, I measured fasting and glucose-stimulated hepatic insulin. I found that the levels of hepatic insulin in mice treated with Ad-PDA+Isl1β were 1.7- and 2.7-fold higher in both fasting and glucose-stimulated status than Ad-PDA+LacZ group [Fig. 8(f)]. Furthermore, mice treated with Ad-PDA+Isl1β secreted 1.6-fold more insulin following glucose stimulation [Fig. 8(f)], suggesting that Isl1β expression increases the capacity and glucose responsiveness of hepatic insulin-producing cells to release insulin following glucose stimulation.
Chapter 4: Discussion
In this study, I demonstrated that an additional insulin-producing factor, Isl1β, in combination with PDA extended the overall duration of hepatic insulin transcriptional activity by increasing both insulin transcriptional activity and insulin producing cell numbers. Furthermore, Ad-PDA+Isl1β treatment activated several β cell associated genes, and consequently ameliorated hyperglycemia and improved glucose sensitive inulin production and secretion in diabetic mouse. Therefore, I propose that Isl1β is required for generation of glucose responsive insulin producing cells in liver combined with PDA.
Splicing variant Isl1β was first reported from MIN6 β cell line as lacking one of the Lhx-3 binding domain (LBD1, 23 amino acids) near C-terminus (39). LBD of Isl1 is required to bind to LIM homeobox protein 3 (Lhx3), through which their transcriptional activity is increased (39,40,44). Thus, Isl1β abolishes the synergistic transcriptional activity of Isl1/Lhx3 complex due to poor interaction with Lhx3 (39,40,44). However, Isl1/Lhx3 protein interaction occurs predominantly in neuronal tissues for driving neuro-differentiation, and is rarely found in pancreatic islet (39,40,44). Moreover, insulin transcriptional co-activators of Isl1 such as NeuroD (21,22) and Hnf4α (45) do not require LBD for functional binding, thereby presumably maintaining the same function with Isl1β. Interestingly, LBD is also described for transcriptional repressive role by folding Isl1 protein, which eventually hinders protein interactions with its co-factors (44). Therefore, Isl1β is assumed to form less self-protein folding, and become more accessible to its binding partners, which in turn increases its transcriptional activity on target genes, allegedly insulin (39,44). Nevertheless, the same biological validity of Isl1β as Isl1 could not be determined in pancreatic islet, as Isl1β is exclusively expressed in β cell lines, whereas Isl1 is expressed in both α and β cell (39). Furthermore, whether hepatic NeuroD and Hnf4α in our study interacted with Isl1β is not directly addressed; interacting binding domains of Isl1 co-factors, Ldb1 (20,42) and SSBP3 (43) in islet, have not been elucidated; and if Isl1 is less potent than Isl1β in activating its target genes such as Ins, Mafa and Gcg in liver is not identified. Because Isl1β remains largely elusive, future studies of Isl1β function in pancreatic islet are required to illuminate more precise roles of Isl1β in β cell generation.
The extension of hepatic insulin transcriptional activities [Fig. 4] and improved glucose responsiveness [Fig. 8(f)] could be attributed to changes in endogenous gene expression of liver, given that adenoviral sustainability was unaffected by Isl1β addition. Evidently, many of β cell signature genes including Pdx1 and Neurod1 were endogenously induced in Ad-PDA+Isl1β treated liver [Fig. 7(a,b)], whereas PDA-cell mostly relied on ectopic gene expression [Fig. 2(b,d)]. Since NeuroD can interact with either Pdx1 (46,47) or Isl1 (21,22) on insulin promoter, more hepatic Pdx1 and NeuroD proteins would form abundant complexes of NeuroD/Pdx1 and NeuroD/Isl1β, at PDA+Isl1β liver. Consequently, the number of insulin producing cells and the total insulin transcriptional activity were increased [Fig. 6(c,d)], emitting the peak signal at day 7. However, in the absence of Isl1β, limited number of NeuroD/Pdx1 complex was formed, producing the peak at day 3, which gradually faded at day 7 without additional Pdx1 and NeuroD proteins. Similarly, PDA+Isl1β and increased β cell functional genes [Fig. 7(b)] probably improved the glucose responsiveness [Fig. 8(f)], as NeuroD can also contribute to regulation of insulin transcription depending on different glucose concentrations through changing its binding partners, from Isl1 at low glucose level to Pdx1 at high (46). Strikingly, previous β cell reprogramming works in liver by overexpressing either a single Ngn3 (Neurogenin-3, an endocrine progenitor marker) (48), or a combination of Pdx1, Ngn3 and Mafa (PNM) (49) demonstrated that these hepatic neo-β cells were functional and exhibited drastically increased Isl1 level (48,49). Although, benefits of stable ectopic expression from using immunodeficient mice (49), or adeno-associated virus (48) could not be ignored, this could imply some degree of Isl1 contribution to functional β cell generation in liver. However, the additional effects of Isl1β do not continue after 14 days, probably due to a prompt immune-mediated adenovirus clearance [Fig. 1(d)]. Therefore, further study of stable PDA+Isl1β system will elucidate whether functional hepatic insulin producing cells could be maintained or not.
Uninhibited liver markers [Fig. 7(c)] were often reported in both direct (50) and step-wise (46) β cell reprogramming field. Yang et al.’s PNM directed reprograming in liver demonstrated that Afp level was continuously higher and Alb started to decrease lower than the control at 56 days of gene delivery (50). The inhibition of Alb was explained by maturing reprogrammed insulin producing cells, as glucose tolerance was first detected at day 56 (50). Similarly, β cell differentiation of murine embryonic stem
Ins1/2 levels, which was also interpreted as immaturity (51). In contrast, steadily converted, functional, hepatic neo-β cells did not express Alb, and persevered β-like cell phenotype (48,49). From this, our addition of Isl1β can be said to initiate β cell conversion, but stopped before reaching the maturation process, thus a partial conversion. Because, successful liver reprogramming was reported only from stable overexpression condition (48,49), our partial conversion could be resulted from transient expression system. Given that spontaneous Alb inhibition necessitated 12 weeks (48,49), whether persistent expression of PDA+Isl1β eventually inhibits liver markers and promotes the beneficial effects would be of interest for future studies.
Another pancreatic endoderm tissues, exocrine (52,53) and α cells (54,55,56) are also favored for β cell reprogramming. Zhou et al.’ group (52) first demonstrated the most efficient β-cell reprogramming factor combinations, PNM, in exocrine tissue through adenoviral administration in immunodeficient mice (52). PNM overexpressing acinar cells lost amylase expression (52,53), exhibited glucose responsiveness, and importantly maintained the converted features (53). In contrast, α cells, known for high plastic epigenomic state, can be converted into β cells by lower degree of gene manipulation (54), such as 1) histone modification in vitro (54), or in vivo single gene modification of either 2) Pax4 overexpression (55) or 3) Arx inhibition (56) in α cell. Although, modification of methylation pattern could not avoid glucagon coexpression in cultured islets (54), α cells from both genetically modified mice were successfully reprogrammed to functional β cells and maintained their newly adopted features, under glucagon supplementation (55,56). Nevertheless, specifically targeting α cells (54) or exocrine cells (52,53) is technically challenging due to deep anatomical location of pancreas; and tissue specific conditional knock-out (56) or knock-in strategy (55) is not clinically actionable. Of note, liver was effective to generate functional β cell through adenovirus mediated gene transfer both permanently, as mentioned above, (48,49) and transiently i.e. our Ad-PDA+Isl1β treatment. Moreover, commonly shared pancreatic progenitor Sox9 (49), large capacity and high proliferating rate of liver gives high tissue compatibility and targetability under intravenous injection of ectopic genes, bearing minimum invasiveness. Therefore, liver can be the most relevant extrapancreatic insulin producing tissue to future clinical application.
Lastly, Elf3 (a E74 like ETS transcription factor 3), exhibited an unexpectedly extensive inhibition on insulin transcriptional activity, by repressing PDA protein levels [Fig. 3(g)] but not transcriptional levels [Fig. 3(i)]. This would certainly shed light on to a new inhibitory mechanism of insulin production. This further raises the possibility of multiple functionality of non-transcriptional remaining 22 candidates [Fig. 3(e)] on insulin production, including one identified islet cells autoantigen of type I diabetes, Ptprn (protein tyrosine phosphatase receptor type N) (57). Future in vivo screening analysis will be essential to follow up on these candidates.
Chapter 5: Figures and Legends
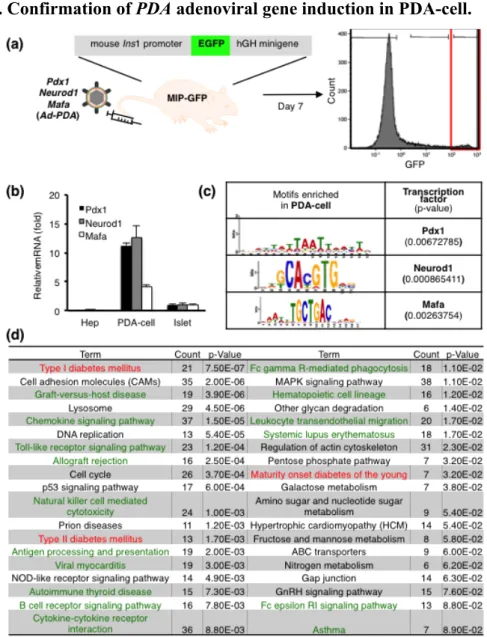
1.1. Confirmation of PDA adenoviral gene induction in PDA-cell.
Figure 1. (a) A schematic diagram of isolation of PDA-cell. At day 7 of Ad-PDA
injection into MIP-GFP mouse, liver cells were analyzed by flow cytometry and purified by GFP expression level. At day 7 of PDA injection into MIP-GFP mouse, liver cells were purified by positive GFP expression using FACS, extracted RNA and synthesized cDNA. RNAs from 3 individual mice were combined together to synthesize one cDNA. Expression values were normalized to Hprt. (b) mRNA level of Pdx1, Neurod1 and Mafa by qRT-PCR using CDS primers [Fig.2(c)]. (c) Promoter analysis of highly-expressed genes in PDA-cell population compared to Hep. (d) Disease pathway analysis of highly expressed genes in PDA-cell population compared to Hep by KEGG pathway online software tool.
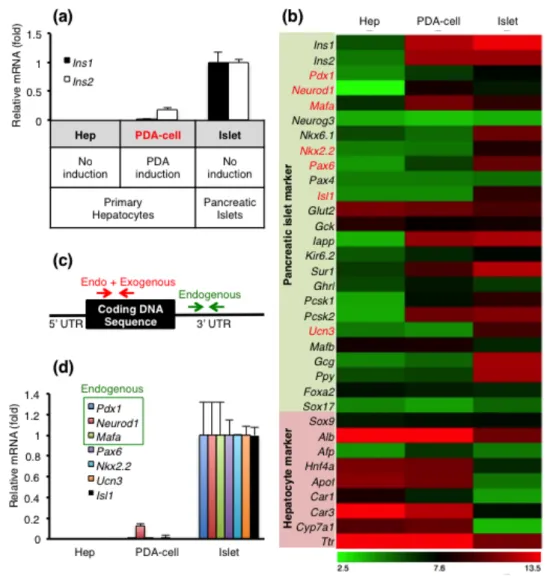
1.2. Isolation and analysis of GFP expressing insulin-producing cells in liver (PDA-cell) using MIP-GFP mice.
Figure 2. At day 7 of Ad-PDA injection into MIP-GFP mouse, liver cells were
analyzed by flow cytometry and purified by GFP expression level. (a) Sample labeling and insulin transcriptional levels by qRT-PCR from each sample. Controls were sampled from primary hepatocyte (negative control) and pancreatic islet (positive control) of untreated MIP-GFP mice. cDNA samples were pooled from 3 mice in each group. (b) Heatmap of pancreatic islet and hepatocyte markers expressed in Hep, PDA-cell and Islet (c) A diagram of different primer designs: CDS primers (in red) detecting both exogenous and endogenous gene expressions, and 3’ UTR primers (in green) amplifying only endogenous sequence. (d) mRNA expression of pancreatic markers highlighted in red [Fig. 1(b)] by qRT-PCR in Hep, PDA-cell and Islet samples.
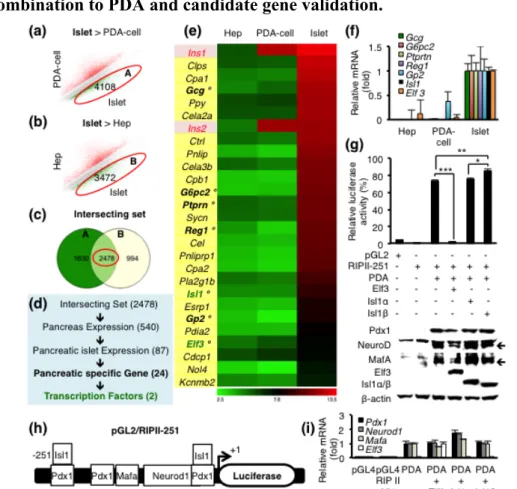
1.3. Microarray based filtering algorithm to choose candidate genes in combination to PDA and candidate gene validation.
Figure 3. (a,b) Microarray gene scatter plots displaying islet-enriched genes by 2-fold
cut-off from (a) PDA-cell vs. Islet. Set “A”, circled in red, denotes 4108 islet-enriched genes. (b) Hep vs. Islet. Set “B”, circled in red, denotes 3472 islet-enriched genes. (c) A Venn diagram of 2478 intersecting genes between set A and B from Figure 2a and 2b, respectively. (d) A schematic diagram of filtering algorithm and candidate numbers at each step. (e, f) A heatmap of final candidate gene list and its qRT-PCR validation by 7 random genes labeled with °. (g) A map of pGL2-RIP II-251 used for in vitro insulin promoter assay. (h) Luciferase assay of pGL2/RIPII-251 by Ad-PDA with Ad-Isl1α, Ad-Isl1β or Ad-Elf3 and their protein expression levels by western blot. Isl1α and β were detected simultaneously on the same blot, using the same Isl1 antibody (DSHB, #AB528315), which detects both Isl1α and β. Three independent experiments were performed. (i) Expression levels by qRT-PCR in luciferase assay of pGL2/RIPII-251 by pAd-PDA with pAd-Isl1α, pAd-Isl1β or pAd-Elf3. Exogenous primers (CDS) are used for detecting Pdx1, Neurod1, Mafa and Elf3. Data were analyzed by one-way ANOVA with Tukey-Kramer HSD test, *p < 0.05, ** p < 0.01, *** p < 0.001.
1.4. Bioluminescence screening image of combinatorial effects of Isl1β and
PDA using MIP-Luc-VU.
Figure 4. (a) A schematic diagram of non-invasive bioluminescence imaging
screening strategy. (b) Representative hepatic bioluminescence imaging at day 0, 3, 7, 10 and 14 after injection with either Ad-PDA+GFP or Ad-PDA+Isl1β into MIP-Luc-VU mice. Bioluminescence from lower-left quadrant of the animal signifies pancreatic signal; bioluminescence from upper abdomen signifies hepatic signal. Pancreatic signals are constantly emitted from endogenous β cells, thereby serve as background signal. Units were recorded in photons/sec/cm2/steradian within the range of 2.5x10⁴ - 2.5x10⁵. (c) Average radiance was measured by number of photons emitted from hepatic region at day 3, 7, and 10 and from pancreatic region at day 0 and 14 per second per area of mouse abdominal surface in centimeter. (PDA+GFP, n=5; Ad-PDA+Isl1β, n=5). Experiments were repeated at least three times independently. Data were analyzed by two-way ANOVA with Tukey-Kramer’s HSD test, *p < 0.05, ** p < 0.01, *** p < 0.001.
1.5. PDA+Isl1β adenoviral treatment increased insulin production and secretion at day 7 in MIP-GFP mice.
Figure 5. (a-e) Representative figures of liver section by immunohistochemistry at
day 7 of adenoviral injection with either Ad-PDA+LacZ or Ad-PDA+Isl1β. GFP signals signify insulin transcription. Merged figures include DAPI staining. Scale bar is 100µm. (a) Ad-PDA+LacZ infected liver sections stained with Pdx1, NeuroD and MafA antibody, which were visualized either in red or purple signals. (b) Ad-PDA+Isl1β infected liver sections stained with Pdx1, NeuroD, MafA and Isl1 antibody and visualized either in red or purple signals. Liver sections at day 7 of adenoviral treatment were stained with (c) Isl1 (d) Insulin or (e) Glucagon antibody. Pancreatic islet was used as positive control.
1.6. PDA+Isl1β adenoviral treatment increased insulin production and secretion at day 7 in MIP-GFP mice
Figure 6. (a, b) Whole liver RNA was prepared from the same experimental mice set
from Figure 5. Primer sequences are summarized in Table 1. (a) mRNA levels of Pdx1, Neurod1 and Mafa and Isl1β at day 7 by qRT-PCR. CDS primers [Fig. 2(c)] were used to detect PDA, which combine both adenovirus gene induction and endogenous expression level. Isl1β primer amplifies both α and β form, which denotes Isl1β in Ad-PDA+Islβ treated liver and Isl1α in islet. (b) mRNA levels of Ins1 and Ins2. (c, d) Samples were isolated from 6 mice per group. (c) Quantification of GFP expressing population by FACS. Data were analyzed by Student t-test, *p < 0.05. (d) mRNA level of Ins1 and Ins2 in GFP expressing cells by qRT-PCR. Data were analyzed by one-way ANOVA with Tukey-Kramer’s HSD test, *p < 0.05. (e, f) Insulin contents at day 7 of adenovirus treated mice from (e) liver or (f) serum. Data were obtained from 3 mice from each group and analyzed using one-way ANOVA followed by the Tukey-Kramer’s HSD test, *p < 0.05, ** p < 0.01. (g,h) MIP-GFP mice treated with either Ad-PDA+LacZ or Ad-PDA + Isl1β were measured for (g) Fed blood glucose levels at free fed status from tail snip, before (day 0) and after (day 7) of adenoviral treatment. (h) Body weight at day 0, 3 and 7 of adenoviral treatment. Data were analyzed by two-way ANOVA with Tukey-Kramer’s HSD test, * p <0.05, *** p<0.001
1.7. Adenoviral gene transfer of PDA+Isl1β increased β cell related genes in liver at day 7.
Figure 7. Whole liver RNA was extracted from the same experimental mice used in
Figure 4a-c. (a) mRNA levels of β cell markers: Pdx1, Neurod1, Mafa, Pax6 and Ucn3; α cell marker: Gcg. Endogenous Pdx1, Neurod1 and Mafa were detected using special primers which amplify 3’ untranslated region [Fig.2(c)]. (b) mRNA levels of β cell functional genes: Kir6.2, Pc2, Sur1 and Glut2. (c) mRNA levels of liver markers: Alb, Afp, and Hnf4a. LacZ indicates Ad-LacZ injected liver (negative control) of MIP-GFP and pancreatic islets (positive control) were isolated from adenovirus untreated MIP-GFP mice. Primer sequences are summarized in Table 1. All data (each group, n=3) were analyzed by one-way ANOVA followed by Tukey-Kramer’s HSD test, *p < 0.05, ** p < 0.01, *** p < 0.001, n.s. non significant.
1.8. Streptozotocin induced diabetic mice improved glycemic control and response after treating with Ad-PDA+Isl1β.
Figure 8. Streptozotocin (STZ; 200mg/kg) induced diabetic ICR mice were treated
with adenovirus as follows: Ad-PDA+LacZ (n=5), Ad-PDA+Isl1β (n=5). Virus titer was reduced to one third of usual dosage (8.5x10⁸ IFU). Experiments were repeated at least three times independently. Data analyzed by two-way ANOVA followed by Tukey-Kramer’s HSD test, *p < 0.05, ** p < 0.01, *** p < 0.001. (a) Fasting plasma glucose levels were measured once a week for 4 weeks. Day 0 is determined as the day of adenoviral injection. (b) Area under the curve of fasting glucose level in Figure a. Data were analyzed by one-way ANOVA followed by Tukey-Kramer’s HSD test, *p < 0.05. (c) Residual insulin contents from STZ induced mice pancreas at day 28 of adenoviral treatment with Ad-PDA+LacZ or Ad-PDA+Isl1β. Wt represents pancreas from non-STZ induced mice without adenovirus treatment. (PDA+GFP, n=5; Ad-PDA+Isl1β, n=5; Wt, n=5). (d) Intraperitoneal glucose tolerance test (IPGTT) at day 7 of adenovirus injection. (e) Area under curve of IPGTT in Figure d. Data were analyzed by one-way ANOVA followed by Tukey-Kramer’s HSD test, *p < 0.05. (f) In vivo glucose stimulated insulin secretion assay at day 7 of adenovirus injection. Plasma was collected at 0 and 30 minutes of glucose challenge. Data were analyzed by one-way ANOVA followed by Tukey-Kramer’s HSD test.
Chapter 6: Tables
1.1. The list of primer and their sequences used in this study
Gene symbol Forward primer sequences Reverse primer sequences mIns1 gccctctgggagcccaaa agagagcctctaccagg
mIns2 gcttcttctacacacccatgtc agcactgatctacaatgccac mPdx1 (CDS) ttcccgaatggaaccgagc gtaggcagtacgggtcctct mNeurod1 (CDS) acagacgctctgcaaaggttt ggactggtaggagtagggatg mMafa (CDS) cactggccatcgagtacgtca cttcacctcgaacttcatcaggtc mIsl1α (CDS) tcatccgagtgtggtttcaa ccatcatgtctctccggact mIsl1β (CDS) gaaggagcaactagtggagatgac agttttgtcgttgggttgct mEndogenousPdx1 gcgtcgcacaagaagaaaat tttcagaagctcagggctgt mEndogenousNeurod1 caaagccacggatcaatctt cccgggaatagtgaaactga mEndogenousMafa gaggaacagaaggaggaggag agtttcctgctgtcaactctgg mEndogenousIsl1 agcatcctctctgtgggcta cacgtacagctttcgtccaa mNkx2.2 atgtcgctgaccaacacaaa tcaccggacaatgacaagga mPax6 caggttgcgaagaactctgttt gcagatgcaaaagtccaggtg mGlut2 aaggatctgctcacatagtcact ttgcagccaacattgctttga mPC2 aatgacccctacccataccc gaggaggcttcgatgatgtc mSUR1 ctggtcctcagcagcacat ggaactcttgggacgagaca mKir6.2 gtaggggacctccgaaagag tggagtcgatgacgtggtag mUcn3 ttgcttctcggcttacctgt tgtgcacgtcacagagatga mGcg agggacctttaccagtgatgt aatggcgacttcttctgggaa mG6pc2 aggatgatgaagtgaacaca agaaggggctagcagatga mElf3 ttgaccctgaacaaccaaca gctctcttggaaggacatgc mGp2 ttgctgaccaactgctatgc ctttaaggccaggtgctcag mPtprtn ggctcctcctcagtccttct gccaaagacaggttctgctc mReg1 gctgaagaagacctgccatc gacgattccttttgggatca mAlb aattggcaacagacctgacc cctcaacaaaatcagcagca mAfp tcacatccacgaggagtgttgc ccttcaggtttgacgccattc mHnf4α ggtcaagctacgaggacagc atgtacttggcccactcgac mHprt ttgttgttggatatgcccttgacta aggcagatggccacaggacta
1.2. The list of antibodies used in this study Peptide/ Protein target Antigen sequence (if known) Name of Antibody Manufacturer, catalog #, and/or name of individual providing the antibody Species raised in; monoclonal or polyclonal Dilution used RRID (required in revised MSs) Isl1 C terminal of rat islet-1 (aa 178-349) Islet-1 DSHB, 40.2D6 Mouse; monoclonal 1 ; 500 AB52831 5 Pdx1 c-terminus of
mouse PDX-1 Rabbit Anti-PDX-1 Cehmicon, Ab3243
Rabbit; polyclonal 1 ; 500 AB77717 8 NeuroD N-terminus of Neuro D of
mouse Neuro D (N-19) Santa Cruz, sc-1084
Goat; polyclonal 1 ; 500 AB22824 74 MafA near the
C-terminus MafA Antibody BL1069 Bethyl, A300-611A
Rabbit; monoclonal 1 ; 100 AB12794 86 Elf3 Human/Mouse ELF3
Antibody R&D systems, AF5787 Goat; polyclonal 1 ; 500 AB22781 32 β-actin Anti-β-Actin pAb-HRP-DirecT MBL, PM053-7 Rabbit; polyclonal 1; 5000 AB10697 035
Insulin Anti-Insulin antibody
ab7842 Abcam, Ab7842
Guinea pig; polyclonal 1 ; 500 AB30613 0 Glucagon HSQGTFTSDY SKYLDSRRAQ DFVQWLMNT (M182) Anti-Glucagon,
PolAb Takara, M182 polyclonal 1 ; 500
AB26196 27
Chapter 7: Summary and Conclusion
In summary, I propose Isl1β as an essential insulin-producing factor, which facilitates Pdx1, Neuord1 and Mafa combination by increasing insulin production and glucose responsiveness through upregulating β cell related genes. Thus, these findings provide a novel insight into the function of Isl1β as therapeutic candidate for gene therapy through in vivo β cell generation to compensate the compromised β cell function in diabetes.
References
1. Robertson RP. Islet Transplantation as a Treatment for Diabetes — A Work in Progress. N Engl J Med. 2004;350(7):694-705. doi:10.1056/NEJMra032425.
2. Shapiro AMJ, Ricordi C, Hering BJ, et al. International Trial of the Edmonton Protocol for Islet Transplantation. N Engl J Med. 2006;355(13):1318-1330. doi:10.1056/NEJMoa061267.
3. Rezania A, Bruin JE, Arora P, et al. Reversal of diabetes with insulin-producing cells derived in vitro from human pluripotent stem cells. Nat Biotech. 2014;32(11):1121-1133. http://dx.doi.org/10.1038/nbt.3033.
4. Pagliuca FW, Millman JR, Gürtler M, et al. Generation of Functional Human Pancreatic β Cells In Vitro. Cell. 159(2):428-439. doi:10.1016/j.cell.2014.09.040. 5. Hanna J, Markoulaki S, Mitalipova M, et al. Metastable Pluripotent States in
NOD-Mouse-Derived ESCs. Cell Stem Cell. 16(5):566-568.
doi:10.1016/j.stem.2015.04.007.
6. Brons IGM, Smithers LE, Trotter MWB, et al. Derivation of pluripotent epiblast stem cells from mammalian embryos. Nature. 2007;448(7150):191-195. doi:10.1038/nature05950.
7. Hussein SM, Batada NN, Vuoristo S, et al. Copy number variation and selection during reprogramming to pluripotency. Nature. 2011;471(7336):58-62. doi:10.1038/nature09871.
8. Gore A, Li Z, Fung H-L, et al. Somatic coding mutations in human induced pluripotent stem cells. Nature. 2011;471(7336):63-67. doi:10.1038/nature09805. 9. Vegas AJ, Veiseh O, Gurtler M, et al. Long-term glycemic control using
polymer-encapsulated human stem cell-derived beta cells in immune-competent mice. Nat Med. 2016;22(3):306-311.
10. Ferber S, Halkin A, Cohen H, et al. Pancreatic and duodenal homeobox gene 1 induces expression of insulin genes in liver and ameliorates streptozotocin-induced hyperglycemia. Nat Med. 2000;6(5):568-572. doi:10.1038/75050.
11. Kojima H, Fujimiya M, Matsumura K, et al. NeuroD-betacellulin gene therapy induces islet neogenesis in the liver and reverses diabetes in mice. Nat Med. 2003;9(5):596-603. doi:10.1038/nm867.
12. Kaneto H, Matsuoka T, Nakatani Y, et al. A Crucial Role of MafA as a Novel Therapeutic Target for Diabetes. J Biol Chem. 2005;280(15):15047-15052. doi:10.1074/jbc.M412013200.
13. Nagasaki H, Katsumata T, Oishi H, et al. Generation of Insulin-Producing Cells from the Mouse Liver Using β Cell-Related Gene Transfer Including Mafa and Mafb. PLOS ONE. 2014;9(11):e113022. doi:10.1371/journal.pone.0113022.
14. Karlsson O, Thor S, Norberg T, Ohlsson H, Edlund T. Insulin gene enhancer binding protein Isl-1 is a member of a novel class of proteins containing both a homeo-and a CysHis domain. Nature. 1990;344(6269):879-882. doi:10.1038/344879a0.
15. Thor S, Ericson J, Brännström T, Edlund T. The homeodomain LIM protein Isl-1 is expressed in subsets of neurons and endocrine cells in the adult rat. Neuron. 1991;7(6):881-889. doi:10.1016/0896-6273(91)90334-V.
16. Ahlgren U, Pfaff SL, Jessell TM, Edlund T, Edlund H. Independent requirement for ISL1 in formation of pancreatic mesenchyme and islet cells. Nature. 1997;385(6613):257-260. doi:10.1038/385257a0.
17. Du A, Hunter CS, Murray J, et al. Islet-1 is Required for the Maturation, Proliferation, and Survival of the Endocrine Pancreas. Diabetes. 2009;58(9):2059-2069. doi:10.2337/db08-0987.
18. Liu J, Walp ER, May CL. Elevation of transcription factor Islet-1 levels in vivo increases β-cell function but not β-cell mass. Islets. 2012;4(3):199-206. doi:10.4161/isl.19982.
19. Ediger BN, Du A, Liu J, et al. Islet-1 Is Essential for Pancreatic β-Cell Function. Diabetes. 2014;63(12):4206. doi:10.2337/db14-0096.
20. Ediger BN, Lim H-W, Juliana C, et al. LIM domain–binding 1 maintains the terminally differentiated state of pancreatic β cells. J Clin Invest. 2017;127(1):215-229. doi:10.1172/JCI88016.
21. Peng S-Y, Wang W-P, Meng J, et al. ISL1 physically interacts with BETA2 to promote insulin gene transcriptional synergy in non-β cells. Biochim Biophys Acta BBA - Gene Struct Expr. 2005;1731(3):154-159. doi:10.1016/j.bbaexp.2005.08.013. 22. Zhang H, Wang W-P, Guo T, et al. The LIM-Homeodomain Protein ISL1 Activates
Insulin Gene Promoter Directly through Synergy with BETA2. J Mol Biol. 2009;392(3):566-577. doi:10.1016/j.jmb.2009.07.036.
23. Kojima H, Nakamura T, Fujita Y, et al. Combined Expression of Pancreatic Duodenal Homeobox 1 and Islet Factor 1 Induces Immature Enterocytes to Produce Insulin. Diabetes. 2002;51(5):1398. doi:10.2337/diabetes.51.5.1398.
24. Virostko J, Radhika A, Poffenberger G, et al. Bioluminescence Imaging in Mouse Models Quantifies β Cell Mass in the Pancreas and After Islet Transplantation. Mol Imaging Biol MIB Off Publ Acad Mol Imaging. 2010;12(1):10.1007/s11307-009-0240-1. doi:10.1007/s11307-009-2010;12(1):10.1007/s11307-009-0240-1.
25. Hara M, Wang X, Kawamura T, et al. Transgenic mice with green fluorescent protein-labeled pancreatic β-cells. Am J Physiol - Endocrinol Metab. 2003;284(1):E177. doi:10.1152/ajpendo.00321.2002.
26. Scharp DW, Kemp CB, Knight MJ, Ballinger WF, Lacy PE. The use of ficoll in the preparation of viable islets of langerhans from the rat pancreas. Transplantation. 1973;16(6):686-689.
27. Afgan E, Baker D, van den Beek M, et al. The Galaxy platform for accessible, reproducible and collaborative biomedical analyses: 2016 update. Nucleic Acids Res. 2016;44(Web Server issue):W3-W10. doi:10.1093/nar/gkw343.
28. Kent WJ, Sugnet CW, Furey TS, et al. The Human Genome Browser at UCSC. Genome Res. 2002;12(6):996-1006. doi:10.1101/gr.229102.
29. Rosenbloom KR, Armstrong J, Barber GP, et al. The UCSC Genome Browser database: 2015 update. Nucleic Acids Res. 2015;43(Database issue):D670-D681. doi:10.1093/nar/gku1177.
30. Bailey TL. DREME: motif discovery in transcription factor ChIP-seq data. Bioinformatics. 2011;27(12):1653-1659. doi:10.1093/bioinformatics/btr261.
31. Gupta S, Stamatoyannopoulos JA, Bailey TL, Noble WS. Quantifying similarity between motifs. Genome Biol. 2007;8(2):R24-R24. doi:10.1186/gb-2007-8-2-r24. 32. Huang DW, Sherman BT, Lempicki RA. Bioinformatics enrichment tools: paths
toward the comprehensive functional analysis of large gene lists. Nucleic Acids Res. 2009;37(1):1-13. doi:10.1093/nar/gkn923.
33. Huang DW, Sherman BT, Lempicki RA. Systematic and integrative analysis of large gene lists using DAVID bioinformatics resources. Nat Protoc. 2008;4(1):44-57. doi:10.1038/nprot.2008.211.
34. Saeed A, Sharov V, White J, et al. TM4: a free, open-source system for microarray data management and analysis. BioTechniques. 2003;34(2):374-378. http://europepmc.org/abstract/MED/12613259.
35. Pirooznia M, Nagarajan V, Deng Y. GeneVenn - A web application for comparing gene lists using Venn diagrams. Bioinformation. 2007;1(10):420-422.
36. Burren OS, Adlem EC, Achuthan P, Christensen M, Coulson RMR, Todd JA. T1DBase: update 2011, organization and presentation of large-scale data sets for type 1 diabetes research. Nucleic Acids Res. 2011;39(Database issue):D997-D1001. doi:10.1093/nar/gkq912.
37. Kajihara M, Sone H, Amemiya M, et al. Mouse MafA, homologue of zebrafish somite Maf 1, contributes to the specific transcriptional activity through the insulin promoter. Biochem Biophys Res Commun. 2003;312(3):831-842. doi:10.1016/j.bbrc.2003.10.196.
38. im Walde SS, Dohle C, Schott-Ohly P, Gleichmann H. Molecular target structures in alloxan-induced diabetes in mice. Life Sci. 2002;71(14):1681-1694. doi:10.1016/S0024-3205(02)01918-5.
39. Ando K, Shioda S, Handa H, Kataoka K. Isolation and characterization of an alternatively spliced variant of transcription factor Islet-1. J Mol Endocrinol. 2003;31(3):419-425.
40. Whitney IE, Kautzman AG, Reese BE. Alternative Splicing of the LIM-Homeodomain Transcription Factor Isl1 in the Mouse Retina. Mol Cell Neurosci. 2015;65:102-113. doi:10.1016/j.mcn.2015.03.006.
41. Ediger BN, Du A, Liu J, et al. Islet-1 Is Essential for Pancreatic β-Cell Function. Diabetes. 2014;63(12):4206-4217. doi:10.2337/db14-0096.
42. Hunter CS, Dixit S, Cohen T, et al. Islet α-, β-, and δ-Cell Development Is Controlled by the Ldb1 Coregulator, Acting Primarily With the Islet-1 Transcription Factor. Diabetes. 2013;62(3):875-886. doi:10.2337/db12-0952.
43. Galloway JR, Bethea M, Liu Y, Underwood R, Mobley JA, Hunter CS. SSBP3 Interacts With Islet-1 and Ldb1 to Impact Pancreatic β-Cell Target Genes. Mol Endocrinol. 2015;29(12):1774-1786. doi:10.1210/me.2015-1165.
44. Gadd MS, Jacques DA, Nisevic I, et al. A Structural Basis for the Regulation of the LIM-Homeodomain Protein Islet 1 (Isl1) by Intra- and Intermolecular Interactions. J Biol Chem. 2013;288(30):21924-21935. doi:10.1074/jbc.M113.478586.
45. Eeckhoute J, Briche I, Kurowska M, Formstecher P, Laine B. Hepatocyte Nuclear Factor 4 Alpha Ligand Binding and F Domains Mediate Interaction and Transcriptional Synergy with the Pancreatic Islet LIM HD Transcription Factor Isl1. J Mol Biol. 2006;364(4):567-581. doi:10.1016/j.jmb.2006.07.096.
46. Wang W, Shi Q, Guo T, et al. PDX1 and ISL1 differentially coordinate with epigenetic modifications to regulate insulin gene expression in varied glucose
concentrations. Mol Cell Endocrinol. 2016;428:38-48.
47. Qiu Y, Guo M, Huang S, Stein R. Insulin Gene Transcription Is Mediated by Interactions between the p300 Coactivator and PDX-1, BETA2, and E47. Mol Cell Biol. 2002;22(2):412-420. doi:10.1128/MCB.22.2.412-420.2002.
48. Yechoor V, Liu V, Espiritu C, et al. Neurogenin3 is Sufficient for in vivo Transdetermination of Hepatic Progenitor Cells into Islet-like cells but not Transdifferentiation of Hepatocytes. Dev Cell. 2009;16(3):358-373. doi:10.1016/j.devcel.2009.01.012.
49. Banga A, Akinci E, Greder LV, Dutton JR, Slack JMW. In vivo reprogramming of Sox9(+) cells in the liver to insulin-secreting ducts. Proc Natl Acad Sci U S A. 2012;109(38):15336-15341. doi:10.1073/pnas.1201701109.
50. Yang X-F, Ren L-W, Yang L, Deng C-Y, Li F-R. In vivo direct reprogramming of liver cells to insulin producing cells by virus-free overexpression of defined factors. Endocr J. 2017;64(3):291-302. doi:10.1507/endocrj.EJ16-0463.
51. Chen C, Chai J, Singh L, et al. Characterization of an In Vitro Differentiation Assay for Pancreatic-Like Cell Development from Murine Embryonic Stem Cells: Detailed Gene Expression Analysis. Assay Drug Dev Technol. 2011;9(4):403-419. doi:10.1089/adt.2010.0314.
52. Zhou Q, Brown J, Kanarek A, Rajagopal J, Melton DA. In vivo reprogramming of adult pancreatic exocrine cells to [bgr]-cells. Nature. 2008;455(7213):627-632. doi:10.1038/nature07314.
53. Li W, Cavelti-Weder C, Zhang Y, et al. Long-term persistence and development of induced pancreatic beta cells generated by lineage conversion of acinar cells. Nat Biotech. 2014;32(12):1223-1230. http://dx.doi.org/10.1038/nbt.3082.
54. Bramswig NC, Everett LJ, Schug J, et al. Epigenomic plasticity enables human pancreatic α to β cell reprogramming. J Clin Invest. 2013;123(3):1275-1284. doi:10.1172/JCI66514.
55. Collombat P, Xu X, Ravassard P, et al. The ectopic expression of Pax4 in the mouse pancreas converts progenitor cells into α- and subsequently β-cells. Cell. 2009;138(3):449-462. doi:10.1016/j.cell.2009.05.035.
56. Courtney M, Gjernes E, Druelle N, et al. The Inactivation of Arx in Pancreatic α-Cells Triggers Their Neogenesis and Conversion into Functional β-Like α-Cells. PLOS Genet. 2013;9(10):e1003934. doi:10.1371/journal.pgen.1003934.
57. Bearzatto M, Lampasona V, Belloni C, Bonifacio E. Fine mapping of diabetes-associated IA-2 specific autoantibodies. J Autoimmun. 2003;21(4):377-382. doi:10.1016/j.jaut.2003.08.002.