博士学位論文
Studies on the effect of alteration of carbon metabolism
on nitrogen metabolism and shoot branching in
Arabidopsis
博士学位論文
Studies on the effect of alteration of carbon metabolism
on nitrogen metabolism and shoot branching in
Arabidopsis
平成30年11月22日
ACKNOWLEDGEMENTS
I wish to express my science graduate to Dr. Shigeru Shigeoka, Professor of Faculty of Agriculture, Kindai University, for his kind guidance, valuable advice, stimulating discussion, and critical review throughout the work including the manuscript of this thesis.
I am especially grateful to Dr. Masahiro Tamoi, Professor of Faculty of Agriculture, Kindai University, for his continuous support, kind guidance, insightful comments, and constructive suggestion throughout the work including the manuscript of this thesis.
I am grateful to Dr. Tsutomu Kawasaki, Professor of Faculty of Agriculture, Kindai University, for reading the entire text in its original form.
I wish to express my gratitude to Dr. Noriaki Tanabe, Faculty of Agriculture, Kindai University for his continuous support, beneficial advice, and helpful discussions throughout the work.
I wish to thank Dr. Akiho Yokota, Professor emeritus of Graduate School of Biological Sciences, Nara Institute of Science and Technology, for his precious suggestions and comments throughout the work.
I greatly thank to Dr. Shuichi Yanagisawa, Professor of Biotechnology Research Center, The University of Tokyo, and Dr. Shigeru Sato, Biotechnology Research Center, The University of Tokyo, for their support using capillary electrophoresis-mass spectrometry (CE-MS).
I am profoundly grateful to Dr. Takanori Maruta, Associate professor of Faculty of Life and Environmental Science, Shimane University, for his useful advice, constructive suggestion.
Beside, I am appreciative to Dr. Takahiro Ishikawa, Professor of Faculty of Life and Environmental Science, Shimane University, Dr. Takahisa Ogawa, Associate professor of Faculty of Life and Environmental Science, Shimane University, Dr. Kazuya Yoshimura, Professor of College of Bioscience and Biotechnology, Chubu University, and Dr. Yukinori Yabuta, Professor of Faculty of Agriculture, Tottori University, for their valuable discussions and suggestions.
I would like to express my deepest gratitude to Dr. Akira Wadano and Dr. Yoshihisa Nakano, Professors emeritus of Osaka Prefecture University, for their encouragement and support.
I would particularly like to thank Dr. Kazunori Imaizumi, Professor of Graduate School of Biomedical & Health Sciences (Biomedical Sciences Major), Hiroshima University, and Dr. Toshio Iwaki, Associate professor of Comprehensive Rehabilitation of Osaka Prefecture University.
Finally, my special thanks are due to Harumi Sakuyama, Momoko Okamura, Yuko Tamaki, Dr. Ayako Yokoi, Dr. Masahiro Noshi, Dr. Hiroyuki Tanaka, Dr. Daniel Padilla-Chacon, Toshiki Maruyama, Shigeki Nedachi, Yasuko Aoyama, Yoshie Hiramatsu, Masayo Demuratani, Risa Urushiji, Nozomi Miyazaki, Ryota Nosaka, Megumi Ojiri and Kohei Iwaki, for their helpful collaborations. Thanks are all due to the past and present members of our laboratory of Plant Molecular Physiology in the Faculty of Agriculture, Kindai University, for their kind cooperations.
This research was supported by JST CREST Grant Number JPMJCR12B3 (S.S.) and JPMJCR15O5 (S.Y.), Japan.
ABBREVIATIONS
2-OG 2-oxoglutarate
3-PGA 3-phosphoglycerate
ABA abscisic acid
ADP-G ADP-glucose
AGPase ADP-glucose pyrophosphorylase
APL ADP-glucose pyrophosphorylase large subunit
APS ADP-glucose pyrophosphorylase small subunit
Asn asparagine
Asp aspartate
BAM beta-amylase
C carbon
CaMV35S cauliflower mosaic virus
C/N carbon and nitrogen metabolites
F2,6P fructose 2,6-bisphosphate F6P fructose 6-phosphate FBP fructose 1,6-bisphosphate FBPase fructose-1,6-bisphosphatase FBP/SBP fructose-1,6-/sedoheptulose-1,7-bisphosphatase Fd ferredoxin G1P glucose 1-phosphate G6P glucose 6-phosphate
GAPDH glyceraldehyde-3-phosphate dehydrogenase
GGT glutamate:glyoxylate aminotransferase
Glc glucose
Gln glutamine
GLN glutamine synthase
Glu glutamate
GOGAT glutamate synthase
GS glutamine synthetase
HXK hexokinase
IAA indole-3-acetic acid
IPT isopentenyl transferase
N nitrogen
NIR nitrite reductase
NR nitrate reductase NLP NIN-like proteins NRT nitrate transporter OAA oxaloacetate Pi inorganic phosphate PEP phosphoenolpyruvate
PEPC phosphoenolpyruvate carboxylase
PRK phosphoribulokinase
Ru5P ribulose 5-phosphate
Rubisco ribulose 1,5-bisphosphate carboxylase/oxygenase
RuBP ribulose 1,5-bisphosphate
S6P sedoheptulose 6-phosphate
S7P sedoheptulose 7-phosphate
SBP sedoheptulose 1,7-bisphosphate
SnRK1 sucrose non-fermenting 1-related protein kinase
SPS sucrose-phosphate synthase
SS starch synthase
STP sugar transporter protein
Suc sucrose
SUS sucrose synthase
TP triosephosphate
CONTENTS
CHAPTER I Introduction ………1
CHAPTER II Enhanced photosynthetic capacity increases nitrogen metabolism through the coordinated regulation of carbon and nitrogen assimilation in Arabidopsis ………8
CHAPTER III Enhancements in sucrose biosynthesis capacity affect shoot branching in Arabidopsis ……… 49
CHAPTER IV Sugar Transporter Protein 1 (STP1) contributes to regulation of the genes involved in shoot branching via carbon partitioning in
Arabidopsis ……… 67
REFERENCES ……… 86
CHAPTER I
INTRODUCTION
The world’s population has increased 4-fold in the past 100 years and was estimated to reach 7.6 billion in 2017. The population growth rate is also increasing, with a population of 9 billion being estimated by 2050. Greenhouse gas concentrations are becoming a major cause of global warming. Global warming increases air temperatures, changes the world’s climate, and causes extreme weather, such as drought and torrential rain. Drought interferes with the growth of plants and, ultimately, significantly reduces crop yields, while torrential rain removes nutrition from soil. Therefore, areas for crop cultivation are decreasing, with concomitant reductions occurring in the rate of increases in crop yield per unit area. Crops are alternative biofuels to petroleum and coal, and reduce greenhouse gas emissions. Although food demand is expected to increase, food supply is insufficient, and the balance between demand and supply is reaching breaking point. Since food supply and demand represent critical issue worldwide, national efforts to increase crop productivity and crop yield per unit area are needed.
Plant growth and productivity depend on nutrients in the surrounding environment. Plants take carbon (C) from the atmosphere into their leaves and nitrogen (N) and other inorganic nutrients from soil into their roots. Among the various nutrients required by plants, N is the most important for plant growth after C because it is used to synthesize
amino acids, proteins, and large numbers of secondary metabolites. Therefore, growth is also regulated by the amount of N taken into a plant. Environmental conditions modulate the metabolism of C and N (Gibon et al., 2004; Klotke et al., 2004; Roitsch and Gonzalez, 2004; Miller et al., 2007; Smith and Stitt, 2007; Zheng 2009; Huarancca Reyes et al., 2018). When the balance between the uptake of C and N is good and they are distributed well throughout a plant, growth is optimal. Thus, plant growth depends on interactions between the metabolism of C and N. Previous studies reported that the amounts of C and N in plants were strictly coordinated and regulated (C/N balance signaling) (Figure I - 1) (Coruzzi and Zhou, 2001; Martin et al., 2002; Yanagisawa et al., 2004; Zheng, 2009; Maruta et al., 2010; Tamoi et al., 2010). Moreover, several factors have been identified as sensing and signaling regulators of C/N balance signaling (Kang and Turano, 2003; Igarashi et al., 2003; Yanagisawa et al., 2004; Ferrario-Mery et al., 2005; Sato et al., 2009; Maruta et al., 2010; Dellero et al., 2015). GLB1 of PII-like protein regulates various cellular activities in response to the nitrogen nutritional status (Hsieh et al., 1998), E3 ubiquitin ligase (ATL31) regulates post-germination in a manner that depends on the C/N status (Sato et al., 2009), and glutamate: glyoxylate aminotransferase (GGT) plays a central role in photorespiration (Igarashi et al., 2003; Yanagisawa et al., 2004; Marchive et al., 2013). ABI1 was recently isolated and identified as a mutant that grew even when the C/N ratio of the growth medium was altered, suggesting a role for the plant hormone abscisic acid in C/N balance signaling (Lu et al., 2015). However, most of these regulators have been investigated by altering the C/N ratio of medium or examining seedlings. Few studies have conducted a comprehensive analysis on C/N balance signaling, and the underlying mechanisms have
not yet been elucidated in detail.
Figure I-1. The C/N balance controlling mechanisms
A previous study demonstrated that plastidic fructose-1,6-bisphosphatase (pFBPase) and sedoheptu-lose 1,7-bisphosphatase (SBPase) played important roles in the assimilation of CO2 in the Calvin cycle of photosynthesis (Tamoi et al., 2006). Therefore, tobacco and lettuce that expressed fructose-1,6-/sedoheptulose -1,7-bisphosphatase (FBP/SBPase) of Synechococcus PCC7942 (S.7942) in their chloroplasts were generated to enhance their photosynthetic capacities (Tamoi et al., 1996, 2006; Miyagawa et al., 2001; Yabuta et al., 2008; Ichikawa et al., 2010). These transgenic plants exhibited enhanced CO2 assimilation and growth (Miyagawa et al., 2001; Ichikawa et al., 2010). The leaf size, stem thickness, and root size of transgenic tobacco plants (TpFS) were all larger than those of wild-type plants (Miyagawa et al., 2001). However, transgenic plants did not show the phenotypes of an N deficiency, such as leaves with red coloration indicating the accumulation of anthocyanin, and they
grew well. These findings suggested enhanced nitrogen and carbon metabolism in plants expressing FBP/SBPase in their chloroplasts. Accordingly, transgenic plants with an enhanced photosynthesis capacity are suitable models for investigating the relationship between C and N metabolism, and the mechanisms underlying C/N balance signaling may be elucidated more completely by a detailed analysis of changes in nitrogen metabolism in plants with an enhanced photosynthetic capacity. The findings obtained may contribute to increasing crop productivity.
Figure I-2. Photosynthetic carbon metabolism in higher plants
Plant morphogenesis affects plant productivity. In plants, the numbers of shoot branches and leaves simultaneously increase. High leaf numbers promote the
assimilation of CO2 as well as plant growth, resulting in increased productivity. Plant morphogenesis is influenced by alterations in both environmental and nutritional conditions. The number of shoot branches and their patterns are important in morphogenesis because of their close relationship with plant productivity. The regulation of shoot branching is influenced by a number of plant hormones, such as auxin, cytokinin, and strigolactone (Teichmann and Muhr, 2015). Auxin generally suppresses the growth of lateral branches to promote that of apical buds, referred to as apical dominance. Cytokinin directly promotes lateral branch formation and has an antagonistic relationship with auxin. A recent study reported that strigolactone and its analogs were produced in plant roots and transported to shoots, and inhibited the elongation of lateral branches with auxin. Cytokinin, strigolactone, and auxin have been suggested to regulate shoot branching via crosstalk with each other. Therefore, these plant hormones may regulate shoot branching in response to the external environment and nutritional state of a plant. However, the relationship between these hormones currently remains unclear.
The sucrose biosynthesis pathway plays a vital role in the carbon partitioning of photosynthates (Stitt and Quick, 1989) (Figure I-2). Cytoplasmic FBPase is an important enzyme in sucrose biosynthesis (Stitt and Quick, 1989). A previous study generated and examined transgenic tobacco plants (TcFS) expressing cyanobacterial FBP/SBPase in their cytosol (Tamoi et al., 2011). At elevated CO2 levels (1200 ppm), lateral shoots, leaf numbers, and fresh weights were significantly higher in TcFS plants based on increases in photosynthetic activity than in wild-type plants (Figrue I-3). Moreover, hexose accumulated in the upper leaves of wild-type plants, whereas sucrose and starch levels increased in the lower leaves and lateral shoots of TcFS plants at
elevated CO2 levels. These findings suggest that cFBPase contributes to the efficient conversion of triosephosphate into sucrose, and that alterations in carbon partitioning enhance photosynthetic capacity and shoot branching. The mechanisms responsible for shoot branching signaling may be elucidated more completely by a detailed analysis of alterations in sugar partitioning and plant hormones in plants with an enhanced sucrose biosynthesis capacity. Further studies to clarify the entire signaling pathway may contribute to increases in crop productivity.
Figure I-3. Phenotypes of transgenic plants enhancing sucrose biosynthesis capacity
To clarify the molecular mechanisms underlying the relationship between carbon and nitrogen metabolism and shoot branching in higher plants, the following were performed
in the present study:
(1) Comprehensive analysis of the expression of various genes and metabolites involved in the metabolism of carbon and nitrogen in transgenic Arabidopsis plants that increase photosynthetic capacity,
(2) Analysis of the expression of various genes involved in shoot branching in transgenic
Arabidopsis that enhance sugar partitioning,
(3) Analysis of the relationship between sugar contents and the expression of various genes involved in shoot branching in Arabidopsis subjected to exogenous sugar treatments.
CHAPTER II
Enhanced photosynthetic capacity increases nitrogen metabolism through the coordinated regulation of carbon and nitrogen assimilation in Arabidopsis
Introduction
Plants use energy from light to convert carbon dioxide into carbon (C) metabolites, such as starchand sugars, and take up nitrogen (N) by their roots in either of two forms, NH4+ or NO3-. As described in chapter I, these C and N metabolites are required for the biosynthesis of macromolecules, including proteins, nucleic acids, fatty acids, and a large number of secondary metabolites. Since interactions between the metabolism of C and N in plants are important for optimal growth and productivity, the ratio between C and N must be tightly coordinated according to the cellular C-N status (Coruzzi and Bush, 2001).
Therefore, plants possess a regulatory system to coordinate the uptake and distribution of these nutrients in response to metabolic and environmental cues (Coruzzi and Zhou, 2001). In Arabidopsis plants, the addition of glucose and/or nitrate to a medium has been shown to alter the levels of genes involved in the metabolism of C and N (Wang et al., 2000, 2003; Price et al., 2004). Recent studies on C:N sensing and signaling in plants, which involved molecular-genetic, genomic, and cell biological approaches, have begun to uncover the regulation mechanisms between C and N (Coruzzi and Zhou, 2001; Kang and Turano, 2003; Yanagisawa et al., 2004; Gutiérrez et
al. 2007; Maruta et al., 2010; Tamoi et al., 2010; Zheng 2009). Furthermore, a plant nuclear gene (GLB1), which encodes a PII-like protein in Arabidopsis, plays a role in the coordinated regulation of C/N metabolism and is also thought to function in C/N signaling in plants (Hsieh et al., 1998). Sato and co-workers identified a C/N response mutant that survived in medium containing excess glucose under limited N conditions. The response gene encoding a Ring-H2 type ubiquitin ligase (ATL31) also plays a key role in regulating the response to C/N conditions during the early post-germinative growth in Arabidopsis (Sato et al., 2009). Glutamate:glyoxylate aminotransferase (GGT) catalyzes the reaction of glutamate and glyoxylate to 2-oxoglutarate and glycine (Igarashi et al., 2003). The ggt1 mutants showed low N assimilation, leading to a decreased Rubisco content; however, the C/N balance was maintained in these mutants (Dellero et al., 2015). The glutamate receptor (AtGLR1.1) functions as a C/N regulator that regulates C/N metabolism and distinct physiological processes such as germination through the control of abscisic acid (ABA) biosynthesis (Kang and Turano 2003; Ferrario-Mery et al., 2005). Additionally, ABA-insensitive mutant 1 (abi1) exhibited more sensitive responses to high C/low N stress, while the overexpression of ABI1 resulted in successful post-germination under these conditions. The transcript levels of ABA-signaling markers, such as RD29b, LEA3-4, and TSPO, were suppressed in
ABI1-overexpressing plants by high C/low N stress, suggesting cross-talk between C/N
and ABA signaling pathways under the control of ABI1 (Lu et al., 2015).
We previously reported that transgenic tobacco and lettuce plants that overexpressed FBP/SBPase of Synechococcus PCC7942 (S.7942) in their chloroplasts had an enhanced CO2 assimilation rate and increased biomass production (Miyagawa et
al. 2001; Yabuta et al. 2008; Ichikawa et al. 2010). Furthermore, single or combinational overexpression of sedoheptulose-1,7-bisphosphatase, fructose-1,6-
bisphosphate aldolase (FBPald) and cyanobacterial putative-inorganic carbon transporter B (ictB) in tobacco plants also caused increased photosynthesis and biomass production (Lefebvre et al. 2005; Rosenthal et al. 2011; Simkin et al. 2015). These transgenic plants did not show the N-deficient phenotypes at mature stage. These findings suggested that an essential N component for plant growth, such as an amino acid and protein, should be increased in photosynthesis-elevated transgenic plants at a certain point. Based on these findings, I assumed that an enhanced photosynthetic capacity at the immature stage in transgenic plants affected cell differentiation, assimilate partitioning, carbohydrate compartmentation, and various metabolic pathways including N metabolism. Therefore, these photosynthesis-elevated transgenic plants may be an attractive tool for analyzing the relationship between the metabolism of C and N at the immature and mature stages.
In this chapter, I generated transgenic Arabidopsis plants (ApFS) that expressed FBP/SBPase in their chloroplasts in order to clarify the effects of alterations in photosynthetic capacity on various metabolic pathways and the expression of genes involved in the metabolism of C and N. The photosynthetic CO2 assimilation rate was higher in ApFS plants than in wild-type plants under saturating irradiance conditions, resulting in a larger total dry weight in ApFS plants than in wild-type plants. I analyzed the expression of various genes and metabolites involved in the metabolism of C and N in ApFS plants at the immature (2 weeks) and mature (5 weeks) stages in order to clarify the
effects of an enhanced photosynthetic capacity on nitrogen metabolism in plants at various growth stages.
Materials and Methods
Plant materials and growth conditions
The seeds of Arabidopsis thaliana wild-type (ecotype Columbia-0) and transgenic plant (ApFS) lines were sown on a 1:1 perlite/soil mix or Murashige and Skoog (MS) medium after stratification at 4 °C for at least 48 h. Sterilized seeds of A. thaliana were placed on Murashige and Skoog (MS) sucrose-free gellan gum medium or a 1:1 perlite/soil mix in 6-cm pots. Tsuchitaro (Sumirin agro-products co., Ltd) which contains N 8.4 g l−1, P 136 g l−1, K 4.9 g l−1 was used as a soil for cultivation. Two-week-old plants grown on pots were transferred to 10-cm pots. To avoid the effects of insufficient of nutrients on nitrogen metabolism and gene expression, all plants grown in pots were given Hoagland modified solution, which contained 10 mM (NH4)H2PO4, 60 mM KNO3, 20 mM MgSO4, 40 mM Ca(NO3)24H2O, 0.25% Fe(III)EDTA, and micronutrients, 3 ml plant−1 day−1 until 2 weeks and 20 ml plant−1 day−1 after that. Since FBP/ SBPase was continuously expressed by the cauliflower mosaic virus (CaMV35S) promoter in transgenic plants, all plants were cultured under the following conditions to avoid secondary effects by the futile cycle and circadian responses to gene expression (Velez-Ramirez et al., 2011): 24-h continuous white light (ca. 100–150 µmol photons m−2 s−1), temperature of 23 °C, and air humidity of 60%.
Generation of transgenic plants
In order to generate Arabidopsis plants overexpressing cyanobacterial FBP/SBPase under the control of 35S promoter, a cDNA clone containing the complete cyanobacterial FBP/SBPase open reading frame was fused with the transit peptide of a tomato rbcS3C gene and cloned into pBI101 (Figure II-1). The resultant plasmid was introduced into A. thaliana wild-type by Agrobacterium tumefaciens (C58)-mediated transformation utilizing the floral dip method (Clough and Bent, 1998). Transgenic plants were selected on 0.8% (w/v) agar plates containing MS medium and 50 µg ml−1 kanamycin. Homozygous T3 generation plants harboring the transgene were used in further analyses.
Figure II-1. Construction of 35S-rbc3S-fbp/sbp gene.
Measurement of enzymatic activities
Rosette leaves (60–100 mg FW) were harvested and ground to a fine powder in liquid N2 using a mortar and pestle. Activities of FBPase, NADPH-dependent glyceraldehyde-3-phosphate dehydrogenase (NADP+-GAPDH) and phosphoribulokinase (PRK) and Rubisco were assayed as previously described (Miyagawa et al., 2001; Tamoi et al., 1998). Activites of nitrate reductase (NR) were assayed as described in Konishi and Yanagisawa (2011). Glutamine synthetase (GS) activity was assayed as described in Scheible et al. (1997).
Isolation of stromal proteins and immunoblotting
The extraction of stromal protein was carried out according to Aronsson and Jarvis (2002) with some modifications. All procedures were carried out at 4 °C. Intact chloroplasts were isolated from laws of wild-type and ApFS plants at 2 weeks old. Plants were homogenized with a small rotor in 100 ml isolation buffer (0.3 M sorbitol, 5 mM MgCl2, 5 mM EDTA, 20 mM HEPES-KOH, pH8.0). The homogenate was filtered through a double layer of Miracloth (Merck Millipore, Darmstadt, Germany). The homogenate was centrifuged at 1000g for 5 min and the pellet was resuspended in 3 ml isolation buffer. The resuspended chloroplasts were loaded onto a two-step Percoll gradient. Two-step gradients consisted of a bottom layer comprising 75% Percol solution (w/v) and a top layer comprising 30% Percoll solution (w/v). Two-step gradients were centrifuged in a swing-out rotor at 1500g for 10 min. Isolated chloroplasts were ruptured by hypotonic shock in buffer (10 mM MgCl2 and 20 mM HEPES, pH 7.6) on ice for 10 min. Stroma proteins were separated from thylakoid membranes by centrifugation (20,000g for 10 min at 4 °C). Stromal proteins were concentrated using Amicon Ultra Centrifugal Filters 3 K (Merc Millipore, Darmstadt, Germany), and protein concentrations were determined using Bradford protein assay. Supernatants containing solubilized proteins were separated by SDS–PAGE on 12% polyacrylamide gels. Separated proteins were electrophoretically transferred to a Hybond-P PVDF membrane (GE Healthcare, UK). The proteins of cyanobacterial FBP/SBPase and ascorbate peroxidase (sAPX and tAPX: chloroplastic isoform, cAPX: sytosolic isoform) were detected using a specific monoclonal antibody as previously
described by Miyagawa et al. (2001) and Ishikawa et al. (1996), respectively. The primary antibody was detected using a horseradish peroxidaselinked, antimouse, goat secondary antibody (Bio-Rad).
Measurement of photosynthesis
The rates of photosynthesis were measured using a LI- 6400XT portable infrared gas analyzer (Li-Cor, Lincoln, NE, USA) under a fixed blue-red light-emitting diode (LED) light source, 360 ppm CO2, temperature of 25 °C, and relative humidity of 65%. Measurements were taken from a leaf area of 0.785 cm2 and at actinic light of 0–1000 µmol photons m−2 s−1 using the instrument’s auto program function.
Metabolite analysis
Rosette leaves (100 mg FW) were immediately placed into liquid N2, ground in liquid N2 using a pestle and mortar with 1 ml of 6% perchloric acid, and centrifuged at 15,000×g for 5 min. Pellets were used for starch measurements and supernatants were enzymatically examined for sugars (glucose, fructose, and sucrose) as described by Galtier et al. (1995). Nitrate and nitrite levels were analyzed enzymatically and spectrophotometrically as described by Konishi and Yanagisawa (2011) and measured using calibration curves obtained with standard mixtures. Glutamate levels were analyzed spectrophotometrically with a l-glutamic acid measuring kit (Roche Applied Science) according to the manufacturer’s instructions. Glutamine was catalyzed by glutaminase (Daiwa Fine Chemicals, Japan) and formed glutamic acid then analyzed spectrophotometrically. Ammonia was extracted from approximately 100 mg of leaves
and analyzed spectrophotometrically by indophenol blue absorptiometry using an ammonia measuring kit (Wako Pure Chemical Industries, Japan) according to the manufacturer’s instructions. The extraction and analysis of various amino acids by capillary electrophoresis-mass spectrometry (CE-MS) were performed according to previous studies (Hachiya et al., 2014; Sato et al., 2004; Sato and Yanagisawa, 2010). Analyses of total C and total N were performed with whole plants using a Thermo Fisher Scientific Model Flash EA1112 (SI SIENCE, Japan) and CHN analyzer vario EL (Sumika Chemical Analysis Service, Osaka, Japan).
Quantitative real‑time PCR experiments
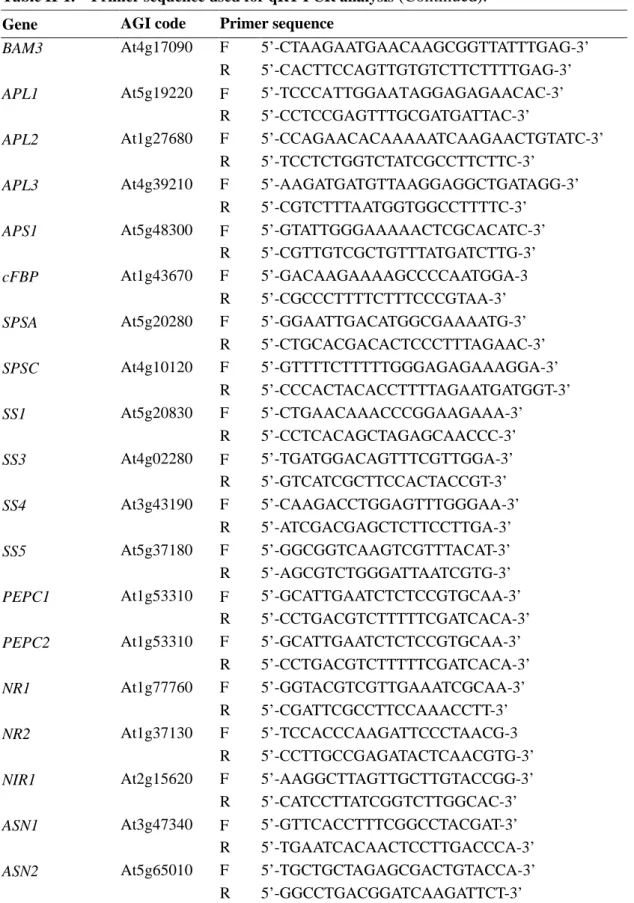
Quantitative real-time PCR (qRT-PCR) was performed with an Applied Biosystems 7300 Real Time PCR System and Roche LightCycler 96 system, using the SYBR Premix Ex Taq (Takara) and FastStart Universal SYBR Green Master (ROX). Primer pairs for qRT-PCR are shown in Table II-1. Actin2 mRNA was used as an internal standard in all experiments.
Table II-1. Primer sequence used for qRT-PCR analysis. Gene AGI code Primer sequence
Actin2 At3g18780 F 5’-CTCTTAACCCAAAGGCCAACAG-3’
R 5’-ACTGGCGTACAAGGAGAGAACAG-3 SS1 At1g32900 F 5’-TGGACCAAGACTTCTCCTGGAA-3’ R 5’-TCTCCTTGGCCAGAGGAGCTAT-3’ SS2 At3g01180 F 5’-CGTGGGAGGATTGAGGGATAC-3’ R 5’-ACAGTTTCCTAAGGCATGAATCAAC-3’ SS3 At1g11720 F 5’-AAAGGGCACAAGCTCAAGTTCTAG-3 R 5’-GATATCGCCCTATTGAGAGCATAATC-3’ SS4 At4g18240 F 5’-GACGAACAGGGTTTCAATTATGC-3’ R 5’-TGATGATCCCCAGCTGAAATC-3’
Table II-1. Primer sequence used for qRT-PCR analysis (Continued).
Gene AGI code Primer sequence
BAM3 At4g17090 F 5’-CTAAGAATGAACAAGCGGTTATTTGAG-3’
R 5’-CACTTCCAGTTGTGTCTTCTTTTGAG-3’
APL1 At5g19220 F 5’-TCCCATTGGAATAGGAGAGAACAC-3’
R 5’-CCTCCGAGTTTGCGATGATTAC-3’
APL2 At1g27680 F 5’-CCAGAACACAAAAATCAAGAACTGTATC-3’
R 5’-TCCTCTGGTCTATCGCCTTCTTC-3’
APL3 At4g39210 F 5’-AAGATGATGTTAAGGAGGCTGATAGG-3’
R 5’-CGTCTTTAATGGTGGCCTTTTC-3’
APS1 At5g48300 F 5’-GTATTGGGAAAAACTCGCACATC-3’
R 5’-CGTTGTCGCTGTTTATGATCTTG-3’
cFBP At1g43670 F 5’-GACAAGAAAAGCCCCAATGGA-3
R 5’-CGCCCTTTTCTTTCCCGTAA-3’
SPSA At5g20280 F 5’-GGAATTGACATGGCGAAAATG-3’
R 5’-CTGCACGACACTCCCTTTAGAAC-3’ SPSC At4g10120 F 5’-GTTTTCTTTTTGGGAGAGAAAGGA-3’ R 5’-CCCACTACACCTTTTAGAATGATGGT-3’ SS1 At5g20830 F 5’-CTGAACAAACCCGGAAGAAA-3’ R 5’-CCTCACAGCTAGAGCAACCC-3’ SS3 At4g02280 F 5’-TGATGGACAGTTTCGTTGGA-3’ R 5’-GTCATCGCTTCCACTACCGT-3’ SS4 At3g43190 F 5’-CAAGACCTGGAGTTTGGGAA-3’ R 5’-ATCGACGAGCTCTTCCTTGA-3’ SS5 At5g37180 F 5’-GGCGGTCAAGTCGTTTACAT-3’ R 5’-AGCGTCTGGGATTAATCGTG-3’
PEPC1 At1g53310 F 5’-GCATTGAATCTCTCCGTGCAA-3’
R 5’-CCTGACGTCTTTTTCGATCACA-3’
PEPC2 At1g53310 F 5’-GCATTGAATCTCTCCGTGCAA-3’
R 5’-CCTGACGTCTTTTTCGATCACA-3’
NR1 At1g77760 F 5’-GGTACGTCGTTGAAATCGCAA-3’ R 5’-CGATTCGCCTTCCAAACCTT-3’
NR2 At1g37130 F 5’-TCCACCCAAGATTCCCTAACG-3 R 5’-CCTTGCCGAGATACTCAACGTG-3’
NIR1 At2g15620 F 5’-AAGGCTTAGTTGCTTGTACCGG-3’
R 5’-CATCCTTATCGGTCTTGGCAC-3’
ASN1 At3g47340 F 5’-GTTCACCTTTCGGCCTACGAT-3’
R 5’-TGAATCACAACTCCTTGACCCA-3’
ASN2 At5g65010 F 5’-TGCTGCTAGAGCGACTGTACCA-3’
Table II-1. Primer sequence used for qRT-PCR analysis (Continued).
Gene AGI code Primer sequence
ASN3 At5g10240 F 5’-TGAACGCAAGCTTTGTCTTCC-3
R 5’-CACACTTGGACCTCCTGGTACA-3’ GLN1;1 At5g37600 F 5’-CATCAACCTTAACCTCTCAGACTCCACT-3’ R 5’-ACTTCAGCTGCAACATCAGGGTTGCTA-3’ GLN1;2 At1g66200 F 5’-TGTTAACCTTGACATCTCAGACAACAGT-3’ R 5’-ACTTCAGCAATAACATCAGGGTTAGCA-3’ GLN1;3 At3g17820 F 5’-CGTTAACCTCAACCTCACCGATGCCACC-3’ R 5’-TCCTCCTTGGCAACGTCGGGGTGGCTG-3’ GLN1;4 At5g16570 F 5’-AATCAATCTCGATCTCTCCGATTCCACT-3’ R 5’-TTCTTCGGCGACAACACTAGGGTCTTCA-3 GLN2 At5g35630 F 5’-ATCAGTGCCTACGGTGAAGGAA-3’ R -ATAGAGCATCCACGGTTAGCCA-3’
Fd-GOGAT1 At5g04140 F 5’-TTGCTGCTGGTATGACAGGAGG-3’
R 5’-TGCAGGCGCAGTTACTCTTTG-3’
Fd-GOGAT2 At2g41220 F 5’-CGAAGACAACACTCTCCTCCCT-3’
R 5’-CCGTTTTCTCCACATGAGCCT-3’
NADH-GOGAT At5g53460 F 5’-AGGTCTCGAATGTGACAACAGG-3’
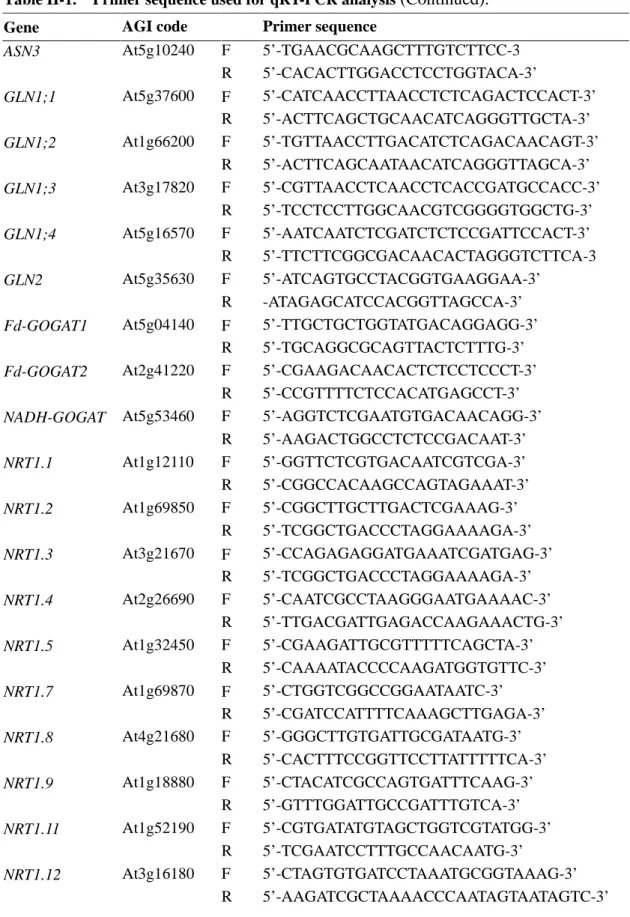
R 5’-AAGACTGGCCTCTCCGACAAT-3’ NRT1.1 At1g12110 F 5’-GGTTCTCGTGACAATCGTCGA-3’ R 5’-CGGCCACAAGCCAGTAGAAAT-3’ NRT1.2 At1g69850 F 5’-CGGCTTGCTTGACTCGAAAG-3’ R 5’-TCGGCTGACCCTAGGAAAAGA-3’ NRT1.3 At3g21670 F 5’-CCAGAGAGGATGAAATCGATGAG-3’ R 5’-TCGGCTGACCCTAGGAAAAGA-3’ NRT1.4 At2g26690 F 5’-CAATCGCCTAAGGGAATGAAAAC-3’ R 5’-TTGACGATTGAGACCAAGAAACTG-3’ NRT1.5 At1g32450 F 5’-CGAAGATTGCGTTTTTCAGCTA-3’ R 5’-CAAAATACCCCAAGATGGTGTTC-3’ NRT1.7 At1g69870 F 5’-CTGGTCGGCCGGAATAATC-3’ R 5’-CGATCCATTTTCAAAGCTTGAGA-3’ NRT1.8 At4g21680 F 5’-GGGCTTGTGATTGCGATAATG-3’ R 5’-CACTTTCCGGTTCCTTATTTTTCA-3’ NRT1.9 At1g18880 F 5’-CTACATCGCCAGTGATTTCAAG-3’ R 5’-GTTTGGATTGCCGATTTGTCA-3’ NRT1.11 At1g52190 F 5’-CGTGATATGTAGCTGGTCGTATGG-3’ R 5’-TCGAATCCTTTGCCAACAATG-3’ NRT1.12 At3g16180 F 5’-CTAGTGTGATCCTAAATGCGGTAAAG-3’ R 5’-AAGATCGCTAAAACCCAATAGTAATAGTC-3’
Table II-1. Primer sequence used for qRT-PCR analysis (Continued).
Gene AGI code Primer sequence
NRT2.1 At1g08090 F 5’-GGAAGCATGTTCTTGCCTCCTT-3’ R 5’-GGAGGCTTCCTTGATGCATGT-3’ NRT2.3 At5g60780 F 5’-GGTGGCCCTAGCGGATACTTAG-3’ R 5’-GGTCCAATACTGGCATGATACAAAC-3’ NRT2.5 At1g12940 F 5’-GCGTGGAGGATCGCTTTTT-3’ R 5’-GAGAACGGCGAAAGCAGAGA-3’ NRT2.7 At5g14570 F 5’-GTTCGAAAACAGAGAAGCATTTCA-3’ R 5’-CAACACATTCCACCCCATTG-3’ NRT3.1 At5g50200 F 5’-CTAGATATTGCCTCCATCTGTTTCAG-3’ R 5’-GCTCTATCTTGGCCTTCCTCTTC-3’ NLP6 At1g64530 F 5’-CAGCAAAAGCGAACACACTGA-3’ R 5’-CACATCATAGTTTCCTCTGAGCTTTC-3’ NLP7 At4g24020 F 5’-ACTTATACGCTCCCCCAAAGG-3’ R 5’-ACTTGCTTTGATTGTTACCGTTCTC-3’ GLB1 At4g01900 F 5’-AGCAAGGACAGGAGAGATTGGT-3’ R 5’-TCTTCTCTGCTTTCTCCCCAC-3’ SnRK1.1 At3g01090 F 5’-GTCGCCCAATGTTGTCAAGTTT-3’ R 5’-TGAGCAAGAAAAGCAGCACACA-3’ SnRK1.2 At3g29160 F 5’-TGTCGATGGGTTCCTGGTTTAG-3’ R 5’-CATGGCACAGTCATCCTCAATG-3’
ABI1 At4g26080 F 5’-CGGATTCTCTTGTGGCACAAG-3’
R 5’-AATACTCAGCCGCGGACATC-3’
pFBP At3g54050 F 5’-TCGTGACGCAAAGAGCAAAA-3’
R 5’-TGTCCATCAGAACCTTTCCCTC-3’
SBP At3g55800 F 5’-TGTTTGAAGTGGCTCCTCTTGG-3’ R 5’-CGTCGAGGTTGATGATGGTCTT-3’
RBCS1A At1g67090 F 5’-GAGCACGGATTTGTGTACCGT-3’
R 5’-GAATCCGATGATCCTAATGAAGGC-3’
PRK At1g32060 F 5’-CCGGTTTACCTGTTCGATGAA-3’ R 5’-GATGCCAGGGTACGAGCAA-3’
Statistical analysis
Jichi Medical University, Saitama, Japan), which is a graphical user interface for R (The R Foundation for Statistical Computing, Vienna, Austria) (Kanda, 2013). More precisely, it is a modified version of R commander designed to add statistical functions frequently used in biostatistics.
Results
Generation of transgenic Arabidopsis having FBP/SBPase
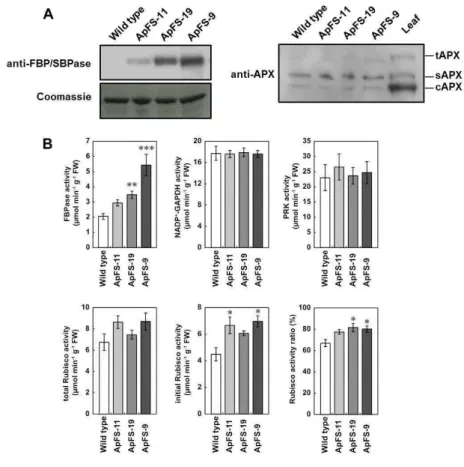
I generated transgenic Arabidopsis plants that expressed cyanobacterial FBP/SBPase in their chloroplasts and selected three T3-generation lines (ApFS-11, ApFS-19, and ApFS-9) displaying different FBP/SBPase overexpression patterns (Figure
II-2A). The total activities of FBPase derived from endogenous FBPase (plastidic and
cytosolic) and cyanobacterial FBP/SBPase were 1.4- to 2.6-fold higher in ApFS plants than in wild-type plants (Figure II-2B). No significant differences were observed in the total activities of NADP+-GAPDH and PRK between ApFS plants and wild-type plants (Figure II-2B). The activation state of Rubisco was 1.2-fold higher in ApFS plants than in wildtype plants, whereas no significant differences were noted in the total activities of Rubisco, indicating an increase in the in vivo activation state of Rubisco in ApFS plants (Figure II-2B).
Figure II-2. Creation of the transgenic plants.
(A) Immunoblots with an antibody against cyanobacterial FBP/SBPase and ascorbate peroxidase (sAPX and tAPX: chloroplastic isoform, cAPX: sytosolic isoform) (Ishikawa et al., 1996), using 5-µg soluble proteins of isolated chloroplasts per lane. (B) Activities of FBPase, NADP+-GAPDH, PRK, and Rubisco. Error bars indicate SE (n=4-6). Asterisks indicate that mean values were significantly different from those in wild-type plants when analyzed by a one-way ANOVA with Dunnett’s post hoc test (*P < 0.05, **P < 0.01, *** P < 0.001).
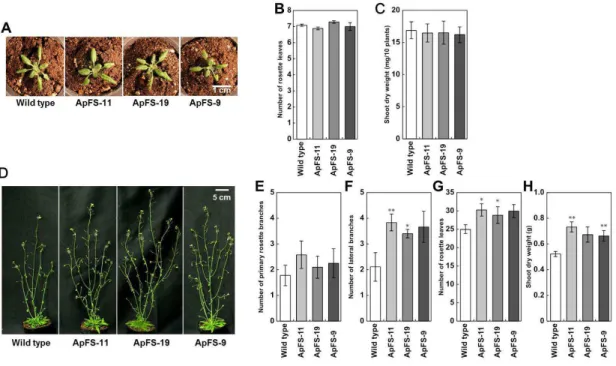
Two weeks after planting, the growth of ApFS plants was indistinguishable from that of wild-type plants (Figure II-3A). There was no significant difference in the number of rosette leaves or shoot dry weights between wild-type and ApFS plants at 2 weeks (Figure II-3A, B and C). Although no significant differences were observed in the number of primary rosette branches between wild-type and ApFS plants, the numbers
of lateral branches and rosette leaves were significantly higher in ApFS plants than in wild-type plants 5 weeks after planting (Figure II-3D, F and G). ApFS plants also had
higher shoot dry weights associated with larger numbers of lateral branches and rosette leaves than wild-type plants 5 weeks after planting (Figure II-3H).
Figure II-3. Phenotypes of wild-type and ApFS plants.
Plants were grown for 2 weeks (A) or 5 weeks (D) on soil. (B) Number of rosette leaves in wild-type and ApFS plants grown for 2 weeks on soil. Error bars indicate SE (n = 40–60 plants). (C) Shoot dry weights of wild-type and ApFS plants grown for 2 weeks on soil. Error bars indicate SE (n = 4–5 plants). (E) Number of primary rosette branches of wild-type and ApFS plants grown for 5 weeks on soil. Error bars indicate SE (n = 8–12 plants). (F) Number of lateral branches of wild-type and ApFS plants grown for 5 weeks on soil. Error bars indicate SE (n = 8–12 plants). (G) Number of rosette leaves of wild-type and ApFS plants grown for 5 weeks on soil. Error bars indicate SE (n = 8–12 plants). (H) Shoot dry weights of wild-type and ApFS plants grown for 5 weeks on soil. Error bars indicate SE (n = 8–12 plants). Asterisks indicate that mean values were significantly different from those in wild-type plants by a oneway ANOVA with Dunnett’s post hoc test (*P < 0.05, **P < 0.01). The entire experiment was replicated three times with similar results.
Photosynthetic activities in 5-week-old plants were measured under atmospheric conditions (360 ppm CO2) and various light intensities (50-1000 µmol photons m-2 s-1). At irradiances less than 100 µmol photons m-2 s-1, photosynthetic activities were not significantly different between wild-type and ApFS plants. However, at irradiances greater than 250 µmol photons m-2 s-1, photosynthetic activities were significantly stronger in ApFS plants than in wild-type plants (Figure II-4A). No significant difference was observed in the content of chlorophyll or anthocyanin between wild-type and ApFS plants (Figure II-4B).
Figure II-4. Photosynthetic parameters of wild-type and ApFS plants grown for 5 weeks on soil.
(A) Effects of increasing irradiance on CO2 assimilation at 360 ppm CO2, 25 °C, and 60% relative
humidity. Error bars indicate SE (n = 5–6 plants). (B) Total chlorophyll (left panel) and anthocyanin (light panel). Error bars indicate SE (n = 4–6 plants). Asterisks indicate that mean values were significantly different from those in wild-type plants by a one-way ANOVA with Dunnett’s post hoc test (*P < 0.05, **P < 0.01). The entire experiment was replicated three times with similar results.
Modulation of various sugars in transgenic Arabidopsis plants
In order to investigate the effects of an enhanced photosynthetic capacity on C metabolism, I analyzed various sugar levels in immature (2-week-old) and mature (5-week-old) leaves (Figure II-5). Starch levels at immature and mature leaves were higher in ApFS plants than in wild-type plants (Figure II-5A). At immature stage, no significant difference was observed in sucrose levels between wild-type and ApFS plants. However, sucrose levels were higher in ApFS plants than in wild-type plants at mature stage (Figure II-5B). On the other hand, no significant difference was observed in glucose or fructose levels between wild-type and ApFS plants at both immature and mature stage (Figure II-5C and 5D).
Figure II-5. Contents of starch (A), sucrose (B), glucose (C), and fructose (D) in rosette leaves of wild-type and ApFS plants grown on soil at 2- (left panel) and 5-week-old (right
panel).
Error bars indicate SE (n=5-10). Asterisks indicate that mean values were significantly different from those in wild-type plants by a one-way ANOVA with Dunnett’s post hoc test (*P < 0.05, **P
Effects of an enhanced photosynthetic capacity on the expression of genes involved in the Calvin cycle and starch and sucrose biosynthesis
The high assimilation of C in transgenic plants may affect the expression of genes involved in C metabolism. In order to address this possibility, I analyzed the transcript levels of genes encoding chloroplastic FBPase, SBPase, RBCS1A, and PRK at immature and mature stages using qRT-PCR. At both immature and mature stage, the transcript levels of these genes were lower in ApFS plants than in wild-type plants (Figure II-6).
Figure II-6. Expression of genes involved in the Calvin cycle in 2-week-old leaves (left
panel) and 5-week-old leaves (right panel) of wild-type and ApFS plants. Error bars indicate
SE (n=6-9). Asterisks indicate that mean values were significantly different from those in wild-type plants by a one-way ANOVA with Dunnett’s post hoc test (*P < 0.05, **P < 0.01, ***P <
Since an enhanced photosynthetic capacity increased starch and sucrose levels in ApFS plants grown for 5 weeks (Figure II-5), I analyzed the transcript levels of starch
synthase (SS1-4), ADP-glucose pyrophosphorylase large subunit (APL1-4), ADP-glucose pyrophosphorylase small subunit (APS1), Beta-amylase (BAM3), cytosolic FBPase
(cFBPase), sucrose-phosphate synthase (SPSA and SPSC), and sucrose synthetases (SUS1, SUS2, SUS3, SUS4, and SUS5) (Figure II-7). The transcript levels of SS1, SS2,
SPSC, and SUS3 were consistently higher in ApFS plants than in wild-type plants. The
transcript levels of BAM3 and APL2 were higher in ApFS plants than in wild-type plants at immature stage, whereas these levels were lower in ApFS plants than in wild-type plants at mature stage. The transcript levels of SS3 and SS4 were similar in ApFS and wild-type plants at immature stage, but were significantly lower in mature ApFS plants than those of wild-type plants. The transcript levels of APL1 and APL3 were significantly higher in ApFS plants than in wild-type plants at immature stage, whereas these levels were similar in ApFS and wild-type plants at mature stage. The transcript levels of cFBPase and SUS5 were similar in ApFS and wild-type plants at immature stage, but were significantly higher in ApFS plants than in wild-type plants at mature stage. The transcript levels of SUS1 were significantly lower in ApFS plants than in wild-type plants at immature stage, whereas this level was similar in ApFS and wild-type plants at mature stage. No significant differences were observed in the transcript levels of APS1,
SPSA, and SUS4 in wild-type and ApFS plants at both immature and mature stage. The
transcript levels of SUS2 and SUS6 were below or near the detection limit at both immature and mature stage.
Figure II-7. Expression of genes involved in sucrose and starch synthesis in rosette leaves of wild-type and ApFS plants grown on soil at 2- (left panel) and 5-week-old stage (right
panel).
The transcript levels of these genes were measured by a qRT-PCR analysis. Error bars indicate SE (n = 6–9 plants). Asterisks indicate that mean values were significantly different from those in wild-type plants by a oneway ANOVA with Dunnett’s post hoc test (*P < 0.05, **P < 0.01, ***P < 0.001). The entire experiment was replicated three times with similar results
Effects of an enhanced photosynthetic capacity on PEPC
Phosphoenolpyruvate carboxylase (PEPC) 1 and 2 double knockout mutants showed prominent changes in C/N metabolism and plant growth in Arabidopsis, suggesting that PEPC in leaves plays a crucial role in modulating the balance of C and N metabolism (Shi et al., 2015). The high assimilation of C in ApFS plants may affect the expression levels of PEPC and its activity. The transcript levels of PEPC1 tended to be higher in ApFS plants than in wild-type plants at immature stage, but were lower in ApFS plants than in wild-type plants at mature stage (Figure II-8). No significant changes were observed in the transcript levels of PEPC2 between wild-type and ApFS plants at both immature and mature stage. However, the transcript levels of PEPC2 were lower in ApFS plants than in wild-type plants at mature stage (Figure II-8A). Since the relative expression levels of PEPC3 and PEPC4 in leaves were lower than those of PEPC1 and PEPC2 (Shi et al., 2015), the expression levels of PEPC3 and
PEPC4 were below or near the detection limit at both immature and mature stage.
Despite the differences observed in the transcript levels of PEPC1 and PEPC2 between wild-type and ApFS plants, no significant difference was noted in the total activities of PEPC between wild-type and ApFS plants at both immature and mature stage (Figure
Figure II-8. Expression of PEPC genes (A) and PEPC activity (B) in rosette leaves of wild-type and ApFS plants grown on soil at 2- (left panel) and 5-week-old stage (right panel).
The transcript levels of these genes were measured by a qRT-PCR analysis. Error bars indicate SE [n = 6–9 plants (A), n = 4–6 plants (B)]. Asterisks indicate that mean values were significantly different from those in wild-type plants by a one-way ANOVA with Dunnett’s post
hoc test (*P < 0.05, **P < 0.01, ***P < 0.001). The entire experiment was replicated three times
with similar results.
Effects of an enhanced photosynthetic capacity on N metabolism
In order to establish whether an enhanced photosynthetic capacity contributed to maintaining the C/N balance, I analyzed the total contents of C and N in leaves from wild-type and ApFS plants. No significant difference was noted in the total contents of C and N or in the C/N ratio between wild-type and ApFS plants grown for 5 weeks (Table II-3). Furthermore, no significant difference was observed in the contents of total soluble protein between wild-type and ApFS plants at both immature and mature stage (Figure II-9).
Values are indicated as the mean ± SE for three individual experiments. There was no statistically significant difference between wild-type and ApFS plants (P > 0.05, by a one-way ANOVA)
Figure II-9. Total soluble protein in 2-week-old leaves (left panel) and 5-week-old leaves (right panel) of wild-type and ApFS plants.
Error bars indicate SE (n=4-6).
No significant difference was observed in the levels of nitrate between wild-type
Table II-3. Total C, N and C/N ratio of wild-type and ApFS plants
Total-C (%) Total-N (%) C/N ratio 2 weeks wild-type 37.8 ± 0.7 6.9 ± 0.2 5.5 ± 0.1 ApFS-11 37.0 ± 1.5 6.2 ± 0.7 6.1 ± 0.7 ApFS-19 38.1 ± 0.8 6.9 ± 0.3 5.5 ± 0.1 ApFS-9 38.6 ± 0.4 6.7 ± 0.4 5.8 ± 0.4 5 week wild-type 35.5 ± 1.5 5.6 ± 0.4 6.4 ± 0.6 ApFS-11 38.4 ± 1.4 4.6 ± 1.0 9.1 ± 1.8 ApFS-19 35.7 ± 0.9 5.0 ± 0.4 7.3 ± 0.4 ApFS-9 35.9 ± 1.6 5.5 ± 0.5 6.6 ± 1.0
and ApFS plants at both immature and mature stage (Figure II-10A). At immature stage, there was no significant difference in the levels of nitrite between wild-type and ApFS plants. At mature stage, nitrite levels were higher in ApFS plants than in wild-type plants (Figure II-10B). Although there was no significant difference in the total activity of NR between wild-type and ApFS plants at immature stage, it was higher in ApFS plants than those of wild-type plants at mature stage (Figure II-10), suggesting that the uptake capacity of nitrate increased as ApFS plants matured.
Therefore, I analyzed the contents of N-containing metabolites (free amino acids) in wild-type and ApFS plants grown for 2 or 5 weeks. The level of the ammonium ion was not altered between 2-week-old wild-type and ApFS plants, but was lower in ApFS plants than in wild-type plants at 5 weeks (Figure II-10C). The content of glutamine was lower in ApFS plants than in wild-type plants at 2 weeks, and was higher in ApFS plants than in wild-type plants at 5 weeks (Figure II-10D). No significant difference was observed in the levels of glutamate or total activities of GS between ApFS and wild-type plants at 2 and 5 weeks (Figure II-10E and 10G). I also measured C and N metabolite contents in plants grown for 2 weeks on MS medium (Table II-4). Glycine and FBP levels were significantly higher in ApFS19 and ApFS9 plants, and RuBP levels were higher in ApFS19 plants than in wild-type plants (Table II-4). Similar to plants grown on MS medium, the amounts of a large number of amino acids, fumarate, succinate, and NAD+ were lower in ApFS plants than in wild-type plants at 2 weeks.
Figure II-10. Contents of the nitrate ion (A), nitrite ion (B), free ammonium ion (C), free glutamine (D), and free glutamate (E), and activities of NR (F) and GS (G) in rosette leaves of wild-type and ApFS plants grown on soil at 2- (left panel) and 5-week-old stage (right
panel).
Error bars indicate SE (n = 4–5 plants). Asterisks indicate that mean values were significantly different from those in wild-type plants by a one-way ANOVA with Dunnett’s post hoc test (*P < 0.05, **P < 0.01, ***P < 0.001). The entire experiment was replicated three times with similar results.
Table II-4. C and N metabolites concentration of Arabidopsis plants grown on MS.
Metabolites (nmol/gFW) Wild type ApFS-19 ApFS-9 Gly 105.2 ± 88.7 960.8 ± 218.7*** 484.9 ± 132.9** Ala 812.9 ± 161.8 634.5 ± 105.1 813.2 ± 127.7 Ser 555.4 ± 135.0 550.8 ± 87.3 601.4 ± 78.4 Pro 224.6 ± 26.1 139.4 ± 23.7*** 191.4 ± 27.8 Thr 469.1 ± 27.6 422.0 ± 41.8 559.9 ± 119.0 Ile 54.5 ± 9.6 29.6 ± 9.9** 57.7 ± 8.2 Leu 94.4 ± 8.7 36.0 ± 14.2*** 110.6 ± 20.6 Orn 109.0 ± 39.6 103.0 ± 39.6 48.9 ± 13.6* Asn 908.7 ± 268.2 756.7 ± 163.1 941.2 ± 212.5 Asp 1567.8 ± 77.0 895.3 ± 104.2*** 1222.7 ± 198.7** Lys 85.2 ± 27.7 52.8 ± 20.7 71.1 ± 11.8 Gln 2527.3 ± 676.0 1924.1 ± 197.4 1731.0 ± 616.3 Glu 2258.7 ± 265.0 1503.6 ± 126.2*** 1782.1 ± 242.5* Met 16.0 ± 2.33 10.2 ± 3.0** 11.8 ± 1.6* His 78.0 ± 22.8 49.2 ± 14.7 65.9 ± 7.6 Phe 62.2 ± 7.4 38.6 ± 7.0** 71.0 ± 8.9 Arg 1858.7 ± 308.5 1607.4 ± 493.3 1270.2 ± 259.7 Tyr 39.7 ± 5.4 29.7 ± 6.1 50.9 ± 10.1 Trp 20.4 ± 2.1 12.5 ± 3.3** 24.4 ± 3.4 GSH 14.9 ± 22.7 10.7 ± 12.2 4.9 ± 7.2 GSSG 78.6 ± 14.2 53.4 ± 10.2* 80.4 ± 9.7 Citrulline 107.6 ± 28.8 66.6 ± 16.7* 82.8 ± 13.8 Pyruvate 39.6 ± 8.7 50.7 ± 9.4 33.3 ± 3.3 Lactate 296.0 ± 38.5 388.2 ± 138.01 304.3 ± 40.9 Fumarate 3353.5 ± 585.9 2114.0 ± 283.9** 2579.6 ± 471.1* Succinate 127.0 ± 471.1 63.0 ± 7.4*** 111.8 ± 8.5 Malate 1058.3 ± 191.3 980.2 ± 107.3 987.2 ± 104.1 2-OG 33.1 ± 9.8 38.3 ± 6.03 38.0 ± 11.8 PEP 30.4 ± 3.8 43.9 ± 17.1 26.0 ± 4.4 3-PGA 127.1 ± 51.6 184.0 ± 61.7 110.3 ± 14.5 Citrate 196.7 ± 68.8 135.7 ± 53.1 202.5 ± 25.9 Ru5P 6.5 ± 1.2 7.7 ± 1.9 7.8 ± 1.6 R5P 3.6 ± 0.9 3.0 ± 0.6 3.4 ± 0.6 G1P 20.2 ± 4.1 14.5 ± 2.1 19.3 ± 5.5 F6P 17.2 ± 7.4 25.0 ± 6.5 25.8 ± 14.0 G6P 219.1 ± 49.6 207.5 ± 14.7 241.2 ± 49.9 RuBP 3.8 ± 1.0 10.2 ± 4.6* 6.6 ± 2.1 FBP 15.7 ± 0.7 19.2 ± 1.1* 21.4 ± 3.2**
Table II-4. C and N metabolites concentration of Arabidopsis plants grown on MS (Continued).
Metabolites (nmol/gFW) Wild type ApFS-19 ApFS-9 UDP-Glucose 91.2 ± 12.1 70.2 ± 3.2** 82.9 ± 9.0 AMP 255.5 ± 50.0 253.5 ± 59.7 284.4 ± 78.7 ADP 22.2 ± 7.5 21.3 ± 5.8 21.2 ± 2.2 ATP 3.0 ± 1.4 8.2 ± 8.7 5.1 ± 3.2 NAD 24.0 ± 2.1 16.9 ± 0.7*** 20.2 ± 2.8* NADP 16.9 ± 3.3 14.0 ± 2.9 18.1 ± 1.5 NADPH 17.7 ± 1.4 14.2 ± 1.9 19.0 ± 3.6
Values are the mean ±SE of four independent samples.
Asterisks indicate that mean values were significantly different from those in wild-type plants by a one-way ANOVA with Dunnett’s post hoc test (*P < 0.05, **P < 0.01, ***P < 0.001).
Next, I analyzed the transcript levels of genes involved in N metabolism at immature and mature stage using qRT-PCR (Figure II-11). The transcript levels of
asparagine synthetase 1 (ASN1) were consistently higher in ApFS plants than in
wild-type plants. At immature stage, the transcript levels of these genes, except for those of ASN1 in ApFS plants, were similar or lower than those in wild-type plants. However, the transcript levels of nitrate reductase 1 (NR1) and nitrate reductase 2 (NR2) and glutamine synthase 1 (GLN1;1) were higher in ApFS plants than in wild-type plants at mature stage. The transcript levels of asparagine synthetase 2 (ASN2) were lower in ApFS plants than in wild-type plants at mature stage. The transcript levels of
ferredoxin-glutamate synthase1 (Fd-GOGAT1) and glutamine synthase2 (GLN2) were
lower in ApFS plants than in wild-type plants at immature stage. However, no significant difference was observed in the transcript levels of nitrite reductase1 (NIR1),
asparagine synthetase 3 (ASN3), GLN1;2, GLN1;3, Fd-GOGAT2 or NADH-dependent glutamate synthase (NADH-GOGAT1) between wild-type and ApFS plants at both
immature and mature stage (Figure II-11).
Figure II-11. Expression of genes involved in N metabolism in rosette leaves of wild-type and ApFS plants grown on soil at 2- (left panel) and 5-week-old stage (right panel).
The transcript levels of these genes were measured by a qRT-PCR analysis. Error bars indicate SE (n = 6–9 plants). Asterisks indicate that mean values were significantly different from those in wild-type plants by a one-way ANOVA with Dunnett’s post hoc test (*P < 0.05, **P < 0.01, ***P < 0.001). The entire experiment was replicated three times with similar results
Effects of an enhanced photosynthetic capacity on the expression of genes involved in nitrate transport
(NRT1. 1, NRT1.2, NRT1.3, NRT1.4, NRT1.5, NRT1.7, NRT1.8, NRT1.9, NRT 1.11,
NRT1.12, NRT2.1, NRT2.3, NRT2.5, NRT2.7, and NRT3.1) between wild-type and ApFS
plants at immature and mature stage (Figure II-12). The transcript levels of NRT1.4 and NRT1.11 were consistently higher in ApFS plants than in wild-type plants. In contrast, the transcript levels of NRT2.3 were consistently lower in ApFS plants than in wild-type plants. The transcript levels of NRT1.8 and NRT1.12 were higher in ApFS plants than in wild-type plants at immature stage, but were lower in ApFS plants than in wild-type plants at mature stage. The transcript levels of NRT1.5 and NRT2.5 were higher in ApFS plants than in wild-type plants at immature stage, but were similar in wild-type and ApFS plants at mature stage. Conversely, the transcript levels of NRT1.1 and NRT2.7 were lower in ApFS plants than in wild-type plants at immature stage, but were similar in ApFS and wild-type plants at mature stage. The transcript levels of
NRT2.1 and NRT3.1 were similar in wildtype and ApFS plants at immature stage, but
were higher or lower, respectively, in ApFS plants than those of wildtype plants at mature stage. No significant differences were observed in the transcript levels of NRT1.2,
NRT1.3, NRT1.7, or NRT1.9 between ApFS and wild-type plants at both immature and
Figure II-12. Expression of NRT genes in rosette leaves of wild-type and ApFS plants grown on soil at 2- (left panel) and 5-week-old stage (right panel).
The transcript levels of these genes were measured by a qRT-PCR analysis. Error bars indicate SE (n = 6–9 plants). Asterisks indicate that mean values were significantly different from those in wild-type plants by a one-way ANOVA with Dunnett’s post hoc test (*P < 0.05, **P < 0.01, ***P < 0.001). The entire experiment was replicated three times with similar results
Effects of an enhanced photosynthetic capacity on the expression of genes involved in C/N coordination
I analyzed the transcript levels of transcription factors involved in C and/or N metabolism between wild-type and ApFS plants at immature and mature stage (Figure
II-13). No significant difference was observed in the transcript levels of NIN-like
proteins (NLP6 and NLP7) between ApFS and wild-type plants at immature stage,
whereas those of NLP6 and NLP7 in ApFS plants were higher than those in wildtype plants at mature stage. The transcript levels of PII-like protein (GLB1) were consistently lower in ApFS plants than in wild-type plants at both immature and mature stage. No significant difference was observed in the transcript levels of Snf1-related
protein kinases (SnRK1.1/Akin10) between ApFS and wild-type plants at both immature
and mature stage. On the other hand, the transcript levels of SnRK1,2/Akin11 were lower in ApFS plants than in wildtype plants at immature stage, but were similar in ApFS and wild-type plants at mature stage. At immature stage, the transcript levels of
Abscisic acid insensitive 1 (ABI1) were lower in ApFS plants than in wild-type plants, but
Figure II-13. Expression of genes involved in C/N sensing and coordination in rosette leaves of wild-type and ApFS plants grown on soil at 2- (left panel) and 5-week-old stage (right panel).
The transcript levels of these genes were measured by a qRT-PCR analysis. Error bars indicate SE (n = 6–9 plants). Asterisks indicate that mean values were significantly different from those in wild-type plants by a oneway ANOVA with Dunnett’s post hoc test (*P < 0.05, **P < 0.01, ***P < 0.001). The entire experiment was replicated three times with similar results levels of these genes were measured by a qRT-PCR analysis. Error bars indicate SE (n = 6–9 plants). Asterisks indicate that mean values were significantly different from those in wild-type plants by a oneway ANOVA with Dunnett’s post hoc test (*P < 0.05, **P < 0.01, ***P < 0.001). The entire experiment was replicated three times with similar results
Discussion
In the present study, I generated Arabidopsis plants overexpressing FBP/SBPase in order to evaluate the effects of an enhanced photosynthetic capacity on C/N metabolism. Although the phenotype of ApFS plants was indistinguishable from that of
wild-type plants at 2 weeks, the numbers of rosette leaves and lateral branches at 5 weeks increased, and, thus, shoot dry weight was higher in ApFS plants than in wild-type plants at 5 weeks (Figure II-3). Photosynthetic activity was greater in ApFS plants than in wild-type plants (Figure II-4), indicating that the increment observed in ApFS plant growth was due to increased photosynthetic capacity.
Transgenic tobacco plants with increased SBPase activity were previously shown to exhibit a higher photosynthetic capacity and biomass production than those of wild-type plants (Lefebvre et al., 2005; Rosenthal et al., 2011). Moreover, when plants grew under field conditions at elevated CO2, leaf N contents were significantly decreased in transgenic plants (Rosenthal et al., 2011). Further enhancement of photosynthesis and biomass production was observed when SBPase, FBPald and ictB were simultaneously expressed in tobacco plants (Simkin et al., 2015). Furthermore, the levels of various amino acids were found to change in tobacco plants under different C and N statuses in order to correct for the imbalance between C and N in leaves (Fritz et al., 2006). In ApFS plants, the level of starch increased at 2 and 5 weeks due to an enhanced photosynthesis capacity (Figure II-5). However, the C/N ratio was similar to that in wild-type plants at 5 weeks (Table II-3). Therefore, I assumed that the expression levels of genes involved in nitrate metabolism are regulated in order to supply deficient free amino acids and modulate growth characteristics at the immature stage of ApFS plants, but not the mature stage (Figure II-14).
The transcript levels of the genes involved in the Calvin cycle are known to be regulated by negative feedback control with the accumulation of photosynthates in leaves (Sheen 1990). The transcript levels of genes encoding chloroplastic FBPase, SBPase,
RBCS1A, and PRK were consistently lower in ApFS plants than those of wild-type plants
at both immature and mature stage (Figure II-6). This decrease in the transcript levels of genes involved in the Calvin cycle was attributed to an intracellular unbalanced C/N ratio such as high C and low N (Rideout et al. 1992). Conversely, transgenic tobacco and Arabidopsis plants that had reduced SBPase levels showed decreased photosynthetic activity and dwarfing phenotypes in parallel with a decrease in starch content (Harrison et al., 2001; Liu et al., 2012). No significant difference was observed in the total activities of NADP+-GAPDH, PRK, or Rubisco between wild-type and ApFS plants at 5 weeks. Meanwhile, the Rubisco activity ratio was higher in ApFS plants than in wild-type plants (Figure II-2). These results were consistent with previous findings obtained in FBP/SBPase-overexpressing transgenic tobacco plants indicating that an enhanced photosynthetic capacity in ApFS plants temporarily inhibited the transcript levels of the genes involved in the Calvin cycle due to increased levels of photosynthates, but had no influence on these enzymatic activities (Miyagawa et al., 2001).
It has been reported that the disruption of chloroplastic FBPase caused alteration of various metabolites including starch and sucrose by a decreased photosynthetic capacity (Rojas-Gonzalez et al., 2015). Also in ApFS plants, some of the metabolite changes observed may be associated with an enhanced photosynthetic capacity. Starch levels were consistently higher in ApFS plants than in wild-type plants (Figure II-5). ADP-glucose pyrophosphorylase is an essential enzyme for the regulation of starch synthesis and comprises small and large subunits in plants (Crevillen et al., 2003). In
Arabidopsis, four genes encode the large subunit of ADP-glucose pyrophosphorylase.
subunit in leaves, whereas other APLs are mainly present in sink tissues (Crevillen et al., 2005; Ventriglia et al., 2008). The expression levels of APL1-3 were markedly higher in ApFS plants than in wild-type plants at immature stage (Figure II-7). β-amylases, which generate maltose from starch for export to the cytosol, are committed to a starch degradation pathway (Fulton et al., 2008; Stitt and Zeeman 2012). In Arabidopsis, nine genes encode β-amylase and β-amylase-like proteins. The importance of these enzymes was analyzed using single knockout mutants, and only bam3 was found to accumulate starch at mature stage (Monroe et al., 2014). The expression levels of
BAM3 were higher at 2 weeks, but were lower in ApFS plants than in wild-type plants at
5 weeks (Figure II-7). These data suggest that the biosynthesis and degradation of starch are enhanced in ApFS plants at immature stage. SS catalyzes the transfer of the glucosyl moiety of ADP-glucose to a pre-existing α-(1, 4) glucan primer (Roldan et al., 2007). Mutants lacking SS3 and SS4 are completely starchless (Szydlowski et al., 2009). Decreases in the expression levels of APL2, BAM3, SS3 and SS4 were observed in ApFS plants at 5 weeks, suggesting that the pathway for starch degradation is promoted in order to provide energy for growth at this stage.
Sucrose synthase (SUS) catalyzes the reversible reaction of sucrose synthesis and breakdown, and equilibrium between these two reactions predominates in the sucrose breakdown step to produce UDP-glucose, which is a cell wall precursor (Baroja-Fernandez et al., 2012). Among the six SUS genes (SUS1-6) in Arabidopsis,
SUS2 and SUS6 transcripts are lower than other isoforms in leaves (Bieniawska et al.,
2007). A previous study reported that the expression level of SUS1 was increased in response to a sucrose treatment and osmotic stress, while the transcript levels of SUS3
increased in response to osmotic stress only (Baud et al., 2004). Although no significant differences were observed in the sucrose contents of ApFS and wild-type plants, the transcript levels of SUS1 were lower, while those of SUS3 were higher in ApFS plants than in wild-type plants at 2 weeks (Figure II-7). At mature stage, sucrose contents were higher than those in WT plants; however, no significant differences were noted in
SUS1 levels between ApFS plants and wild-type plants. On the other hand, SUS3 levels
were still higher in ApFS than in wild-type plants (Figure II-7). SUS1 and SUS4 are closely related, but exhibit distinct expression profiles (Baud et al., 2004). In the present study, I showed that the expression patterns of SUS1 and SUS4 were different in ApFS plants. On the other hand, a previous study reported that the transcript levels of SUS5 were regulated by a sucrose or stress treatment (Baud et al., 2004). In ApFS plants, the transcript levels of SUS5 were higher than that in wild-type plants at 5 weeks (Figure
II-7). Previous reports and my results suggest that the transcript levels of SUS family
members are regulated by osmotic conditions with a balance between starch, sucrose, and hexose levels; however, the underlying regulatory mechanisms have not yet been elucidated in detail.
PEPC is a crucial enzyme that functions in primary metabolism by irreversibly catalyzing the conversion of phosphoenolpyruvate (PEP) and HCO3− to oxaloacetate and inorganic phosphate, and plays an important role in modulating the balance between C and N metabolism in Arabidopsis leaves (Shi et al., 2015). Although no significant differences were observed in the total activities of PEPC between ApFS and wild-type plants, the transcript levels of PEPC1 and PEPC2 were more varied in ApFS plants than in wild-type plants (Figure II-8). The differences observed in the expression levels of