視覚障害者の視覚情報へのアクセスを補助するための画像処理技術に関する研究
122
0
0
全文
(2) 1.
(3) Abstract In 2010, the World Health Organization (WHO) reported that there are approximately 285 million people worldwide, who suffer visual impairment. Every year, this number grows by up 2 million due to eye diseases, accidents, aging and the growth of newborn population. Vision loss affects almost all activities of daily living, for instance, it becomes difficult or impossible for visually impaired people to read, walk, drive or recognize objects and find places. Therefore, if assistive technology can support visually impaired people in at least one of these tasks, it is going to make a very relevant social impact. This dissertation turns to the development of technology for assisting the visually impaired to access visual information. Visual information is widely used for studying, route finding, finding public places, and more. However, visually impaired people, especially blind people, are difficult to access visual information unless it is represented non-visually, such as with Braille, tactile graphics, or speech. In this thesis, we focus on development of image processing to assist tactile graphic production and scene text reading. For human beings, it is difficult to study mathematics, physics, chemistry, and biology through text only. Therefore, graphs and figures are frequently used to present visual information in textbooks. However, most of these graphs and figures are in visual form, they cannot be utilized by visually impaired students. Through tactile graphics, figures can be understood by the visually impaired. This is because tactile graphics are represented by raised patterns which can be felt with fingertips. However, production of tactile graphics is not so simple a task, it needs professional knowledge of its corresponding field. Most of the work for producing tactile graphic teaching materials is done by teachers, while some of the work is done by volunteers. Until now, most tactile graphics are produced using less intelligent computer-aided systems. Therefore,. 1.
(4) technologies for automatically producing tactile graphic teaching materials are needed. In this thesis, the first aim is to develop a system for automatically translating mathematical graphs into tactile graphics. This is because mathematical graphs are often line drawings. So it is possible that computers are able to recognize mathematical graphs from printed materials for producing tactile graphics. For the figures in physics, chemistry, and biology textbooks, they are difficult to be translated into tactile graphics due to the following reasons: for example, (1) figures in physics textbooks are usually not line drawings, they are difficult to be translated into tactile graphics by using image processing techniques; (2) the structures of figures in physics textbooks are usually complex, but tactile graphics must be simple for reading; (3) the ability to read tactile graphics deeply depends on individuals, providing tactile graphics individually is needed. Therefore, such figures should be redrawn before producing tactile graphics. The second aim of this thesis is to develop a system for automating translation of hand-drawn figures into tactile graphics. Signs and public notices are ubiquitous indoors and outdoors, and they are often used for route finding, finding public places and other locations. However, information on signs is inaccessible to many visually impaired people. Therefore, technology developed for automatically reading text from natural scenery becomes an important application for assisting visually impaired people. Thus in this thesis, the third aim is to propose a system for automated text reading from natural scenery. Based on the reasons above, this dissertation focuses especially on the use of image processing to support visually impaired people to access visual information. In this thesis, we first propose a method for automatically translating mathematical graphs into tactile graphics. Second, a method for automating translation of hand-drawn figures into tactile graphics is proposed. Finally, we propose a new method for automated text reading from natural scene images.. 2.
(5) Contents Chapter 1 ...........................................................................................................................................1 Introduction ......................................................................................................................................1 1.1 Visually Impaired People ..................................................................................................1 1.2 A Review for Assistive Technologies .............................................................................2 1.2.1 Corrective Lens for Vision Assistance ..............................................................................2 1.2.2 Assistance in Mobility and Orientation.............................................................................2 1.2.2.1 Aids for Mobility .......................................................................................................2 1.2.2.2 Aids for Orientation ...................................................................................................3 1.2.2.3 Aids for Accessing Environment ...............................................................................4 1.2.3 Assistance in Verbal Information Access ..........................................................................4 1.2.3.1 Aids for Reading Printed Text....................................................................................4 1.2.3.2 Aids for Reading Text on Screen ...............................................................................5 1.2.4 Assistance in Visual Information Access ..........................................................................5 1.2.5 Assistance in Object Recognition .....................................................................................6. 1.3 Research Background and Objective..............................................................................7 1.3.1 Background .......................................................................................................................7 1.3.1.1 Tactile Graphic Production ........................................................................................7 1.3.1.2 Scene Text Reading ....................................................................................................8 1.3.2 Objectives .........................................................................................................................8 1.3.2.1 Translation of Mathematical Graphs into Tactile Graphics........................................9 1.3.2.2 Translation of Hand-drawn Figures into Tactile Graphics .........................................9 1.3.2.3 Extraction of Text from Natural Scene Images ........................................................ 11. 1.4 Organization ......................................................................................................................12 References ....................................................................................................................................13. Chapter 2 .........................................................................................................................................19 Tactile Graphics ............................................................................................................................19 2.1 Introduction........................................................................................................................19 2.2 Types and Forms of Tactile Graphics ...........................................................................21 2.3 Guidelines for the Design of Tactile Graphics ...........................................................23 2.3.1 Characteristics for Tactile Graphics ................................................................................23 2.3.2 Basic Principles for the Design of Tactile Graphics........................................................23 2.3.3 Tactile Graphic Symbols .................................................................................................24. References ....................................................................................................................................26. Chapter 3 .........................................................................................................................................27 Automatic Translation of Mathematical Graphs into Tactile Graphics .....................27 I.
(6) 3.1 Introduction........................................................................................................................27 3.2 Separation of Mathematical Graphs .............................................................................30 3.3 Extraction of Broken Line Graph Elements ................................................................31 3.3.1 3.3.2 3.3.3 3.3.4. Dotted Line Classification ..............................................................................................32 Chain Line Classification ................................................................................................33 Broken Line Classification..............................................................................................35 Merging Clusters .............................................................................................................35. 3.4 Extraction of Solid Line Graph Elements ...................................................................39 3.4.1 Segmentation of Large Elements ....................................................................................40 3.4.2 Merging Primitive Elements ...........................................................................................41. 3.5 Fitting and Classifying Graph Element........................................................................42 3.5.1 Straight Line, Circle and Arc Classification ...................................................................43 3.5.2 Ellipse Classification ......................................................................................................43 3.5.3 Cubic Bézier Curve Fitting .............................................................................................44. 3.6 Experimental Results .......................................................................................................46 3.6.1 3.6.2 3.6.3 3.6.4. Results of Broken Line Extraction ..................................................................................46 Results of Solid Line Extraction .....................................................................................49 Results of Graph Element Fitting ....................................................................................50 SVG and Edel Document Production .............................................................................50. 3.7 Summary ............................................................................................................................51 References ....................................................................................................................................52. Chapter 4 .........................................................................................................................................55 Automatic Translation of Hand-drawn Figures into Tactile Graphics.......................55 4.1 Introduction........................................................................................................................55 4.2 Outline For Our Method and Basic Procedures .........................................................56 4.2.1 Preprocessing and Traffic Signal Detection ....................................................................58 4.2.2 Segmentation and Shape Classification ..........................................................................60. 4.3 Object Classification ........................................................................................................63 4.3.1 Arrow Classification .......................................................................................................64 4.3.2 Cross Classification ........................................................................................................66 4.3.3 Route and Railway Classification ...................................................................................67. 4.4 Experimental Results .......................................................................................................69 4.5 Usability Evaluation for Our System ...........................................................................70 4.5.1 Method ............................................................................................................................70 4.5.2 Results .............................................................................................................................72. 4.6 Summary ............................................................................................................................76 References ....................................................................................................................................78. Chapter 5 .........................................................................................................................................81 Text Extraction from Natural Scene Images .......................................................................81 5.1 Introduction........................................................................................................................81 5.2 Related Studies in Text Extraction ................................................................................83 5.3 Preprocessing.....................................................................................................................84. II.
(7) 5.4 Homogeneous Region Segmentation ...........................................................................85 5.4.1 5.4.2 5.4.3 5.4.4. Contrast Enhancement Using Toggle Mapping...............................................................85 Grayscale Image Smoothing ...........................................................................................85 Homogeneous Region Segmentation ..............................................................................86 Candidate Signboard Region Detection ..........................................................................86. 5.5 Character Detection from Candidate Signboard Regions ........................................89 5.5.1 Edge Detection ................................................................................................................89 5.5.2 Single Character Detection .............................................................................................91 5.5.3 Character Classification ..................................................................................................94. 5.6 Experiment and Results...................................................................................................97 5.6.1 Experimental Images.......................................................................................................97 5.6.2 Evaluation Results of Single Character Detection ..........................................................97 5.6.3 Discussion .......................................................................................................................99. 5.7 Summary ............................................................................................................................99 References .................................................................................................................................. 102. Chapter 6 .......................................................................................................................................105 Conclusions ..................................................................................................................................105 6.1 Summary .......................................................................................................................... 105 6.2 Future Works ................................................................................................................... 106. Acknowledgements ................................................................................................................... 109 List of Publications .................................................................................................................... 111. III.
(8) IV.
(9) Chapter 1 Introduction. This chapter first describes the situation of visually impaired people worldwide. Then, a general overview of the assistive technologies for the visually impaired is depicted and discussed. After that, the objectives of this dissertation are proposed. Finally, the contents of each chapter are summarized.. 1.1 Visually Impaired People There is a saying, “eyes are the windows to the soul”. For human beings with normal vision, they obtain information depend heavily on vision in daily living. Unfortunately, blind people obtain the information only through touching, listening, smelling, tasting, and moving. In 2010, World Health Organization (WHO) made a survey worldwide. The statistical result showed that there were approximately 285 million people suffer visual impairment, of whom 39 million were blind; 246 million had low vision [1]. About 90% of the visually impaired lived in developing countries. Approximately 65% of visually impaired people and 82% of blind people were aged 50 and older. An estimated 19 million of the visually impaired were children aged under 15. The number of visually impaired people is increasing rapidly with the growth of newborn population and so on; and every year, this number grows by up to 2 million worldwide. Because of visual disability, the abilities for performing daily tasks and interacting with surrounding world are limited or influenced. For example, it becomes difficult or impossible for visually impaired people to read, walk, drive, or recognize objects and find. 1.
(10) places. Normally, in daily life, study and work, the visually impaired need assistance from their family members, friends and caregivers. Therefore, if assistive technology can support visually impaired people in at least one of daily tasks, it is going to make a very relevant social impact [2].. 1.2 A Review for Assistive Technologies Until now, a number of technologies have been developed to support visually impaired people to live a more independent life. In the following subsections, part of typical assistive technologies are reviewed and categorized.. 1.2.1 Corrective Lens for Vision Assistance Corrective lenses are glass or plastic worn on or in front of the eye, and they are mainly used to treat myopia, hyperopia, presbyopia and astigmatism [3]. Corrective lenses aim to focus the object image at a single point on the retina. Thus, the use of corrective lenses is to improve vision by improving focus and correcting blur. However, corrective lenses are useless for blind people.. 1.2.2 Assistance in Mobility and Orientation Visually impaired people, especially the blind hope to walk or travel independently. Therefore, many technologies have been developed for the solution of walking assistance in the following three aspects: obstacle avoidance; navigation and orientation; and accessing environment.. 1.2.2.1. Aids for Mobility. Mobility can be defined as the capability to move safely, quickly, and effectively from one place to another. Not only blind people need the aids of mobility, but also some lowvision individuals may also need such support to help them walk without tripping or falling, cross streets, use public transportation and more. One of the most traditional mobility tools is the long cane (i.e., white cane) which is. 2.
(11) used to detect obstacles in the path of the visually impaired. However, a long cane provides only limited information about the environment due to its short length. Dogs can be trained to lead visually impaired people around obstacles, so they are called guide dogs. However, it is time consuming and cost expensive for training a dog, and a low probability of success restricts their use. Guide dogs are usually not responsible for orientation in a large environment. With the development of modern technology, many different types of assistances are proposed to support the visually impaired in mobility. For example, Electronic Travel Aids (ETAs) are commonly introduced to help visually impaired people avoid obstacles [4, 5]. For ETA devices, different types of range sensors are utilized to provide an audio or vibration in response while receiving reflected waves to nearby objects [6 - 12]. In recent years, a number of computer vision-based [13 - 18] and digital video camera-based [19 - 22] ETAs have been developed. However, multiple factors contribute to low market acceptance for these devices, such as cost, portability and performance.. 1.2.2.2. Aids for Orientation. Way-finding (or orientation) refers to the ability to know one’s location in an environment, and to find a route to a destination. In an unfamiliar environment, landmarks and signs are utilized to sighted people for way-finding, but they cannot be used directly for blind people to obtain the orientation and track the location. Braille for the feet and traffic lights with acoustic devices are common methods for assisting the visually impaired to walk outdoors. But they require wide laying and installation. Nowadays, a number of assistive navigation systems are designed based on the application of Global Positioning System (GPS). However, GPS devices have a similar characteristic: poor resolution in urban-environments and unavailable indoors [23]. A robotic indoor navigation system is proposed by Kulyukin et al. [24]. In this system, Radio Frequency IDentification (RFID) is utilized to read IC tags, but it is difficult for blind people to locate the tags at close range. Wi-Fi techniques are gaining momentum now, and they are expected to provide solutions for indoor localization [25]. However, Wi-Fi localization requires widely deployment in order to keep complete. 3.
(12) coverage, and it is a time consuming process for calibration.. 1.2.2.3. Aids for Accessing Environment. Street signages, traffic information signs and other public notices are commonly utilized for sighted people to find public places, and locate entrances or exists. However, these visual information are usually inaccessible to many visually impaired people. Therefore, a number of devices have been developed to support the visually impaired to access public places and locations. For example, audible indicators are used to alert doors being open and the time to cross pedestrian crossings. Infrared talking signs can be widely installed to aid blind people to cross light-controlled intersections and locate bus stops and so on. Through a hand-held receiver, blind users can receive the broadcasted information [26]. But infrared signs require costly installation and maintenance. Tactile maps [27] or talking tactile maps [28] also are widely used to indicate the layout of a street environment. Recent years, the technology developed for automatic reading text from natural scene images becomes an important application in assisting visually impaired people. Therefore, several aid systems have been developed to help visually impaired people read text from natural sceneries or product labels [29 - 35].. 1.2.3 Assistance in Verbal Information Access Reading is an essential daily task, but people with vision disabilities often are difficult to access the vast array of verbal information that sighted people can obtain easily. Verbal information mainly includes books, newspapers, documents, bills, and menus. Therefore, assistive technology should be developed to increase the accessibility for verbal information.. 1.2.3.1. Aids for Reading Printed Text. Visually impaired people to access printed text mainly through the following ways: sighted people is asked to narrate the text; magnifier is used to enlarge printed text; translator is applied to translate printed text into Braille or audible speech. With the. 4.
(13) progress of technology, the first method is on the wane. Magnification method is commonly an application of optical lenses, but it is useless for individuals who are completely blind. Currently, Optical Character Recognition (OCR) based devices are developed to recognize printed text. First, printed text is captured by a digital camera; and then the digital image is recognized to generate a text file; finally, the text file is turned into Braille (embossed onto heavy paper or presented with a tactile display such as DotView) or speech (outputted through a voice synthesizer). OPtical to TActile CONverter (Optacon) is a reading aided device that can translate printed text into Braille [36]. Another aided reading system is Moon. In this system, the embossed letter symbols are presented similar to ordinary printed types. Although the embossed letters can be read by many visually impaired people with less training, they are not very widespread [37]. Digital Accessible Information SYstem (DAISY) aims to provide digital audiobooks for people with print disabilities [38]. At present, eXtensible Markup Language (XML) and MP3 are recommended as DAISY standard to represent text content and audio content. An XML format can be easily converted into another format, such as Braille and audio format. For printed books, sighted people can easier to browse the table of content or index, skim the text, and locate immediately specific parts they are seeking. However, DAISY does allow these performances.. 1.2.3.2. Aids for Reading Text on Screen. Computer operation and web surfing have become an essential task in everyday life. For visually impaired people, especially blind people are difficult to operate a computer especially surf the web. Screen readers are a form of assistive technology that allow visually impaired people to read the content displayed on the computer screen through a speech synthesizer or Braille display. A screen reader is an interface which bridges the computer operation system and the user’s command [39 - 41].. 1.2.4 Assistance in Visual Information Access 5.
(14) Visual information generally includes pictures, figures, graphs, diagrams, and colors and so on. Visually impaired people to access these information mainly through the following two ways: (1) touching, that is, pictures, diagrams, graphs, and figures have to be presented as tactile graphics; (2) hearing, so, the visually impaired need to be told the name of colors. In recent years, several mobile camera phones and computers based colour identifiers have been proposed to recognize colours and tell the names of colours [42]. Currently, DAISY accepts SVG as the standard for digital figures. However, there is not technology developed for recognizing and translating printed figures into SVG format. Krufka and Barner [43], proposed an approach for automating producing tactile graphics from vector graphic images. However, many images are not yet in this format, and it is often not easy to get digital files, such as LaTex files, from the publishers. Therefore, a printed book often needs to be scanned and recognized before translating it into Braille, tactile graphics or speech. Tactile Graphics Assistant (TGA) is a software aims to translate bitmap images into tactile representations [44]. However, in the workflow of TGA, it needs human intervention and validation between each steps [45]. For example, the software of Photoshop is assumed to be applied for manipulating pure graphics.. 1.2.5 Assistance in Object Recognition In everyday life, we come into contact with a lot of objects in surrounding environment, for instance, we have to find commodities while shopping. Therefore, in order to support the visually impaired to recognize objects, in recent years, a new effort by the computer vision community has been made in recognizing generic objects from images. For example, ShelfScanner [46] is a system developed to assist visually impaired people in selecting commodities at a supermarket. In this system, captured images are recognized to select shopping items based on a known set. LookTel [47] is a software developed to detect and recognize objects such as packaged goods, CD covers, bank notes and more. However, until now, assistive technologies for visual object recognition achieved progress in only a few applications.. 6.
(15) Not only above mentioned technologies are developed to assist the visually impaired in navigation, reading, and object recognition, but also there are still many technologies have been proposed to assist the visually impaired in accessing music, game, sport, driving and other. Visually impaired people are very diverse in terms of the degree of visual disabilities and the level of personal abilities, thus for different individuals their needs are very different. Therefore, there are still many tasks need to be done. In the following section, research motivation of this dissertation is proposed and discussed.. 1.3 Research Background and Objective Visual information is widely used for studying, route finding, finding public places and other. However, visually impaired people, especially blind people, are difficult to access visual information unless they are represented non-visually, such as with Braille, tactile graphics, and speech. In this dissertation, we focus on the development of image processing to assist tactile graphic production, and text reading from natural scene images.. 1.3.1 Background 1.3.1.1. Tactile Graphic Production. For human beings, it is difficult to study mathematics, physics and chemistry only through text information, so graphs and figures are frequently used to help them to comprehend corresponding knowledge. However, most of these graphs and figures are presented in visual form, they cannot be utilized by many visually impaired students. Through tactile graphics, figures can be understood by the visually impaired. This is because tactile graphics are designed to be represented by raised surfaces that can be felt with fingertips. At the present time, there are more than 300,000 visually impaired people in Japan. Almost all of the schools for the visually impaired need tactile graphics for teaching and studying. However, in 80% of the blind schools, there is no department for producing tactile graphic teaching materials [48]. To make tactile graphics prior knowledge of their corresponding fields is needed. Thus most of the work for producing tactile graphic. 7.
(16) teaching materials is done by teachers while some of the work is done by volunteers. Until now, most tactile graphics are produced using less intelligent computer-aided systems, and some parts have to be made by hand, such as the painstaking work. Therefore, it is necessary to develop a computer-aided system for assisting the production of tactile graphics.. 1.3.1.2. Scene Text Reading. Around us, there are a lot of signs and notices that are used for searching route, finding public places and accessing variety of services. However, these information are inaccessible to many visually impaired people. Most visually impaired people, especially the blind hope to walk outdoors independently. But they often lose their ways while first visiting a new place. Therefore, technologies developed for automatically reading scene text play a key role in assisting people with visual impairment, especially low vision people, to find locations. Up to now, several portable or wearable camera-based devices have been proposed for assisting the visually impaired to read text in scenery. The characteristics of these devices are as follows: since such devices are based on software techniques that extract text information from scene images, installing infrastructures might not be required; we can provide them at a low price; and people with visual impairment can carry them easily when walking outdoors. These devices to read scene text through the following main procedures: capturing a scene image; extracting text from captured image; and translating extracted text into speech. However, each of these proposed devices has significant limitations. For instance, low accuracies for text region detection and assumptions for text layout. Therefore, it is necessary for us to develop a technology for automatically reading text from scene images with high accuracy.. 1.3.2 Objectives Based on the reasons above, this dissertation aims to the contributions as follows: (1) improve the accessibility for textbooks to visually impaired students; (2) support the visually impaired to access text information in the surrounding environment. Therefore,. 8.
(17) we are committed to the following efforts: (1) developing a technology to support the translation of graphs and figures in textbooks into tactile graphics; (2) developing a technology for automatically reading text from natural scenery.. 1.3.2.1. Translation of Mathematical Graphs into Tactile Graphics. Mathematical graphs are often line drawings, and they usually consist of the rays of the x-axis and the y-axis, straight lines, circles, arcs, ellipses and curves used to represent the mathematical expressions. Therefore, it is possible that computers are able to recognize mathematical graphs from printed materials for producing tactile graphics. Although many methods have been proposed for recognizing line drawings, in their methods, graphs have to satisfy many assumptions. For example, a graph has to be drawn in a box frame [49]; and a graph must not include broken lines or characters [50]. However, many mathematical graphs do not satisfy these assumptions. Almost all of the mathematical graphs have the following characteristics: (1) characters and mathematical formulas may be distributed in and around the graphs; (2) a character string or a mathematical formula may not lie on the horizontal orientation; (3) a graph may contains several types of broken lines. So the methods proposed in the past research cannot be applied to recognize mathematical graphs. Therefore, the first research issue contributes to the recognition of mathematical graphs.. 1.3.2.2 Translation of Hand-drawn Figures into Tactile Graphics We aim to develop a technology for assisting the production of tactile graphic teaching materials. Therefore, we focus on not only the mathematical tactile graphic production, but also the production of tactile graphics corresponding to the figures in physics, chemistry, and biology textbooks. However, we found that, for example, figures in physics textbooks are often not line drawings, they often have the following characteristics. (1) The figures in physics textbooks are often complex. But tactile graphics must be simple for reading and understanding. So original figures have to be simplified before producing tactile graphics. (2) The ability of reading tactile graphics depends deeply on blind people. So tactile graphics should be produced according to a blind person’s experience with reading tactile graphics. (3) There are two major types of. 9.
(18) (a) Original Image. (b) Image for Canny Edge. (d) Tactile Format. (c) Line Drawing. Figure 1.1: An Example for a Figure and Its Edge Image, Line Drawing and Tactile Format digital images: bitmap images and vector graphics. Vector graphics allow the transformation of scaling and rotation without image distortion, but bitmap images do not allow such transformation. However, figures in physics textbooks are often captured as bitmap images. (4) Figures in physics textbooks are often color images or grayscale images. It is difficult to use image processing to detect object edges where image brightness changes sharply. This is because, in the captured image, there are often not serious contrast at the edge of objects. Figure 1.1 (b) shows an example of detected edges for Figure 1.1 (a), but it cannot be used for producing tactile graphics. Therefore, Figure 1.1 (a) should be first translated into a line drawing such as Figure 1.1 (c), and the line drawing finally should be translated into a tactile graphic such as Figure 1.1 (d). Due to the reasons above, figures in physics textbooks often need to be redrawn before producing tactile graphics. There are a lot of software systems have been developed for creating figures. Most of. 10.
(19) these drawing systems have a menu or a toolbar. Therefore, users can draw a figure by using a mouse and a keyboard to click the buttons on the toolbar in order to choose an object for drawing. Some tablet PC based software systems are also developed with a manual input interface, so users can draw a figure by hand in a natural way. Because most of people who produce tactile graphics, are not familiar with computer operation, they tend to produce tactile graphics using less computer operation. So hand-drawn method might be an effective way to draw a figure. Based on the reasons above, we choose hand-drawn maps as a preliminary work of our study. Therefore, we aim to develop a system for automatic translation of hand-drawn maps into tactile graphics, and we contribute to do an experiment of usability evaluation in order to show whether hand-drawn method is an effective way for producing tactile graphics. Thus, the second research issue focuses mainly on the discussion of the usability issue, that is, which interface is good for users who are not familiar with computer operation: an interface with a mouse and a keyboard, and an interface with a hand-drawn input method.. 1.3.2.3 Extraction of Text from Natural Scene Images There are several studies related to text extraction from natural scene images. Most research use one of the following three techniques: (1) edge detection algorithms; (2) clustering algorithms for colored pixels [51 - 53]; and (3) image transforms such as Fourier transform and Discrete Cosine Transform (DCT) [54 - 56]. However, each of these methods has significant limitations. For example, character edges detected by the first method often connect to non-character edges; color clustering algorithm is difficult to determine the number of color regions, this is because there can be many different colors in a scene image. DCT is applied to detect character and non-character regions according to the cue features in the DCT coefficients, but for a complex image, it is not always true that the features in the DCT coefficients for character regions can be observed clearly than that for non-character regions [57]. Most methods used in past research first detect text regions in an image, and then segment the image into text and background. However, the performance of these methods. 11.
(20) relies on the text detection algorithm and image complexity. Scene text is usually presented on signboards, and the signboard surface usually has uniform color. Therefore, the ideal way for extracting characters from signboard regions is if a given captured image can be segmented into homogeneous regions. In the third research issue, we contribute to extract characters form scene images, the main work is image segmentation.. 1.4 Organization This dissertation consists of 6 chapters, it is designed so that each chapter is selfcontained and can be read on its own. In Chapter 1, a review of assistive technologies for the visually impaired is first described and discussed, and then the research motivations and objectives of this dissertation are introduced. In Chapter 2, tactile graphics and their design principles are depicted and discussed. Chapter 3 discusses a method for automatically translating mathematical graphs into tactile graphics. In this chapter, we mainly contribute to the work of graph recognition. Chapter 4 proposes a system that is developed for automated translation of hand-drawn figures into tactile graphics. In this chapter, we mainly focus on the usability evaluation for hand-drawn method. In Chapter 5, a method for extracting text from scene images is proposed, especially the algorithm for image segmentation. Finally, we conclude this dissertation in Chapter 6, where future works are also postulated.. 12.
(21) References [1] D. Pascolini and S. P. Mariotti, “Global Estimates of Visual Impairment: 2010”, British Journal Ophthalmology, Vol.96, No.5, pp.614-618, 2012. [2] R. Manduchi and J. Coughlan, “(Computer) Vision without Sight”, Communications of the ACM, Vol.55, No.1, pp.96-104, 2012. [3] http://en.wikipedia.org/wiki/Corrective_lens [4] B. B. Blasch, W. R. Wiener and R. L. Welsh, Foundations of Orientation and Mobility, AFB Press, Third Edition, 2010. [5] D. H. Yen, “Currently Available Electronic Travel Aids for the Blind”, http://www.noogenesis.com/eta/current.html, 2005. [6] A. G. Dodds, D. C. Carter and C. I. Howarth, “The Sonic PathFinder: An Evaluation”, Journal of Visual Impairment and Blindness, Vol.78, No.5, pp.203-206, 1984. [7] A. Heyes, “A Polaroid Ultrasonic Travel Aid for the Blind”, Journal of Visual Impairment and Blindness, Vol.76, pp.199-201, 1982. [8] I. Ulrich and J. Borenstein, “The Guide Cane-Applying Mobile Robot Technologies to Assist the Visually Impaired”, IEEE Transaction on Systems, Man, and Cybernetics-Part A: Systems and Humans, Vol.31, No.2, pp.131-136, 2001. [9] J. Barth and E. Foulhe, “Preview: A Neglected Variable in Orientation and Mobility”, Journal of Visual Impairment and Blindness, Vol.73, No.2, pp.41-48, 1979. [10] S. Shoval, J. Borenstein and Y. Koren, “The NavBelt - A Computerized Travel Aid for the Blind Based on Mobile Robotics Technology”, IEEE Transactions on Biomedical Engineering, Vol.45, No.11, pp.1376-1386, 1998. [11] L. Kim, S. Park, S. Lee and S. Ha, “An Electronic Traveler Aid for the Blind Using Multiple Range Sensors”, IEICE Electronics Express, Vol.6, No.11, pp.794-799, 2009. [12] C. Gearhart, A. Herold, B. Self, C. Birdsong and L. Slivovsky, “Use of Ultrasonic Sensors in The Development of An Electronic Travel Aid”, in Proceedings of the IEEE International Symposium on Sensors Applications, pp.275-280, 2009.. 13.
(22) [13] D. Yuan and R. Manduchi, “Dynamic Environment Exploration Using a Virtual White Cane”, in Proceedings of the IEEE Conference on Computer Vision and Pattern Recognition, Vol.1, pp.243-249, 2005. [14] V. Pradeep, G. Medioni and J. Weiland, “Piecewise Planar Modeling for Step Detection Using Stereo Vision”, in Proceedings of the Workshop on Computer Vision Applications for the Visually Impaired, 2008. [15] V. Pradeep, G. Medioni and J. Weiland, “Robot Vision for the Visually Impaired”, in Proceedings of the IEEE Computer Society Conference on Computer Vision and Pattern Recognition Workshops, pp.15-22, 2010. [16] J. Saez, F. Escolano and A. Penalver, “First Steps towards Stereo-based 6DOF SLAM for the Visually Impaired”, in Proceedings of the IEEE Computer Society Conference on Computer Vision and Pattern Recognition-Workshops, 2005. [17] J. Saez and F. Escolano, “Stereo-based Aerial Obstacle Detection for the Visually Impaired”, in Proceedings of the Workshop on Computer Vision Applications for the Visually Impaired, 2008. [18] J. Wilson, B. N. Walker, J. Lindsay, C. Cambias and F. Dellaert, “SWAN: System for Wearable Audio Navigation”, in Proceedings of the IEEE International Symposium on Wearable Computers, 2007. [19] P. Meijer, “An Experimental System for Auditory Image Representations”, IEEE Transactions on Biomedical Engineering, Vol.39, No.2, pp.112-121, 1991. [20] G. Sainarayanan, On Intelligent Image Processing Methodologies Applied to Navigation Assistance for Visually Impaired, Ph. D. Thesis, University Malaysia Sabah, 2002. [21] G. Balakrishnan, G. Sainarayanan, R. Nagarajan and S. Yaacob, “Wearable RealTime Stereo Vision for the Visually Impaired”, Engineering Letters, Vol.14, No.2, 2007. [22] G. P. Fajarnes, L. Dunai, V. S. Praderas and I. Dunai, “CASBLiP- A New Cognitive Object Detection and Orientation System for Impaired People”, in Proceedings of the 4th International Conference on Cognitive Systems, 2010. [23] A. Rodriguez, J. Javier Yebes, P. F. Alcantarilla, L. M. Bergasa, J. Almazan and A. Cela, “Assisting the Visually Impaired: Obstacle Detection and Warning System by Acoustic Feedback”, Sensors 2012, 12, pp.17476-17496, 2012.. 14.
(23) [24] V. Kulyukin, C. Gharpure and J. Nicholson, “RFID in Robot-Assisted Indoor Navigation for the Visually Impaired”, in Proceedings of the IEEE/RSJ International Conference on Intelligent Robots and Systems, pp.1979-1984, 2004. [25] A. M. Ladd, K. E. Bekris, A. P. Rudys, D. S. Wallach and L. E. Kavraki, “On the Feasibility of Using Wireless Ethernet for Indoor Localization”, IEEE Transaction On Robotics and Automation, Vol.20, No.3, pp.555-559, 2004. [26] W. Crandall, B. Bentzen, L. Myers and J. Brabyn, “New Orientation and Accessibility Option for Persons with Visual Impairment: Transportation Applications for Remote Infrared Audible Signage”. Clinical and Experimental Optometry, Vol.84, Issue 3, pp.120-131, 2001. [27] M. A. Hersh and M. A. Johnson, Assistive Technology for Visually Impaired and Blind People, Publisher: Springer-Verlag London, 2008. [28] S. Landau, “Tactile Graphics and Strategies for Non-visual Seeing”, Thresholds, Vol.19, pp.78-82, 1999. [29] N. Tanaka and M. Okudaira, “A Study on Image Processing for Action Assistance of Visually Impaired Humans Using a Camera Equipped Cellular Phone”, Technical Report of the Institute of Image Information and Television Engineers, Vol.33, Issue 6, pp.173-176, 2009. [30] N. Ezaki, K. Kiyota, B. T. Minh, M. Bulacu and L. Schomaker, “Improved TextDetection Methods for a Camera-based Text Reading System for Blind Persons”, in Proceedings of the 8th International Conference on Document Analysis and Recognition, pp.257-261, 2005. [31] S. M. Hanif and L. Prevost , “Texture Based Text Detection in Natural Scene Images: A Help to Blind and Visually Impaired Persons”, in Proceedings of Conference & Workshop on Assistive Technologies for People with Vision & Hearing Impairments Assistive Technology for All Ages, M.A. Hersh (Ed.), 2007. [32] M. Pazio, M. Niedzwiecki, R. Kowalik and J. Lebiedz, “Text Detection System for The Blind”, in Proceedings of the 15th European Signal Processing Conference, pp.272-276, 2007. [33] U. Kalai selvi and J. Anish Kumar, “Camera based Assistive Text Reading System using Gradient and Stroke Orientation for Blind Person”, International Journal of Latest Trends in Engineering and Technology , Vol.4, Issue 1, pp.325-330, 2014. [34] O. Foong and N. Razali, “Signage Recognition Framework for Visually Impaired 15.
(24) People”, in Proceedings of International Conference on Computer Communication and Management, pp.488-492, 2011. [35] C. Yi, Y. Tian and A. Arditi, “Portable Camera-based Assistive Text and Product Label Reading from Hand-held Objects for Blind Persons”, IEEE/ASME Transactions on Mechatronics, 2014. [36] J. C. Bliss, “Reading Machines for The Blind”, Active Touch - The Mechanism of Recognition of Objects by Manipulation: A Multidisciplinary Approach, G. Gordon (Ed.), Pergamon Press, Oxford, UK, 1978. [37] A. J. Hardwick, “Rendering of Moon Text on Simulated Tactile Diagrams for Blind Computer Users by Force-feedback”, Touch, Blindness and Neuroscience, S. Ballesteros Jiménez and M. A. Heller (Eds.), UNED Press, Madrid, Spain, pp.351358, 2004. [38] http://www.daisy.org/ [39] P. Blenkhorn and D. G. Evans, “The Architecture of a Windows Screen Reader”, Assitive Technology-Added Value to the Quality of Life (AAATE 2001), C. Marineek, C. Buhler, H. Knops, and R. Andrich (Eds.), IOS Press, Amsterdam, pp.119-123, 2001. [40] P. Blenkhorn, D. G. Evans and A. Baude, “Full Screen Magnification Using Direct X Overlays”, IEEE Transaction on Neural Systems and Rehabilitation Engineering, Vol.10, No.4, pp.225-232, 2002. [41] D. G. Evans and P. Blenkhorn, “Architectures of Assistive Software Applications for Windows-based Computers”, Journal of Network and Computer Applications, Vol.26, Issue 2, pp.213-228, 2003. [42] H. P. Lee, J. Huang, C. Chen, and T. Sheu, “Building a Color Recognizer System on the Smart Mobile Device for the Visually Impaired People”, in Proceedings of the 6th International Multi-Conference on Computing in the Global Information Technology, pp.95-98, 2011. [43] S. E. Krufka and K. E. Barner, “Automatic Production of Tactile Graphics from Scalable Vector Graphics”, in Proceedings of The 7th International ACM SIGACCESS Conference on Computers and Accessibility, pp.166-172, 2005. [44] R. E. Ladner, M. Y. Ivory, R. Rao, S. Burgstahler, D. Comden, S. Hahn, M. Renzelmann, S. Krisnandi, M. Ramasamy, B. Slabosky, A. Martin, A. Lacenski, S. Olsen and D. Groce “Automating Tactile Graphics Translation”, in Proceedings of the 7th International ACM SIGACCESS Conference on Computer and Accessibility, 16.
(25) pp.150-157, 2005. [45] C. Jayant, M. Renzelmann, D. Wen, S. Krisnandi, R. Ladner and D. Comden, “Automated Tactile Graphics Translation: In the Filed”, in Proceedings of the 9th international ACM SIGACCESS conference on Computers and accessibility, pp.7582, 2007. [46] T. Winlock, E. Christiansen and S. Belongie, “Toward Real-time Grocery Detection for the Visually Impaired”, in Proceedings of the Workshop on Computer Vision Applications for the Visually Impaired, 2010. [47] J. Sudol, O. Dialameh, C. Blanchard and T. Dorcey, “Looktel: A Comprehensive Platform for Computer-aided Visual Assistance”, in Proceedings of Workshop on Computer Vision Applications for the Visually Impaired, 2010. [48] S. Oouchi, M. Sawada, T. Kaneko and K. Chida, “A Survey on Making and Using Tactile Educational Materials in Schools for the Blind”, Bulletin of National Institute of Special Needs Education, Vol.31, pp.113-125, 2004. [49] T. Fuda, S. Omachi and H. Aso, “Recognition of Line Graph Images in Documents by Tracing Connected Components”, IEICE Transactions on Information and Systems, Vol.J86-D-Ⅱ, No.6, pp.825-835, 2003. [50] K. Shingai and R. Fukuda, “Recognition of the Line Images in Science Documents”, Technical Report of IEICE, PRMU, Vol.101, No.713, pp.69-74, 2002. [51] Y. Matsuda, S. Omachi and H. Aso, “String Detection from Scene Images by Binarization and Edge Detection”, IEICE, D, Vol.J93-D, No.3, pp.336-344, 2010. [52] H. Hase, M. Yoneda, M. Sakai and H. Maruyama, “Consideration of Color Segmentation to Extract Character Areas from Color Document Images”, IEICE, DII, Vol.J83-D-II, No.5, pp.1294-1304, 2000. [53] K. Ashida, H. Nagai, M. Okamoto, H. Miyao and H. Yamamoto, “Extraction of Characters from Scene Images”, IEICE, D-II, Vol.J88-D-II, No.9, pp.1817-1824, 2005. [54] Y. Liu, T. Yamamura, N. Ohnishi and N. Sugie, “Extraction of Character String Regions from a Scene Image”, IEICE, D-II, Vol.J81-D-II, No.4, pp.641-650, 1998. [55] S. Saitoh, H. Goto and H. Kobayashi, “Analysis and Comparison of Frequency Features for Scene Text Detection”, Technical Report of IEICE, PRMU2004-128, pp.31-36, 2004. 17.
(26) [56] D. Crandall, S. Antani and R. Kasturi, “Extraction of Special Effects Caption Text Events from Digital Video”, International Journal on Document Analysis and Recognition, Springer-Verlag, Vol.5, pp.138-157, 2003. [57] M. Inami, A Character String Extraction Method from Scene Images Using Edge Detection and Color Clustering, Master Thesis, Toyama Prefectural University, Japan, 2012.. 18.
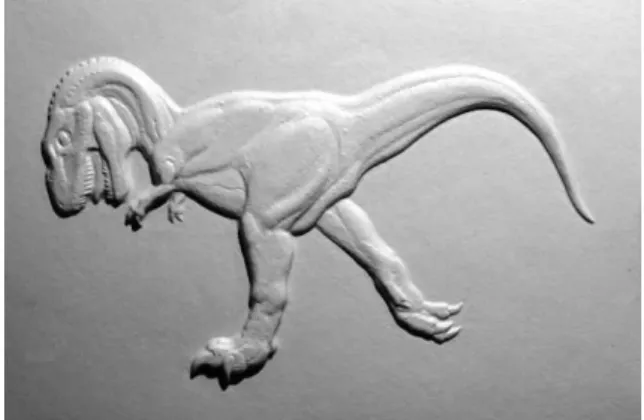
(27) Chapter 2 Tactile Graphics. In this chapter, the definition and the necessity for tactile graphics are first described. Then, the types and forms of tactile graphics are reviewed. Lastly, the principles for designing tactile graphics are summarized.. 2.1 Introduction Our society is so geared toward visual impressions. For human beings, they obtain information mainly through eyes. There are more and more descriptive and instructive materials which are presented as pictorial form, with or without additional text words. However, most of these pictorials are in visual form, they cannot be utilized by many visually impaired people. Images can be accepted by visually impaired people in various ways, for example, verbal descriptions, phonetic explaining, embossed patterns and other. One of the most common methods for the visually impaired is tactile graphics. This is because tactile graphics are designed to be represented by a raised surface, so visually impaired people can touch them with their fingertips. Therefore, the use of tactile graphics is to convey non-textual information. Figure 2.1 shows some examples of tactile graphics that are used to help people with visual impairment. Because of the accessibility for tactile graphics, in daily life, tactile graphics are widely used by blind people and partially-sighted people. In the following section, main types and forms of existing tactile graphics are introduced.. 19.
(28) (b) Thermoformed Graphic. (a) Craft Graphic. (c) Swell-form Graphic. (d) Braille-form Graphic. Figure 2.1: Examples for Tactile Graphics 20.
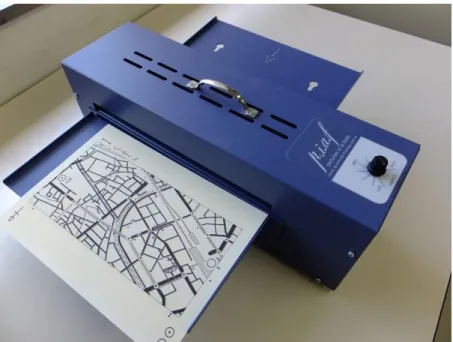
(29) 2.2 Types and Forms of Tactile Graphics (1) Pasted Tactile Graphics This tactile graphic is produced by simply attaching objects (e.g., strings, cloths and other materials) to a substrate in order to represent items and symbols. However, this is a time consuming work, as well as an expensive method, because it needs to manually paste all materials onto each substrate [1]. Figure 2.1 (a) shows an example for craft graphic. (2) Thermoformed Tactile Graphics Thermoform (also called vacuum forming) is one of the most common methods for producing tactile graphics. Thermoformed graphics are created through a process as follows: a sheet of plastic is first put onto a model; the plastic is then heated while the air between the sheet and the model is removed; finally a tactile graphic is formed [1]. As shown in Figure 2.1, (b) is a thermoformed graphic. However, this process is time consuming, because it needs to create a model before heating and forming a tactile graphic. (3) Tactile Graphics using Swell/Capsule Paper Swell paper (often referred to capsule paper, microcapsule paper) is a special paper that has a special coating of heat reactive chemicals. This process for producing tactile graphics is as follows: 1) printing a graphic onto a swell paper using a standard printer or copy machine, where black ink provides control over the raised surface area; 2) running the paper through a thermoform machine, and the heat reacts with the black ink and causes it to swell, the rest of the paper and other colors will remain flat [2]. Figure 2.2 shows an example of machine used for heating sell paper, and Figure 2.1 (c) is a swell-from graphic. It is a simple, fast and low cost method for creating tactile graphics by using swell papers. (4) Braille Graphics Braille embossers also can be used to produce tactile graphics. Figure 2.3 shows an example of Braille embosser, and Figure 2.1 (d) is a Braille graphic. Braille embosser is a special printer controlled by computer, it embosses a graphic onto paper through the use of solenoids that control embossing pins. But, these embossers are often expensive.. 21.
(30) Figure 2.2: Swell-Form Graphics Machine for Producing Tactile Graphics. Figure 2.3: Braille Embosser for Producing Tactile Graphics. 22.
(31) 2.3 Guidelines for the Design of Tactile Graphics Tactile graphics are not merely raised pictures, they are often used to interpret nontextual information. We have to take into account some design principles, [3 - 10], while producing tactile graphics. If users can use tactile graphics well, they will be free to take individual actions more freely and safely.. 2.3.1 Characteristics for Tactile Graphics (1) Tactile graphics can be read and understood easily. (2) Tactile graphics can accurately interpret what is to be conveyed. (3) Tactile graphics can be made individually according to user’s experience with reading tactile graphics. (4) Graphics are presented in high tactual quality.. 2.3.2 Basic Principles for the Design of Tactile Graphics (1) Tactile graphics should be designed as simple as possible, that is, a tactile graphic must include the minimum amount of information. Therefore, some parts of a diagram or sections of a map should be omitted if they does not convey essential contents, only relevant and referenced information is contained. (2) Tactile graphics should be made as tactually clear as possible, this means that the information represented in tactile graphics should be easy to read and understand. Therefore, they should use various height levels of tactile elevations and keep differences in the width of the lines. (3) It becomes hard to distinguish different symbols of objects if they are so similar or too close together. Therefore, space is required to keep the contrast in texture and lines. The space between symbols and lines should be larger than 1/4 inch, and the space between shapes with sides should be larger than 1/2 inch. (4) Because the ability for reading tactile graphics depends deeply on the user’s age 23.
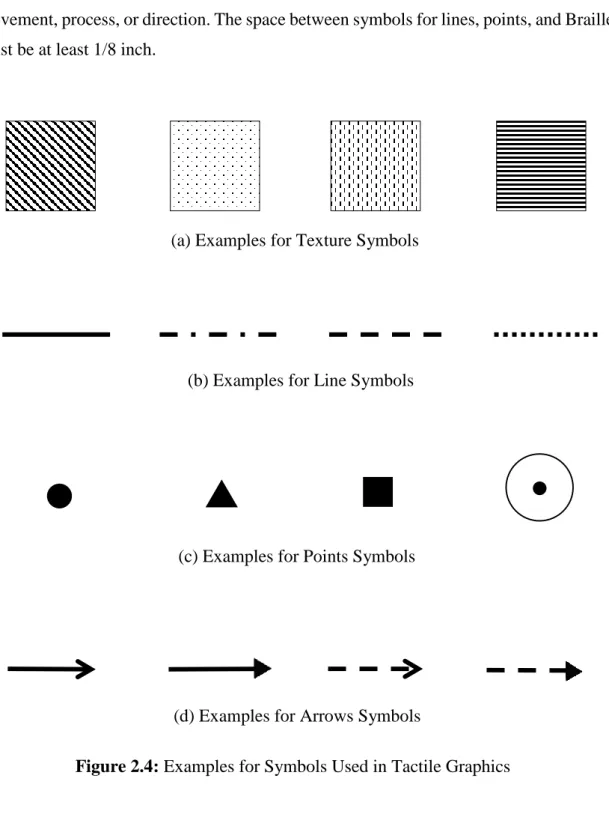
(32) level, knowledge level, experience with reading tactile graphics and more. The size and types of tactile graphics should be different for different readers, as well as appropriate language. Braille or embossing words can be used to instead of a key symbol or part of a graphic. (5) In order to improve the accessibility for tactile graphics, a complicated graphic should be represented by separate graphics showing partial information, or graphics for general and detailed information. (6) Tactile graphics should be created in 2 dimensions.. 2.3.3 Tactile Graphic Symbols For a tactile graphic, it needs to use different symbols to represent different components and objects. Due to the user’s skill level, it is necessary to limit the number of key symbols for drawing points, lines, and areas. A tactile graphic is commonly composed of four types of symbols: areas (texture), lines, point symbols and Braille labels. (1) Areas are used to represent regions of extent, for example, water or continents in a map. They have the following characteristics: variations in height; differences in the density or texture of the patterns; a line or white space between areas. Figure 2.4 (a) shows some examples for texture. (2) Lines are used to represent linear information, for example, rivers, routes, and outlines. The types of lines include solid lines, dashed and dotted lines. Figure 2.4 (b) shows some examples for line. (3) Point symbols are used to represent specific locations, for example, a city, point in a line graph. Figure 2.4 (c) shows some examples for point symbols. (4) Braille labels are used to explain and define all graphic symbols, either may be used to represent an area or point. They are often placed in the most appropriate locations: in the symbol; next to the symbol; or near the symbol and connected by lead line.. 24.
(33) An arrow is a linear symbol with direction, so it is often used as lead line, Figure 2.4 (d) shows some examples of arrow symbols. An arrow is commonly used to indicate a movement, process, or direction. The space between symbols for lines, points, and Braille must be at least 1/8 inch.. (a) Examples for Texture Symbols. (b) Examples for Line Symbols. (c) Examples for Points Symbols. (d) Examples for Arrows Symbols. Figure 2.4: Examples for Symbols Used in Tactile Graphics. 25.
(34) References [1] M. A. Hersh and M. A. Johnson, Assistive Technology for Visually Impaired and Blind People, Publisher: Springer-Verlag London, pp.143-145, 2008. [2] P. K. Edman, Tactile graphics, American Foundation for the Blind, New York, 1992. [3] M. G. Kwok, “Guideline for Tactile Figures and Maps”, in Proceedings of Guidelines on Tactile and Haptic Interactions, pp.43-47, 2005. [4] Braille Authority of North America, Guidelines and Standards for Tactile Graphics, 2010, Web Version, Retrieved from http://www.brailleauthority.org/tg/webmanual/index.html, 2011. [5] American Printing House for the Blind, Guidelines for Design of Tactile Graphics, http://www.aph.org/, 1997. [6] Rocky Mountain Braille Associates, Design Principles for Tactile Graphics, http://www.tactilegraphics.org/ [7] American Printing House for the Blind, Guide to Designing Tactile Illustrations for Children’s Books, http://www.aph.org, 2008. [8] T. Kaneko and S. Oouchi, “Practical Guidelines for Converting to Braille Dots Drawings and Characteristics of Tactile Drawings”, FY2002 research report of Department of Visual Impairment Education: Study on Tactile- and AuditoryPerceptible Teaching Materials Creation Systems for Individual Child with Visual Disability, NISE, pp.6-15, 2003. [9] T. Kaneko and S. Oouchi, “Tactile Graphics in Braille Textbooks: The Development of a Tactile Graphics Creation Manual”, NISE Bulletin, Vol.10, pp.13-28, 2010. [10] H. Jurgensen and C. Power, “Information Access for the Blind - Graphics, Modes, Interaction”, in Proceedings of Guidelines On Tactile and Haptic Interactions, pp.1325, 2005.. 26.
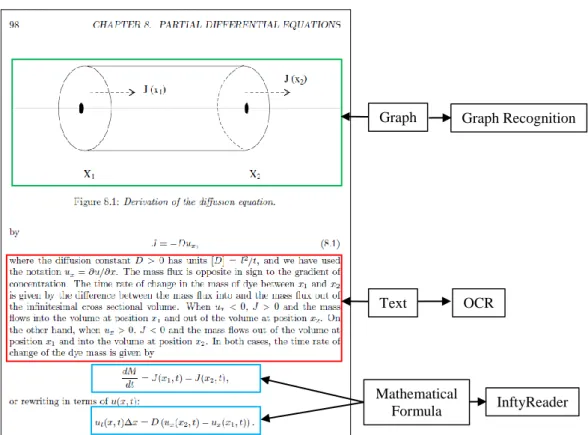
(35) Chapter 3 Automatic Translation of Mathematical Graphs into Tactile Graphics. This chapter discusses a method for automated translation of mathematical graphs into tactile graphics. First of all, some related research are reviewed. Second, a brief description for a method is described, i.e. separating a mathematical graph into solid line elements, broken line elements and character elements. Third, an algorithm for extraction of broken line graph elements is introduced. Fourth, a method for extraction of solid line graph elements is discussed. Lastly, the results of our computer experiments are discussed.. 3.1 Introduction For sighted students, there are all kinds of reading materials. However, for visually impaired students, reading materials are mainly limited to textbooks. In Japan, there are 70 schools for the visually impaired students. But in 80% of these schools, there is no department for producing tactile teaching materials [1]. Most of the work for producing tactile materials is done by teachers, and some work is done by volunteers. This is because making tactile teaching materials need advanced knowledge of its corresponding field. For example, to make a tactile graphic for teaching mathematics, professional mathematical knowledge is needed. Until now, most tactile graphics are produced using less intelligent computer-aided systems. Therefore, a better computer-aided system for automating translation of printed books into tactile graphics is needed. As shown in Figure 3.1, the textbooks of mathematics and science often include texts, mathematical. 27.
(36) Graph. Graph Recognition. Text. OCR. Mathematical Formula. InftyReader. Figure 3.1: A Page of Mathematics Book formulas/expressions and graphs, etc. To develop such a system for automatic translation of printed (must be scanned into digital format) or digital documents into tactile format, segmentation for document layout is required. This work had been done by Hirayama [2], Lee [3], and Ishitani [4]. If the document has been segmented into text regions, mathematical expression regions and figure/graph regions, then the software of OCR and InftyReader can be applied to recognize the texts and expressions respectively, finally the texts and expressions are converted into Braille format. The software of InftyReader is developed by InftyProject [5] which is a volunteer organization for helping people with visual impairment in scientific fields. One of the purposes of InftyProject is to digitize scientific documents such as mathematics journals and books, and it provides their tactile materials to the visually impaired. InftyReader can translate printed mathematical expressions into digital expressions such as LaTeX and MathML. However, because there is no intelligent system to translate printed 28.
(37) mathematical graphs into SVG (Scalable Vector Graphics) [6] images, the efficiency of work related to the translations is disturbed. Note that the DAISY (Digital Accessible Information System) consortium [7], which develops, maintains, and promotes the international standard of digital books for people with visual impairment, recently adopted SVG as the standard for digital figures. The work, reported by Krufka et al. [8], is done on automatically producing tactile graphics from scalable vector graphics. However, many images are not yet in SVG format. The Tactile Graphics Assistant (TGA) is a software to assist the translation of bitmap images into tactile representations [9]. However, human intervention and validation is necessary between each step of the workflow of TGA [10]. Therefore, a technology is needed for automated translation of figures in mathematics and science textbooks into tactile graphics. Based on the reasons above, the goal of this chapter is to develop a system to automatically translate mathematical graphs into tactile graphics. Therefore, techniques for mathematical graph recognition are needed in our system. So far, many graph recognition methods have been developed. Fuda et al. [11] studied a graph recognition method requiring that graphs must satisfy many assumptions; a graph, for example, has to be drawn inside a rectangular area that is specified by the x-axis and the y-axis. The graph recognition methods introduced by the literatures [12], [13], and [14] must also satisfy assumptions about graphs. However, many mathematical graphs do not satisfy all of the aforementioned assumptions. To facilitate the production of tactile graphics, we are developing a computer-aided system [15] for automating translation of printed mathematical graphs into SVG images. The following descriptions summarize the characteristics of the mathematical graphs we focus on. 1. Characters and mathematical formulas may be distributed in and around the graph. 2. A character string or a mathematical formula may not lie on the correct orientation (i.e., on the horizontal orientation). 3. Graphs may contain several types of broken lines.. 29.
(38) Input Image. Small Elements. Large Elements. Separation of Small Elements from Large Elements. Graph Elements. Separation of Rectangular Elements from Non-rectangular Elements Character Elements Non-rectangular Elements. Rectangular Elements. Local Segment Densities. Clustering. Broken Line Elements. Figure 3.2: Outline of Separation. A mathematical graph includes the following three elements: (1) solid line graph elements, (2) broken line graph elements, and (3) elements from character strings and mathematical formulas. This chapter focuses on mathematical graph recognition.. 3.2 Separation of Mathematical Graphs We have proposed a method [15] to separate a bitmap image of a mathematical graph into three parts: solid line elements, broken line elements, and character elements. Figure 3.2 shows the outline of the separation method. A clustering method is applied to the set of small elements, and as the result finds clusters so that each of them includes only broken line elements. The characteristics of these clusters are shown below. 30.
(39) type 1 type 2 type 3 (a) Dotted Lines. (b) Chain Lines Figure 3.3: Broken Lines. 1. For each of the clusters, 𝐺, almost all elements in 𝐺 are elements of the same broken line. 2. The elements of a single broken line are often divided into different clusters. So, the problem is how to find a cluster which includes all elements of a single broken line. We will discuss this issue in the following sections.. 3.3 Extraction of Broken Line Graph Elements Figure 3.3 shows examples of broken lines which we focus on. There are dotted lines and chain lines. Chain lines are further broken down into types 1, 2, and 3. In this section, we describe methods that classify a cluster from the previous section into a dotted line or a chain line. A dotted line consists of homogeneous rectangular elements, while a chain line is composed by two different kinds of rectangular elements: short elements and long elements. Therefore, elements of a dotted line can be classified into only one group, homogeneous rectangular elements. Similarly, elements of a chain line are classified into two different groups: one is for short elements, and the other is for long elements. If we can evaluate the number of homogeneous groups in a cluster, it enables us to classify the cluster into a dotted line or a chain line. To evaluate the optimal number of homogeneous groups (i.e., clusters), we measure by two cluster validities, 𝑉𝐷𝐵 (∙) and 𝑉𝐷 (∙) [16], whose definitions are given below. Given a set of 𝑘(≥ 2) clusters, Γ = {𝐺1 , ⋯ , 𝐺𝑘 }, 31.
(40) 1 k j VDB () max i k i 1 j ( j i ) vi v j . where for 𝑖 = 1, ⋯ , 𝑘, vi . x. G. x Gi. and i . . x Gi. i. (3.1). x vi Gi. ˆ(G ,G ) i j VD () min min 1i k 1 j k ( j i ) max{(G )} t 1t k . (3.2). Here, for any clusters 𝑆 and 𝑇, (S ) max{ (x, y)} and ˆ(S,T ) min { (x, y)} , x ,yS. x S , yT. and 𝛿(𝑥, 𝑦) is the distance between 𝑥 and 𝑦. Note that the larger the value of 𝑉𝐷𝐵 (∙), the better the clustering result. Similarly, the smaller the value of 𝑉𝐷 (∙), the better the clustering result. These two cluster validities are not defined when 𝑘 = 1, therefore, we introduce a fuzzy inference system to avoid this disadvantage.. 3.3.1 Dotted Line Classification In this subsection, we describe the dotted line classification method. The following description is the procedure for the dotted line classification method. Input: A cluster, 𝐺, of broken line elements. Output: If 𝐺 is a dotted line, return Yes, otherwise return No. Step 1: Single-linkage clustering is applied to cluster 𝐺, and let Γ𝑘 be the result when the number of clusters is 𝑘(𝑘 = 1, 2, 3, 4, 5). Calculate 𝑉𝐷𝐵 (Γ𝑘 ) and 𝑉𝐷 (Γ𝑘 ) for every 𝑘. Step 2: Apply a fuzzy inference system to 𝑉𝐷𝐵 (Γ𝑘 ) and 𝑉𝐷 (Γ𝑘 ). If 𝐺 is classified as a dotted line by the fuzzy inference system, then return Yes, otherwise return No. In the single-linkage clustering of Step 1, every element, 𝑒, in 𝐺 is represented by two characteristics: the number of the pixels of 𝑒, and the length of the long side of 𝑒.. 32.
(41) The calculation scheme of the fuzzy inference system is based on Mamdani’s fuzzy inference method [17], but the minimum operator is exchanged with the product operator. The fuzzy inference system has four arguments, 𝑥1 , 𝑥2 , 𝑥3 , and 𝑥4 , which are defined as follows. Let 𝐺 = {𝑒1 , ⋯ , 𝑒𝑛 }, a set of broken line elements, and let Γ𝑘 be a set of clusters of set 𝐺 ; and then, 𝑥1 = max 𝑉𝐷𝐵 (Γ𝑘 ) , 𝑥2 = min 𝑉𝐷 (Γ𝑘 ) , 𝑥3 = 2≤𝑘≤5. 2≤𝑘≤5. min 𝑝(𝑒𝑖 )⁄ max 𝑝(𝑒𝑖 ), and 𝑥4 = min ℓ(𝑒𝑖 )⁄ max ℓ(𝑒𝑖 ), where 𝑝(𝑒) is the number of. 1≤𝑖≤𝑛. 1≤𝑖≤𝑛. 1≤𝑖≤𝑛. 1≤𝑖≤𝑛. the pixels of element 𝑒 and ℓ(𝑒) is the length of the long side of element 𝑒. Fuzzy if-then rules are given below, and the membership functions are shown in Figure 3.4. Rule 1: If 𝑥1 is large, 𝑥3 is large, and 𝑥4 is large, then 𝐺 is probably a dotted line. Rule 2: If 𝑥2 is small, 𝑥3 is large, and 𝑥4 is large, then 𝐺 is probably a dotted line. Rule 3: If 𝑥1 is small, then 𝐺 is probably not a dotted line. Rule 4: If 𝑥2 is large, then 𝐺 is probably not a dotted line. Rule 5: If 𝑥3 is small, then 𝐺 is probably not a dotted line. Rule 6: If 𝑥4 is small, then 𝐺 is probably not a dotted line. A cluster is classified as a dotted line if the output value of the fuzzy inference systems is more than or equal to 0.5.. 3.3.2 Chain Line Classification Next, we will discuss a chain line classification method, which distinguishes clusters of elements of chain lines. If a cluster is classified as a chain line, the chain line classification method also gives its type. The following description is the procedure. Input: A cluster, 𝐺, of broken line elements. Output: If 𝐺 is classified as a chain line, return the type of 𝐺, otherwise return No. Step 1: Apply single-linkage clustering to 𝐺 by setting the number of clusters to 2, and then divide 𝐺 into two groups. Assign label ‘a’ to elements of one group, and label ‘b’ to elements of the other group. We then have a sequence of labels for 𝐺.. 33.
(42) 𝑦. 1 𝜇𝑠𝑚𝑎𝑙𝑙 (𝑥1 ). 1.0. 0. 1.0. 𝑦. 1 𝜇large (𝑥1 ). 1.0. 𝑥1. 2.0. 0. (a) Membership Functions for 𝑥1. 𝑦 1.0. 0. 3 𝜇small (𝑥3 ). 0.25. 𝑦 1.0. 𝑥3. 0. (c) Membership Functions for 𝑥3 𝑦 1.0. 2.5. 𝑥2. 4 𝜇small (𝑥4 ). 0.25 0.5. 4 𝜇large (𝑥4 ). 𝑥4. (d) Membership Functions for 𝑥4 𝜇pos (𝑥). 𝜇neg (𝑥). 0 0.15. 1.5. 2 𝜇large (𝑥2 ). (b) Membership Functions for 𝑥2. 3 𝜇large (𝑥3 ). 0.5. 2 𝜇small (𝑥2 ). 0.5. 0.85 𝑥. (e) Membership Functions for Consequence Figure 3.4: Membership Functions Step 2: Calculate similarity, 𝑆𝑝 (𝐺) (𝑝 = 1, 2, 3) , between the sequence and the template of a type 𝑝 chain line. Here, the template of type 1 chain lines is ababab ⋯ . Similarly, those of types 2 and 3 are abbabbabb ⋯ and abbbabbb ⋯, respectively. Step 3: If similarity 𝑆𝑝 (𝐺) is equal to the number of elements of 𝐺, then classify 𝐺 as a type 𝑝 chain line and return 𝑝, otherwise return No. For the sequence obtained by Step 1 and the template of a type 𝑝 chain line,. 34.
(43) similarity 𝑆𝑝 (𝐺) is defined as the largest number of successively matching labels.. 3.3.3 Broken Line Classification Lastly, the procedure for the broken line classification method is described below. Input: A set of clusters, Γ = {𝐺1 , ⋯ , 𝐺𝑡 }, from Section 3.2. Output: A set of dotted line clusters, ∆, sets of type 𝑝 chain line clusters, 𝑋𝑝 (𝑝 = 1, 2, 3), and a set of clusters, Φ. Step 1: Set ∆← ∅, 𝑋𝑝 ← ∅ (𝑝 = 1, 2, 3), and Φ ← ∅. Step 2: If Γ is empty, output ∆, 𝑋𝑝 (𝑝 = 1, 2, 3), and Φ, and stop the procedure. Step 3: Select 𝐺𝑖 from Γ, and set Γ ← Γ − {𝐺𝑖 }. If 𝐺𝑖 includes only one element, set Φ ← Φ ∪ {𝐺𝑖 } and go to Step 2. Step 4: Apply the dotted line classification method to 𝐺𝑖 . If 𝐺𝑖 is classified as a dotted line, set ∆← ∆ ∪ {𝐺𝑖 } and go to Step 2. Step 5: Apply the chain line classification method to 𝐺𝑖 . If 𝐺𝑖 is classified as a type 𝑝 chain line, set 𝑋𝑝 ← 𝑋𝑝 ∪ {𝐺𝑖 } and go to Step 2. Step 6: Divide set 𝐺𝑖 into three groups, 𝐺𝑖′ , 𝐺𝑖′′ , and 𝐺𝑖′′′ , in the following way. Suppose 𝑆𝑝 (𝐺𝑖 ) is the greatest among the three similarities, 𝑆1 (𝐺𝑖 ), 𝑆2 (𝐺𝑖 ), and 𝑆3 (𝐺𝑖 ). Then, separate the elements of the sequence for 𝐺𝑖 which gives similarity 𝑆𝑝 (𝐺𝑖 ), and let 𝐺𝑖′ denote the set of these elements. Furthermore, let 𝐺𝑖′′ and 𝐺𝑖′′′ denote the set of elements in 𝐺𝑖 which are located on the left and the right side of 𝐺𝑖′ , respectively. Step7: 𝐺𝑖′ is classified as a type 𝑝 chain line. Add 𝐺𝑖′ to set 𝑋𝑝 , and also add 𝐺𝑖′′ and 𝐺𝑖′′′ to set Γ. Go to Step 2.. 3.3.4 Merging Clusters Since the broken line classification method divides a cluster into several groups until every cluster is classified into one of the four types of broken lines, we need a merging process that combines clusters consisting of elements from the same broken line into a single cluster. If two clusters, 𝐺1 and 𝐺2 , satisfy the following two geometric characteristics, it is plausible that 𝐺1 and 𝐺2 are merged into a single cluster: (1) the. 35.
図
+7


関連したドキュメント
義 強度行動障害がある者へのチーム 支援に関する講義 強度行動障害と生活の組立てに関 する講義
From the viewpoint of the emission responsibility, this study focuses on the both direct and indirect CO 2 emission from all sectors by integrating sector estimates to support
3月6日, 認知科学研究グループが主催す るシンポジウム「今こそ基礎心理学:視覚 を中心とした情報処理研究の最前線」を 開催しました。同志社大学の竹島康博助 教,
The present article focuses on the reaching behavior of one 10-year-old boy with severe motor and intellectual disabilities as an indicator of his awareness of his surroundings,
(質問者 1) 同じく視覚の問題ですけど我々は脳の約 3 分の 1
議会」 「市の文化芸術振興」 「視聴覚教育」 「文化財の 保護啓発・管理」
2020 年 9 月に開設した、当事業の LINE 公式アカウント の友だち登録者数は 2022 年 3 月 31 日現在で 77 名となり ました。. LINE
「系統情報の公開」に関する留意事項
