Study on Relation between Spray Characteristics in Near-Field Region and Characteristics of Diesel Combustion in High Boosted Surrounding Gas
10
0
0
全文
(2) Dittapoom Shinabuth et al / International Journal of Automotive Engineering Vol.12, No.2(2021) RCEM is an electronically controlled and hydraulically actuated driving system which can simulate intake, compression, expansion and exhaust strokes in a single diesel cycle. RCEM was used as a rapid compression machine RCM to achieve the diesel combustion at constant volume condition in this study. The flame was a luminous diffusion flame observed through optical quartz window inserted in the cylinder head. The flame was captured by NAC GX-1 high speed camera with recorded frame rate of 10,000 fps, exposure time of 3 µs and image resolution of 464x464 pixels. The camera was fitted with Nikon 200 mm f/4 AF-D macro lens. In addition to avoid undesirable wavelength during flame imaging, a HOYA HA-50 infrared filter was placed in front of the camera for infrared cutoff. For emission measurement, soot concentration was measured by passing exhaust gas from combustion chamber through the filter paper using a vacuum pump. Smoke was trapped by a filter paper placed inside a smoke holder and it was then measured using GSM-3 smoke meter manufactured by TSUKASA SOKKEN. For NOx concentration measurement, exhaust gas was drawn passing through burned gas collecting tube with temperature controlled at 120°C and then entering SHIMADZU NOA-7000 NOx-O2 analyzer. In order to achieve high compressed ambient gas pressure at TDC before fuel injection, the tapered-type configuration of piston head fitted with small-volume combustion chamber was designed and shown in Fig. 2. Table 1 shows the experimental conditions. The orifice sizes D used were 0.180, 0.134 and 0.072 mm which had different. Driving unit Fuel filter. High pressure pump Accumulator. Common rail PC. Common rail Pilot check valve. Spool valve. Fuel tank. RCEM and injection PC. Cylinder block. Delay generator IR filter. Camera PC. Oscilloscope. Driving piston Injector. Injector driver. High-speed camera. Charge amplifier. Quartz window. Piston. Piezoelectric Pressure sensor. Combustion chamber. Laser displacement sensors. Smoke filter holder. NOx-O2 Analyzer. Burned gas collecting tube. Vacuum pump. Mixing tank with temp. controlled. Air cylinder. Combustion Chamber Fuel injection. 60 mm. A. 30 mm. Fig. 1 Experimental setup for high-speed imaging and emission measurement driven by rapid compressionexpansion machine.. 40 mm. A. A-A. Fig. 2 Combustion chamber for high temperature and high pressure test.. Table 1 Experimental conditions. RCEM and Chamber specifications Piston speed 30 ms/comp. (~1200 rpm) Bore x Stroke 30 x 150.5 mm Displacement 425.32 cc Compression ratio 12.1 Injection conditions Nozzle hole number 1 (all nozzles) Orifice diameter D, 0.180 mm, 0.5 mm, (2.77) Nozzle hole length L, 0.134 mm, 0.5 mm, (3.73) (L/D) 0.180 mm, 0.8 mm, (4.44) 0.072 mm, 0.5 mm, (6.94) Fuel temperature 310 K (± 10 K) Injection pressure 150 MPa Injection duration 2.1 ms Injected fuel amount 3.3 – 19.8 mg Overall equivalence ratio 0.03 – 0.67 Fuel properties n-paraffins % mass C12H26 : 11.6% C13H28 : 62.6% C14H30 : 25.7% Critical pressure 1.67 MPa Critical temperature 677 K Density at 300 K 745.3 kg/m3 Surface tension at 300 K 20.8 mN/m Surrounding conditions Oxygen 21% Pressure (Pg) 3, 6, 9 and 12 MPa Temperature (Tg) 890 K 11.7, 23.4, 35.2 and 46.8 kg/m3 Density (g). and emission particularly at relevant condition of the current heavy diesel engine. We hypothesized that the nozzle geometry would significantly affect the spray process especially at nearnozzle field region and expect to result in downstream mixture. This is because during combustion, burned gas at flame periphery tends to prevent or slowdown entrainment of surrounding gas. Then, surrounding gas condition that generally contributes substantial effect on atomization and mixing processes was considered as a studied parameter together with nozzle specifications. The near-field spray imaging technique was successfully conducted. Some distinct mixture behaviors had evidently been found. The present study is to investigate the combustion and emission characteristics regarding the variations of surrounding gas conditions and the nozzle specifications that are identical set with the previous conducted near-field spray experiment [10], and to clarify the relation between the characteristics of fuel/air mixture formation in near-nozzle field and that of combustion in downstream of spray flame in the wide range of surrounding densities including high boosted conditions. 2. Experimental Setup After a single-shot compression, combustion at constant volume during piston stopping at TDC was taken place, luminous flame photo with soot and NOx emissions were recorded. Detailed experimental setup is shown in Fig. 1. The compression unit used to simulate the desired ambient conditions employed a rapid compression and expansion machine RCEM [11] equipped with a cylinder block and fuel injection unit.. Copyright 2020Society Society AutomotiveEngineers EngineersofofJapan, Japan, Inc. Inc. All All rights Copyright © 2021 of of Automotive rights reserved reserved. 63.
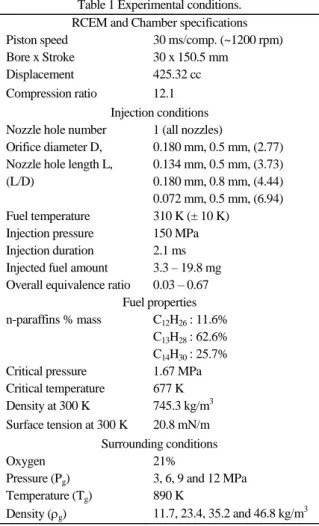
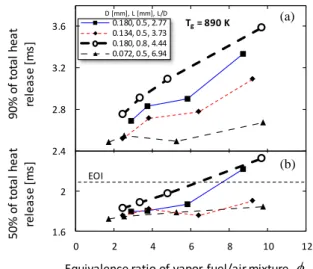
(3) Dittapoom Shinabuth et al / International Journal of Automotive Engineering Vol.12, No.2(2021) nozzle hole lengths L of 0.5 mm and 0.8 mm for D=0.180 mm. The injection duration was set to be constantly at 2.1 ms. The operating gas condition at TDC was four studied points which all had identical estimated temperature of 890 K.. information extracted from the images was then used for estimation of fuel mixture in the near-field spray. It was reported that an increase in gas density showed substantially produced vapor fuel, larger vapor cone angle, shorter liquid length and higher entrained gas amount. Fig. 4 shows the effect of gas density on equivalence ratio based on vapor fuel . The global fashion indicated that large amount of vapor fuel existing at low gas density and significantly decreasing as an increase in gas density was due to entrainment of surrounding gas into spray. With identical orifice diameter of 0.180 mm, the shorter hole length nozzle of L=0.5 mm reported the richer vapor fuel/air mixture at about gas density of 20-46.8 kg/m3 compared with the longer hole length nozzle of L=0.8 mm.. 3. Spray Characteristics in Near-Nozzle Field [10] This is a brief review of our previous study on spray characteristics in near-nozzle field. Fig. 3 shows the measured injection rate based on Zeuch’s test method which was activated by 2.2-ms injection signal. The square-shaped rate of fuel injection is observed for all four nozzles. The lowest rate of fuel injection is found to be the nozzle of D=0.072 mm (L/D=6.94). It is noted that the nozzle L/D ratio of 2.77 and 4.44 comes with identical orifice diameter of 0.180 mm. Comparing between D=0.180 mm (L/D=4.44) and D=0.180 mm (L/D=2.77) which are identical orifice size, the longer hole length nozzle provides the higher rate of fuel injection. In spray visualization, all four nozzles were used for near-field spray study using a rapid compression and expansion machine under surrounding gas density of 7-46.8 kg/m3. High-speed microscopy experiment was performed to simultaneously capture vapor and liquid phase diesel fuel injection behavior at near-field 20-mm region. The. 4. Combustion Characteristics This section describes the combustion and emission characteristics which is an extension part of the previous nearfield spray report. The last subsection presents the estimated equivalence ratio of vapor fuel/air mixture at start of combustion and the comparison of NOx formation between calculated and measured data. 4.1. Cylinder pressure and rate of heat release. Fuel mass flow rate [mg/ms]. 14. D [mm], L [mm], L/D. 12 10. Cd = 0.79. 8. The histories of in-cylinder pressure and apparent rate of heat release under 10 test repetitions for gas density of 11.7 kg/m3 and 46.8 kg/m3 are shown in Fig. 5a and Fig. 5b respectively. The injection starts at 0 ms time after start of injection ASOI and then lasts for 2.1 ms. Fig. 5a presents low gas density condition of 11.7 kg/m3 which corresponds to the surrounding gas pressure of 3 MPa. The ignition delay is relatively long due to low gas density affecting limited atomization process and entrained gas amount. It is detected to be 0.7-0.82 ms ASOI for all nozzle specifications. After 0.82 ms ASOI, the pressure rises sharply due to intensive combustion which is caused by large amount of fuel/air mixture accumulated during ignition delay period. The cylinder pressure is clearly ranged according to injected fuel amount shown in Fig 3. Although, the beginning stage of combustion on both nozzles of D=0.180 mm shows relatively comparable level of pressure, the combustion peak pressure of the shorter hole length nozzle of D=0.180 mm (L/D=2.77) noticeably shows the lower level of pressure due to low amount of fuel delivery limiting the input energy for combustion. In apparent rate of heat release curve, the premixed combustion phase is clearly observed before 1 ms ASOI, as the first peak rises and sudden drops approximately at 1.4 ms ASOI for both large orifice nozzles of D=0.180 mm and D=0.134 mm. Comparing between identical orifice size nozzle of 0.180 mm, the longer hole length nozzle shows higher rate of heat release during premixed combustion phase due to longer ignition delay. After the premixed phase ends at 1.35 ms ASOI, the combustion enters the diffusion combustion phase which the rate of fuel delivery plays a dominant role. Both nozzles shows comparable manner of rate of heat release until the end of injection at 2.1 ms ASOI. It can be seen that the nozzle D=0.180 mm (L/D=2.77) shows a slightly lower pressure at late combustion phase, it is an indicator for the better soot oxidation process.. 0.180, 0.5, 2.77 0.134, 0.5, 3.73 0.180, 0.8, 4.44 0.072, 0.5, 6.94. Cd = 0.85. Cd = 0.75. 6 4. L D. Cd = 0.82. 2 0 -2 0. 1. 2. 3. 4. 5. Time [ms] Fig. 3 Comparison of measured fuel injection rate by Zeuch’s method for different nozzle specifications. An insert shows the definition of nozzle hole length L and orifice size D [10].. Equivalence ratio of vapor fuel/air mixture, NF. 12 D (mm), L (mm), L/D. Tg = 890 K. 10. 0.180, 0.5, 2.77 0.134, 0.5, 3.73 0.180, 0.8, 4.44 0.072, 0.5, 6.94. 8 6 4 20 mm. 2 0 0. 10. 20. 30. 40. Density of surrounding gas. 50. 60. [kg/m3]. Fig. 4 Effect of surrounding gas density on equivalence ratio of vapor fuel/air mixture from previous experiment [10].. Copyright 2020Society Society AutomotiveEngineers EngineersofofJapan, Japan, Inc. Inc. All All rights Copyright © 2021 of of Automotive rights reserved reserved. 64.
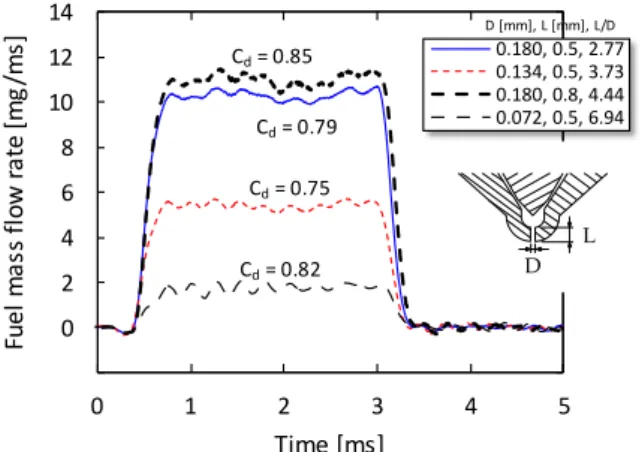
(4) Dittapoom Shinabuth et al / International Journal of Automotive Engineering Vol.12, No.2(2021) g = 11.7 kg/m3. 0.134, 0.5, 3.73 0.072, 0.5, 6.94 700. Injection. 600 500. 5. 400. 4. 300 3. 200. (a). 2. 100. 1. 0. 0. Rate of heat release [J/ms]. Cylinder pressure [MPa]. 7 6. the vapor fuel highly produced was due to the enhanced mixing process by better atomization and high spray dispersion as it was reported in our previous study [10]. The rich mixture based on vapor phase fuel of the shorter hole length nozzle was obtained from the near-field experiment, far-field mixture is however believed to improve further and reach favorable condition for spontaneous ignition due to large entrained gas. Consequently, the richer vapor fuel/air mixture of shorter hole length nozzle of D=0.180 mm (L/D=2.77) evidently shows combustion proceeding more efficiently than that of the longer hole length nozzle at high boosted gas condition.. D [mm], L [mm], L/D. 0.180, 0.5, 2.77 0.180, 0.8, 4.44. Tg = 890 K. -100 0. 1. 2. 3. 4. 5. 6. 4.2. Ignition delay and combustion process. Time after start of injection [ms] g = 46.8 kg/m3 18. 0.134, 0.5, 3.73 0.072, 0.5, 6.94 700. Injection. 600. 16. 500 14. 400. 12. 300. (b). 10. 200 100. 8. 0. 6. Rate of heat release [J/ms]. 0.180, 0.5, 2.77 0.180, 0.8, 4.44. Tg = 890 K. Cylinder pressure [MPa]. The ignition delay is considered from the time after start of injection to first rate of heat release becoming positive value after heat absorbed by the evaporating fuel. Combustion of a liquid fuel in an oxidizing gas actually happens in the gas phase. It is the vapor that burns, not the liquid. From now on, the equivalence ratio of vapor fuel/air mixture in the near field which was obtained from the previous near-field spray study and presented in section 3 is introduced for quantitative discussion on effect of near-field mixture preparation on combustion and emissions. According to Fig. 4, it can be concluded that the lower equivalence ratio of vapor fuel/air mixture is the consequence of the mixture under high surrounding gas density while the higher equivalence ratio of vapor fuel/air mixture is the result of the mixture under low surrounding gas density. Fig. 6 clearly shows that ignition delay increases by an increase in equivalence ratio of vapor fuel/air mixture. It is found that the shortest igntion delay in all ranges of equivalence ratio of vapor fuel/air mixture is at the nozzle of D=0.180 mm (L/D=2.77) due to high entrainment. However, ignition delay tends to increase more significantly at high equivalence ratio. From our previous spray data, it was reported that the nozzle of D=0.180 mm (L/D=2.77) showed lack of atomization and vaporization processes at low gas density condition which is equivalent to high equivalence ratio in Fig. 6. The cumulative apparent heat release normalized by its maximum value which has similar characteristics to the burned mass fraction is used for determination of progress of combustion. Fig. 7 shows 90% and 50% of total heat release for. D [mm], L [mm], L/D. -100 0. 1. 2. 3. 4. 5. 6. Time after start of injection [ms]. Fig. 5 Cylinder pressure and rate of heat release at different surrounding gas densities. (a) 11.7 kg/m3 and (b) 46.8 kg/m3. Fig. 5b shows the cylinder pressure and apparent rate of heat release at the highest gas density conducted in this experiment of 46.8 kg/m3 which is classified as high boosted surrounding gas. At TDC position, the cylinder pressure achieves almost 12 MPa with 0.44 MPa maximum variation of cylinder pressure under 10 test repetitions. It is seen that the premixed combustion phase is suppressed because the higher gas density enhanced entrainment and mixing processes and resulting in shorter ignition delay. The combustion of all nozzles is almost diffusion combustion. In the pressure rise curve, it is interesting that the ignition delay obviously becomes shorter for D=0.180 mm (L/D=2.77). This result is consistent with the rate of heat release beginning to rise earlier compared with that of D=0.180 mm (L/D=4.44). The cylinder pressure of D=0.180 mm (L/D=2.77) shows a slightly higher throughout the injection duration. The peak pressure of 16.2 MPa is detected and almost equal for both nozzles of D=0.180 mm (L/D=2.77) and D=0.180 mm (L/D=4.44). However, slightly lower peaks of rate of heat release for the shorter hole length nozzle of D=0.180 mm (L/D=2.77) are observed at 1.2 ms ASOI and 2.5 ms ASOI for the first and second peaks respectively. The shorter hole length nozzle is remarkable lower fuel delivery. Even though small amount of lower rate of fuel injection of the shorter hole length nozzle, the comparable peak pressure is reported. This is an evidence from our previous near-field spray characteristics that the D=0.180 mm (L/D=2.77) achieved the highest amount of fuel vapor produced and the highest entrained gas amount. It is noted that. 1. Ignition delay [ms]. Tg = 890 K 0.8. 0.6 D [mm], L [mm], L/D. 0.4. 0.180, 0.5, 2.77 0.134, 0.5, 3.73 0.180, 0.8, 4.44 0.072, 0.5, 6.94. 0.2 0. 2. 4. 6. 8. 10. Equivalence ratio of vapor fuel/air mixture,. 12. NF. Fig. 6 Variation of equivalence ratio of vapor fuel/air mixture with ignition delay for different nozzle specifications.. Copyright 2020Society Society AutomotiveEngineers EngineersofofJapan, Japan, Inc. Inc. All All rights Copyright © 2021 of of Automotive rights reserved reserved. 65.
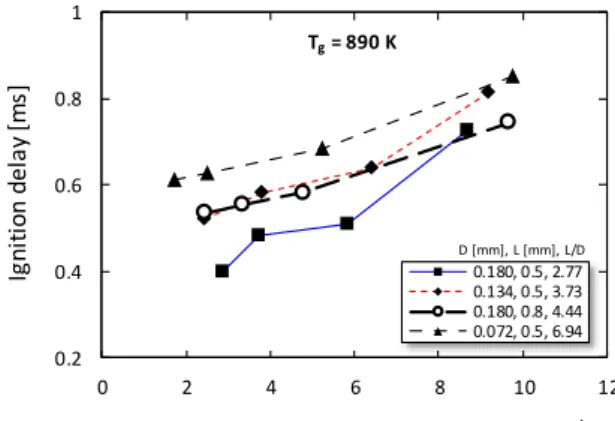
(5) Dittapoom Shinabuth et al / International Journal of Automotive Engineering Vol.12, No.2(2021). 50% of total heat release [ms]. 90% of total heat release [ms]. D [mm], L [mm], L/D. 0.180, 0.5, 2.77 0.134, 0.5, 3.73 0.180, 0.8, 4.44 0.072, 0.5, 6.94. 3.6. orifice size nozzle of D=0.072 mm (L/D=6.94) and D=0.134 mm (L/D=3.73), the soot fluctuates with a limited range of 0.0010.002 at the equivalence ratio of 1.8-6.5. As an increase in the equivalence ratio, the soot generated by the nozzle D=0.134 mm (L/D=3.73) considerably increases due to richer mixture leading to incomplete combustion while the nozzle D=0.072 mm (L/D=6.94) still keeps similar low soot level. The possible reason is that the smallest orifice nozzle of 0.072 mm delivers very small injected fuel amount with a small orifice size producing lean mixture in downstream region. The soot formation is possible to be slowdown due to high oxygen content in the mixture and the soot oxidation is promoted in the late phase of combustion. Comparing between the identical orifice size nozzle of D=0.180 mm but different hole length of L=0.5 mm and L=0.8 mm, the longer hole length nozzle produces larger amount of soot at the equivalence ratio of 2.2-8.2. The shorter hole length nozzle has a tendency to produce more soot as the equivalence ratio increases beyond 8.5 where an intersection point of both slopes exists. This result of different hole length effect is consistent with the previous subsection of discussion about combustion characteristics. The shorter hole length nozzle has shown the combustion improved significantly compared with the longer one at elevated gas density which condition is equivalent to low equivalence ratio of vapor fuel/air mixture in Fig. 8. However, it tends to be the significantly produced amount of soot at high equivalence ratio because the mixing process. (a). Tg = 890 K. 3.2. 2.8. 2.4. (b) EOI 2. 1.6 0. 2. 4. 6. 8. 10. 12. Equivalence ratio of vapor fuel/air mixture, NF. Fig. 7 Influence of equivalence ratio of vapor fuel/air mixture on combustion phasing. (a) 90% of total heat release and (b) 50% of total heat release. Fig. 7a and Fig. 7b respectively. In Fig. 7b, all nozzle specifications shows comparable result of 1.7-1.8 ms ASOI at low equivalence ratio of vapor fuel/air mixture. It is fluctuated with in small range for the nozzle of D=0.134 mm and D=0.072 mm while rising tendency at increasing equivalence ratio of vapor fuel/air mixture is observed for the nozzle orifices of D=0.180 mm. This is because high amount of fuel injection needs longer times for proceeding combustion and improper mixture preparation in case of poor spray process. The shorter hole length nozzle of L=0.5 mm which corresponds to L/D=2.77 reaches the center of combustion faster compared with the longer hole length nozzle of L=0.8 mm in whole range of the equivalence ratio. This is owing to the better mixing process of the shorter hole length nozzle responsible for faster combustion. In Fig. 7a, the variation turns upwards suggested that longer time is required to complete combustion as the equivalence ratio increases for the nozzle of D=0.134 mm and D=0.072 mm. For rough observation, the combustion using longer hole length nozzle spends longer time from start of injection through the end of combustion compared with that of the shorter one. It can be implied that the well-prepared mixture of the shorter hole length nozzle is supposed to continue with consistent manner throughout injection process, so that it achieves faster rate of combustion. From this point, the soot emission produced by the longer hole length nozzle is expected to be higher.. 0.012. ms oot / mf. D [mm], L [mm], L/D. Tg = 890 K. 0.180, 0.5, 2.77 0.134, 0.5, 3.73 0.180, 0.8, 4.44 0.072, 0.5, 6.94. 0.008. 0.004. 0 0. 2. 4. 6. 8. 10. 12. NF. Equivalence ratio of vapor fuel/air mixture,. Fig. 8 Soot mass normalized by injected fuel amount versus equivalence ratio of vapor fuel/air mixture. 0.12. D [mm], L [mm], L/D. Tg = 890 K. 0.180, 0.5, 2.77 0.134, 0.5, 3.73 0.180, 0.8, 4.44 0.072, 0.5, 6.94. 0.1. mNOx / mf. 4.3. Measured soot and NOx emissions Soot emission is formed in the fuel-rich region of reaction zone and it is as a product of incomplete combustion. Soot amount in exhaust gas was found to influence by in-cylinder flow motion and flame-flame interaction [17] even in expansion stroke affecting radial flow velocity leading to enhanced soot oxidation. Soot produced in diesel combustion chamber consists of both formation and oxidation processes. Fig. 8 shows soot emission measured by 10 repetitions for each test condition with variation of equivalence ratio of vapor fuel/air mixture in the near field for different nozzle specifications. For small. 0.08 0.06 0.04 0.02 0 0. 2. 4. 6. 8. 10. Equivalence ratio of vapor fuel/air mixture,. 12. NF. Fig. 9 NOx mass normalized by injected fuel amount versus equivalence ratio of vapor fuel/air mixture.. Copyright 2020Society Society AutomotiveEngineers EngineersofofJapan, Japan, Inc. Inc. All All rights Copyright © 2021 of of Automotive rights reserved reserved. 66.
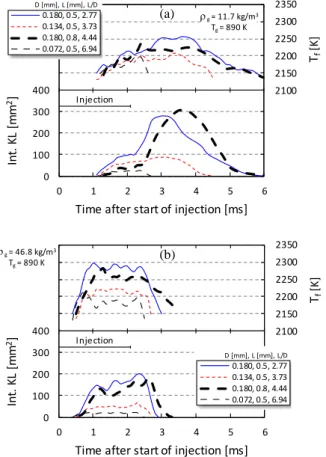
(6) Dittapoom Shinabuth et al / International Journal of Automotive Engineering Vol.12, No.2(2021) D [mm], L [mm], L/D. KL. 2250. 2200. Int. KL [mm2]. 400. 2100. Injection. 300 200 100 0 0. 1. 2. 3. 4. 5. 6. Time after start of injection [ms] g = 46.8 kg/m3. 2350. (b). Tg = 890 K. 2300. Tf [K]. 2250 2200. Int. KL [mm2]. 2150. For typical exhaust of current diesel engine consisting of NOx and soot. Flame temperature is a key parameter for reaction rate of combustion and formation mechanism of NOx. The direct photo is used to analyze by means of two-color method [12, 13] to obtain flame temperature and KL factor which corresponds to soot concentration contained in the optical path. The two-color method is an optical thermometry technique that makes use of the presence of soot within a flame. Fig. 10 shows the histories of flame temperature and integrated KL factor located at upper and lower part of each gas condition respectively. The gas density of 11.7 kg/m3 is shown in Fig. 10a while the 46.8 kg/m3 is shown in Fig. 10b. The flame temperautre Tf is the spatially averaged value inside the luminous flame area at instantenous time while the integrated KL factor is the summation of all KL values presence in the luminous flame. In Fig. 10a, it can be seen that the luminous flame starts right after 1 ms ASOI. This is just after the cylinder pressure suddenly rises up and ignition delay is detected at 0.75 ms ASOI for nozzle of D=0.180 mm (L/D=2.77), see Fig. 5a. The nozzle of D=0.180 mm (L/D=2.77) shows the. Flame temperature. 2300. Tg = 890 K. 2150. 4.4. Flame temperature and KL factor. D[mm], L[mm], L/D. 2350. g = 11.7 kg/m3. (a). 0.180, 0.5, 2.77 0.134, 0.5, 3.73 0.180, 0.8, 4.44 0.072, 0.5, 6.94. Tf [K]. turns to be weaker, see Fig. 4 at low gas density of 10-20 kg/m3. Fig. 9 reports NOx emission correlated with equivalence ratio of vapor fuel/air mixture in the near field . In general, the NOx decreases with increasing the equivalence ratio. On the other hand, the leaner mixture due to high entrainment enhances the combustion resulting in higher combustion temperature and larger amount of NOx is produced. For small orifice size nozzle of D=0.072 mm (L/D=6.94) and D=0.134 mm (L/D=3.73), the NOx emission linearly increases with decreasing the equivalence ratio. However, the D=0.134 mm (L/D=3.73) produces larger amount of NOx, as a result of higher rate of heat release and the higher expected flame temperature compared with nozzle of D=0.072 mm. Comparing between identical orifice size nozzle of D=0.180 mm, the shorter hole length nozzle produces higher amount of NOx. This is because from the previous spray study, the shorter hole length nozzle achieved the highest amount of entrained gas among four nozzle specifications, so that the combustion proceeded efficiently as discussed in subsection 4.2.. 400. 2100. Injection. 300. D [mm], L [mm], L/D. 0.180, 0.5, 2.77 0.134, 0.5, 3.73 0.180, 0.8, 4.44 0.072, 0.5, 6.94. 200 100 0 0. 1. 2. 3. 4. 5. 6. Time after start of injection [ms]. Fig. 10 Histories of flame temperature and integrated KL factor. Surrounding gas density: (a) 11.7 kg/m3 and (b) 46.8 kg/m3. fastest initial luminous flame which this result is consistent with the detected ignition delay shown in Fig. 6. At identical orifice size nozzle of D=0.180 mm, the shorter hole length nozzle exhibits slightly higher flame temperature compared with that of the longer one for whole flame duration. The peak of averaged flame temperature of 2255 K is indicated at the shorter hole length nozzle of D=0.180 mm (L/D=2.77) while the lowest one of 2200 K is found at the smallest orifice size nozzle of D=0.072 mm (L/D=6.94). One point is that the fashion of the flame Injector 30 mm. Flame temperature. KL Temp. K 2400. 0.180, 0.5, 2.77 2200. 0.134, 0.5, 3.73. 2000. KL 1.5. 0.180, 0.8, 4.44 0.75. 0.072, 0.5, 6.94. 0. 1.5. 2.5. 3.5. 4.5. 2.5 ms ASOI. 0.5. 1.0. 1.5. 2.5. 1.5 ms ASOI. Fig. 11 Temporal evolution of flame temperature and an instantaneous KL factor analyzed based on 2-color method. Surrounding gas density: (left) 11.7 kg/m3 and (right) 46.8 kg/m3.. Copyright 2020Society Society AutomotiveEngineers EngineersofofJapan, Japan, Inc. Inc. All All rights Copyright © 2021 of of Automotive rights reserved reserved. 67.
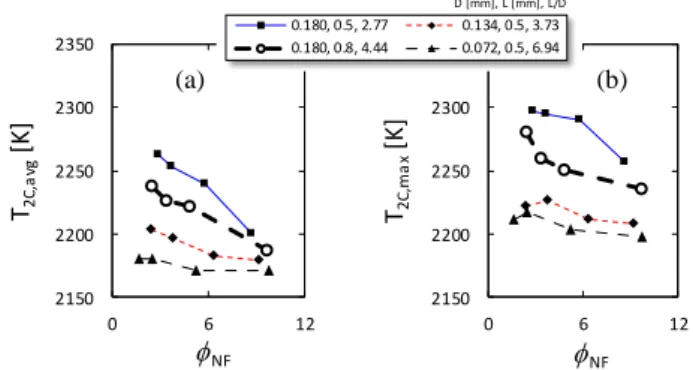
(7) Dittapoom Shinabuth et al / International Journal of Automotive Engineering Vol.12, No.2(2021) temperature is not the same as the rate of heat release curve that contains premixed combustion incidence without the radiation from soot particles. With integrated KL factor, it rises significantly from the beginning for the shorter hole length nozzle and reaches its peak at 3 ms ASOI. The unique feature for the longer hole length nozzle compared with that of the shorter one is that the flame temperature is lower with higher KL and the peak is shifted to later 3.9 ms ASOI. The marker for soot oxidation is a declined slope which is after 3 ms ASOI for the shorter hole length nozzle. The soot oxidation performs earlier with lower oxidation rate for the shorter hole length nozzle. However, the end of flame is almost similar at 6 ms ASOI. This would be the result of poor mixing given from the shorter hole length nozzle at low surrounding gas density condition which is unprofitable to the soot oxidation. Fig. 10b at 46.8 kg/m3, the flame temperature and integrated KL factor development are completely different from those presense at lower gas density of 11.7 kg/m3. This high gas density enhances the spray formation leading to stimulation of combustion. The fastest flame appearance is again found at the nozzle of D=0.180 mm (L/D=2.77). The flame duration is found to be longer for the longer hole length nozzle which ends at 3.5 ms ASOI while the shorter hole length nozzle ends at 3 ms ASOI. The integrated KL factor of the shorter hole length nozzle declines suddenly and the shorter flame duration compared with the longer one. From the. calculated flame tempeature and integrated KL factor, it can be used to support the discussion in previous subsection of measured soot emission. The reason of lower amount of soot produced by the shorter hole length nozzle of D=0.180 mm (L/D=2.77) is due to favorable mixture, higher flame temperature, shorter flame duration and soot oxidation performed intensively. This reason of higher flame temperature of the shorter hole length nozzle can express the NOx emission in the same manner. The spatial evolution of flame temperature and a single instantenous KL factor for different nozzle specifications and surrounding gas densities are tabulated in Fig. 11. In general, start of flame is fast at higher gas density of 46.8 kg/m3 and the flame temperature spatially varied between 2000-2400 K. Since the elevated gas density essentially promotes fuel/air mixing and accelerates reaction, flame duration is significantly shortened at gas density of 46.8 kg/m3 and flame area is confined which can be said that the combustion efficiently completed within a limited zone. This enhanced combustion under higher gas density obviously supports the discussion in measured soot emission. Comparing the idential orifice size nozzle of D=0.180 mm, the shorter hole length nozzle clearly reveals the start of flame faster prominently at gas density of 46.8 kg/m3. This can refer to the shorter ignition delay which is indicated to be the shorter hole length nozzle. Additionally, the high level of flame temperatuare and its distribution are an evidence that the efficient combustion is indicated to the shorter hole length nozzle. Although the lower injected fuel amount for the shorter hole length nozzle, the combustion is drastically promoted due to sufficient mixture with high dispersion and high entrainment. This information supports the result of cylinder pressure rising and reaching comparable level of peak pressure with the longer hole length nozzle at gas density of 46.8 kg/m3. Fig. 12a shows the averaged flame temperature analyzed based on two-color method T2C,avg that the spatially averaged flame temperature in an instantaneous time is again averaged over the flame period plotted against equivalence ratio of vapor fuel/air mixture in the near field while Fig. 12b shows its effect on the maximum flame temperature T2C,max. The equivalence ratio of vapor fuel/air mixture reveals a clear effect on flame temperature based on both averaged and maximum quantities. It is noted that the combustion is known to be taken place in the gas phase. Due to the relatively higher equivalence ratio of vapor fuel/air mixture with higher entrainment quantified at near-field region of the shorter hole length nozzle of D=0.180 mm (L/D=2.77) , it is found to be preferable to combustion. As a result, it shows the highest flame temperatures considered on both averaged and maximum quantities for whole range of equivalence ratio of vapor fuel/air mixture excepting uncertain tendency at high equivalence ratio of vapor fuel/air mixture rising above 8. Fig. 13 shows the variation of the flame temperatures with NOx emission. The relation is as expected that NOx emission increases with an increase in flame temperature. Based on both definitions of flame temperature, its tendency remains almost the same fashion excepting the flame temperature shifted to the higher temperature region for its relation based on maximum flame temperature. High temperature zones within the flame cause nitrogen molecules in the air to separate, allowing them to combine with oxygen, which leads to the formation of. D [mm], L [mm], L/D. 0.180, 0.5, 2.77 0.180, 0.8, 4.44. 2350. 0.134, 0.5, 3.73. 23500.072, 0.5, 6.94. (a). (b). T2C,ma x [K]. T2C,a vg [K]. 2300. 2250 2200. 2300. 2250 2200. 2150. 2150 0. 6. NF. 12. 0. 6. NF. 12. Fig. 12 Effect of equivalence ratio of vapor fuel/air mixture in the near field 𝜙 on averaged flame temperature T2C,avg and on maximum flame temperature T2C,max. The T2C is the flame temperature analyzed based on two-color method.. D [mm], L [mm], L/D. 0.12. 0.180, 0.5, 2.77. 0.134, 0.5, 3.73. 0.180, 0.8, 4.44. 0.120.072, 0.5, 6.94. (b). 0.08. mNOx / mf. mNOx / mf. (a). 0.04. 0.00 2150. 2250. 2350. T2C,a vg [K]. 0.08. 0.04. 0.00 2150. 2250. 2350. T2C,ma x [K]. Fig. 13 Relation between flame temperatures and measured NOx emission. (a) averaged flame temperature T2C,avg, and (b) maximum flame temperature T2C,max.. Copyright 2020Society Society AutomotiveEngineers EngineersofofJapan, Japan, Inc. Inc. All All rights Copyright © 2021 of of Automotive rights reserved reserved. 68.
(8) Dittapoom Shinabuth et al / International Journal of Automotive Engineering. NOx. The amount of thermal NOx formed actually depends largely on the temperature of the flame and residence time. It is found that the NOx emission is not only governed by the flame temperature but also the minor influences are observed such as size of reaction zone and flame duration.. 0.08. Calculated mNO / mf. 0.04. 4.5. Evaluation of NOx formation In diesel combustion, the nitric oxides NOx consists of NO and NO2 which is formed in the flame front and in the post-flame zone. Thermal NOx is the most dominant pathway which is formed when nitrogen and oxygen within the combustion gas at a relatively high temperature above 1800 K [14]. This study employs an extended Zeldovich mechanism [15] for thermal NO formation. The NOx and NO terms may be used interchangeably. In calculation, the chemical equilibrium approach of the system containing C, H, O and N atoms, other than NO, is used to obtain the equilibrium concentration of product gases at given mixture composition and the system temperature and pressure. For simplicity, it is reasonable to assume that the fuel/air mixture is perfectly mixed and ignition occurs at spray tip with ignoring the effect of either spray or flame wall impingement. Equivalence ratio presented in section 3 is the equivalence ratio of vapor fuel/air mixture that was considered in a limited area which is 20-mm near field from nozzle exit . At this time, we need to know that quantity when the spray penetrates farther downstream using the measured near-field spray characteristics such as liquid length, liquid and vapor cone angles until it reaches ignition time which is equal to the measured ignition delay. Since an averaged velocity decay of spray at centerline can be estimated using Musculus’s jet model [16], the spray penetration and spatially mixture distribution for each elapsed time can then be derived. Thus, once the ignition delay is known associated with near-field spray characteristics, the equivalence ratio of vapor fuel/air mixture at start of combustion can eventually be obtained at corresponding penetration. Fig. 14 shows the relation between and . It suggests that the mixture becomes drastically learner when the spray penetrates up to ignition time. The is used as the mixture composition just before the ignition for NO formation. The system temperature and pressure are the values. 0.06. 0. (b). D [mm], L [mm], L/D. 0.04. 0.180, 0.5, 2.77 0.134, 0.5, 3.73 0.180, 0.8, 4.44 0.072, 0.5, 6.94. 0.02. 0 0. 0.5. 1. 1.5. 2. Equivalence ratio of vapor fuel/air mixture,. SOC. Fig. 15 Effect of the equivalence ratio of vapor fuel/air mixture at start of combustion 𝜙 on NOx emission. (a) measurement and (b) calculation under assumption of averaged two-color flame temperature, T2C,avg. considered at TDC conditions. The NO formation is supposed to primarily confine in the flame and expand through the chamber volume. The averaged flame temperature analyzed based on 2color method is used to represent the burned gas temperature while the flame duration is assumed to be a residence time for NO formation. Fig. 15 shows the comparison between measured NOx and thermal NO calculated using the method described above plotted against the equivalence ratio of vapor fuel/air mixture at start of combustion . The relationship between the measured NOx emission and equivalence ratio of vapor fuel/air mixture under both schemes, those are at near field shown in Fig. 9 and at start of combustion shown in Fig. 15a exhibits similar fashion. It is found that an increase in equivalence ratio of vapor fuel/air mixture caused by poor atomization and lack of entrained gas resulting in lower flame temperature sequentially slowdown NOx formation. The calculated NO emission shows a significant relation with as shown in Fig. 15b. Although, several factors including spatial and temporal changes in flame. 2 D [mm], L [mm], L/D. 0.180, 0.5, 2.77 0.134, 0.5, 3.73 0.180, 0.8, 4.44 0.072, 0.5, 6.94. 1.5. Measured mNOx / mf. mixture, soc. Equivalence ratio of vapor fuel/air. 0.12. (a). Tg = 890 K. Measured mNOx / mf. Vol.12, No.2(2021). 1. 0.5. 0. 2. 4. 6. 8. 10. Tf = T2C,avg Tf = Tad 0.025 D [mm], L [mm], L/D. 0.180, 0.5, 2.77 0.134, 0.5, 3.73 0.180, 0.8, 4.44 0.072, 0.5, 6.94. 0.005 0.005. 0 12. Equivalence ratio of vapor fuel/air mixture, NF. Tf = T2C,max. 0.125. 0.025. 0.125. Calculated mNO / mf. Fig. 16 Comparison of NOx emission between measurement and calculation using different assumptions of flame temperature Tf.. Fig. 14 Relation between equivalence ratio of vapor fuel/air mixture determined at near-field region 𝜙 and at start of combustion 𝜙 .. Copyright 2020Society Society AutomotiveEngineers EngineersofofJapan, Japan, Inc. Inc. All All rights Copyright © 2021 of of Automotive rights reserved reserved. 69.
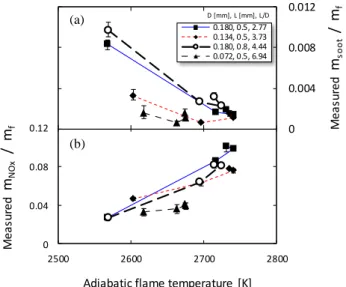
(9) Dittapoom Shinabuth et al / International Journal of Automotive Engineering Vol.12, No.2(2021). 0.180, 0.5, 2.77 0.134, 0.5, 3.73 0.180, 0.8, 4.44 0.072, 0.5, 6.94. 0.012 0.008. Measured mNOx / mf. 0.004 0.12. 0. somewhat higher than T2C, the corresponding NO emission obviously increases. The variations of flame temperature based on those assumptions are 2175-2300 K for T2C and 2550-2750 K for Tad which is approximately 412 K for an averaged difference. Under Tad assumption, the results are more linearly predicted compared with the measured data. Although both assumptions of flame temperature used for NO formation are not properly fitted to the measured data, it suggests that using Tad is an appropriate assumption which consequently provides better accuracy. Advantage of using Tad is due to its simple to obtain without any setup of high-speed imaging and two-color calibration devices. Fig. 17a shows relationship between adiabatic flame temperature Tad and measured soot emission. It can be seen that soot amount shows unclear correlation with adiabatic flame temperature especially for small orifice size nozzle of D=0.0720.134 mm. For small orifice size nozzle, the injected fuel amount is low and fuel/air mixture just before ignition is diluted by entrained gas. The soot emission is determined by the balance between the formation and oxidation of soot. Both formation and oxidation of soot are affected by temperature and oxygen concentration. Thus, the soot emission in exhaust is unreasonable to be expressed by only adiabatic flame temperature. Moreover, balance of formation and oxidation of soot may be changed when the orifice diameter of nozzle is reduced. For NOx emission shown in Fig. 17b, strong correlation is observed for all nozzle specifications as NOx proportionally increases with an increase in the flame temperature particularly for large orifice size nozzle of D=0.134-0.180 mm. However, a small nozzle orifice size of D=0.072 mm displays less sensitive to the flame temperature due to lack of fuel amount participating in combustion, sequentially resulting in small variation of flame temperature.. Measured ms oot / mf. D [mm], L [mm], L/D. (a). (b) 0.08. 0.04. 0 2500. 2600. 2700. 2800. Adiabatic flame temperature [K]. Fig. 17 Variation of adiabatic flame temperature with measured soot and NOx emissions. temperature and ambiguous identification of NO formation zone may cause discrepancies between measured and calculated NO emissions, the consistency between them can be observed. Fig. 16 shows comparison of NOx emission between measurement and calculation. The calculation is carried out based on three assumptions of flame temperature Tf which are the averaged two-color method flame temperature T2C,avg and the maximum one T2C,max, and the adiabatic flame temperature Tad. In this study, wide-range gas pressures of 3-12 MPa are prepared before fuel injection and combustion taking place. In such large variation of pressure, it needs to be taken into consideration as the combination of radicals occurs faster at high pressure combustion [18]. This can influence significant portion of energy from combustion and resulting in product temperature. The constant-pressure adiabatic flame temperature Tad is calculated by the method based on chemical equilibrium state where reactants and products have no further change with time. The equilibrium mole fractions of 10 combustion product gases such as CO2, CO, O2, O, NO, N2, H, H2, OH, and H2O at given initial temperature, pressure and fuel/air mixture are firstly computed using the equilibrium constants obtained from [19]. The initial temperature and pressure of the mixture are considered at the start of heat release which is essentially close to the TDC surrounding gas condition while the equivalence ratio of vapor fuel/air mixture at start of combustion is used as the initial fuel/air mixture. Based on the thermodynamic properties of air and combustion products obtained from [20], and those for diesel fuel obtained from [21], the flame temperature starts estimating from 2000 K and then iteratively updated until the enthalpy of the combustion products matches the enthalpy of the unburned mixture. With both T2C,avg and T2C,max assumptions, the results show significantly underestimated. The data set of D=0.1340.180 mm is displaced from that of D=0.072 mm. This is because two-color method flame temperatures of D=0.134-0.180 mm are suspected to be low which values are farther than that of the actual flame. An improvement is found when the NO formation is calculated based on Tad. The results are shifted to a slightly overestimated side. As it is expected that Tad is actually. 5. Conclusions The relation between spray characteristics in near-field region and combustion characteristics in diesel spray flame was investigated under wide range of operating ambient gas densities of 11.7-46.8 kg/m3. High-speed imaging was arranged together with soot and NOx emissions were measured. The relation between equivalence ratio of vapor fuel/air mixture quantified in near-field region and combustion characteristics was given. An estimated NO formation based on extended Zeldovich mechanism was also demonstrated and compared with the measured data. The main results of this work are listed below: 1. The premixed combustion phase was observed at low gas density of 11.7 kg/m3 and substantially suppressed by increasing gas density. At elevated surrounding gas density, entrainment of surrounding gas into a spray drastically increased, sequentially the richer vapor fuel/air mixture significantly helped improve combustion. 2. In near-field mixture behavior, with identical orifice size nozzle, the shorter hole length nozzle of D=0.180 mm (L=0.5 mm) provided the shorter liquid length, higher spray dispersion, higher entrainment and richer vapor fuel compared with the longer hole length nozzle of D=0.180 mm (L=0.8 mm). The near-field mixture behavior was found to continuously proceed up to upstream of ignition and throughout injection period as it was responsible for shorter. Copyright 2020Society Society AutomotiveEngineers EngineersofofJapan, Japan, Inc. Inc. All All rights Copyright © 2021 of of Automotive rights reserved reserved. 70.
(10) Dittapoom Shinabuth et al / International Journal of Automotive Engineering Vol.12, No.2(2021) ignition delay and combustion occurring more efficiently with higher flame temperature. 3. The lower amount of soot produced by the shorter hole length nozzle of D=0.180 mm (L=0.5 mm) compared with that of the longer one is due to the better mixture preparation, higher flame temperature and shorter flame duration. In addition, the oxidation of soot was intensively stimulated at late combustion phase. 4. NOx emission was found to decrease with equivalence ratio of vapor fuel/air mixture increased and relatively showed an inverse trend with soot emission. This was because the richer mixture caused by lack of entrainment of surrounding gas into a spray eventually resulted into weak reaction and lower flame temperature. 5. The measured NOx emission showed a strong function of adiabatic flame temperature. By increasing the adiabatic flame temperature, NOx progressively increased for large orifice size nozzles of D=0.134-0.180 mm, and gently increased for a small one of D=0.072 mm. In spite of that, the measured soot emission showed an unclear correlation to both equivalence ratio of vapor fuel/air mixture and adiabatic flame temperature. 6. The combustion and emission characteristics showed significant correlation with near-field spray behavior, particularly the influence of amount of fuel in vapor phase and entrainment of surrounding gas into the spray. The proper mixture preparation with high entrainment was declared to be a promising factor for efficient combustion with low soot emission at high boosted gas condition.. (8). (9). (10). (11). (12). (13). (14). References (1) Giménez, B., Tinaut, F., Melgar, A., and Payri, R., "Effects of the Operating Variables and Atomization Parameters on Diesel Spray Characteristics by means of a Transient Evaporative Spray Atomization Model," SAE Technical Paper 2004-01-2013, (2004). (2) M. Vijay Kumar, A. Veeresh babu, P. Ravi Kumar, and T. Manoj Kumar Dundi, "Influence of Different Nozzle Hole Orifice Diameter on Performance, Combustion and Emissions in a Diesel Engine," Australian Journal of Mechanical Engineering, Volume 17, (2019). (3) Baumgarten, "Mixture Formation in Internal Combustion Engines," Springer, (2006). (4) Seang-wock Lee, Daisuke Tanaka, Jin Kusaka, Yasuhira Daisho, "Effects of Diesel Fuel Characteristics on Spray and Combustion in a Diesel Engine," JSAE Review. Volume 23, Issue 4, Pages 407-414, (2002). (5) İsmetÇelıkten, "An Experimental Investigation of the Effect of the Injection Pressure on Engine Performance and Exhaust Emission in Indirect Injection Diesel Engines," Applied Thermal Engineering, Volume 23, Issue 16, Pages 2051-2060, (2003). (6) Kobori, S., Kamimoto, T., and Kosaka, H, "Ignition, Combustion and Emissions in a DI Diesel Engine Equipped with a Micro-Hole Nozzle," SAE Technical Paper 960321, (1996). (7) Sibendu Som, Anita I.Ramirez, Douglas E.Longman, Suresh K. Aggarwal, "Effect of Nozzle Orifice Geometry. (15). (16) (17). (18). (19). (20). (21). on Spray, Combustion, and Emission Characteristics under Diesel Engine Conditions," Volume 90, Issue 3, Pages 1267-1276, (2011). W. Zhang, K. Nishida, J. Gao, D. Miura, "An Experimental Study on Flat-Wall-Impinging Spray of Microhole Nozzles under Ultra-High Injection Pressures," Proc IMechE Part D: J Automob Eng, Pages 1731-1741, (2008). Khalid, A., Hayashi, K., Kidoguchi, Y., and Yatsufusa, T., "Effect of Air Entrainment and Oxygen Concentration on Endothermic and Heat Recovery Process of Diesel Ignition," SAE Technical Paper 2011-01-1834, (2011). Shinabuth, D., Nagasawa, T., Sato, S. and Kosaka, H., "Study on Effect of Nozzle Hole Length to Diameter Ratio on Near-Field Diesel Spray Characteristics at High Density Condition," International Journal of Automotive Engineering, Volume 11, Issue 4, Pages 159-168, (2020). Kobori, S. and Kamimoto, T., "Development of a Rapid Compression-Expansion Machine Simulating Diesel Combustion," SAE Technical Paper 952514, (1995). Takeyuki Kamimoto, Noboru Uchida, Tetsuya Aizawa, Katsufumi Kondo, Tatsuya Kuboyama, "Diesel Flame Imaging and Quantitative Analysis of In-Cylinder Soot Oxidation," IJER, Volume 18, Issue 5-6, Pages 422-435, (2016). Yukio Matsui, Takeyuki Kamimoto and Shin Matsuoka, "A Study on the Time and Space Resolved Measurement of Flame Temperature and Soot Concentration in a D.I. Diesel Engine by the Two-Color Method," SAE Transactions, Volume 88, Section 2: 790267–790526, Pages 1808-1822, (1979). S. C. Hill and L. Douglas Smoot, "Modeling of Nitrogen Oxides Formation and Destruction in Combustion Systems," Progress in Energy and Combustion Science, Volume 26, Issue 4-6, Pages 417-458, (2000). Y.B. Zel'dovich, "The Oxidation of Nitrogen in Combustion Explosions," Acta Physicochimica U.S.S.R. Volume 21, Pages 577–628, (1946). Musculus, M. and Kattke, K., "Entrainment Waves in Diesel Jets," SAE Int. J. Engines 2(1):1170-1193, (2009). Hesameddin Fatehi, Tommaso Lucchini, Gianluca D’Errico, Anders Karlsson, Xue-Song Bai and Öivind Andersson, "Effect of In-cylinder Flow Structures on Late Cycle Soot Oxidation in a Quiescent Heavy-duty Diesel Engine," Combustion Science and Technology, (2019). Sara McAllister; Jyh-Yuan Chen; A. Carlos FernandezPello, "Fundamentals of Combustion Processes," Chapter 2, Mechanical Engineering Series, Springer, Pages15-47, (2011). Olikara, C. and Borman, G., "A Computer Program for Calculating Properties of Equilibrium Combustion Products with Some Applications to I.C. Engines," SAE Technical Paper 750468, (1975). Gordon, S., and McBride, B. J., "Computer Program for Calculation of Complex Chemical Equilibrium Composition, Rocket Performance, Incident and Reflected Shocks, and Chapman-Jouguet Detonations," NASA SP-273, (1971). Ferguson, C.R., "Internal Combustion Engines", Wiley, (1986).. Copyright 2020Society Society AutomotiveEngineers EngineersofofJapan, Japan, Inc. Inc. All All rights Copyright © 2021 of of Automotive rights reserved reserved. 71.
(11)
図
+5

関連したドキュメント
External fixation pins of Ti-I 2 , pure titanium or stainless steel.. (diameter: 2 mm; length: 45 mm) were used
Focusing on the frontage, depth/frontage ratio, area, lots formed two groups; lots in former middle class warriors’ district and common foot warriors’ district, lots in
熱力学計算によれば、この地下水中において安定なのは FeSe 2 (cr)で、Se 濃度はこの固相の 溶解度である 10 -9 ~10 -8 mol dm
Furthermore, the upper semicontinuity of the global attractor for a singularly perturbed phase-field model is proved in [12] (see also [11] for a logarithmic nonlinearity) for two
Related to this, we examine the modular theory for positive projections from a von Neumann algebra onto a Jordan image of another von Neumann alge- bra, and use such projections
Then it follows immediately from a suitable version of “Hensel’s Lemma” [cf., e.g., the argument of [4], Lemma 2.1] that S may be obtained, as the notation suggests, as the m A
The advection-diffusion equation approximation to the dispersion in the pipe has generated a considera- bly more ill-posed inverse problem than the corre- sponding
Q discrep : Predefined empirical constant corresponding to the minimum value of the module of total discrepancy between estimated gas supply volumes, which is of practical
