学術論文 日本ヒートアイランド学会論文集 Vol.10 (2015) Journal of Heat Island Institute International Vol.10 (2015)
- 35 -
EFFECT OF WATER TEMPERATURE ON
EVAPORATION OF MIST SPRAYED FROM A NOZZLE
Craig FARNHAM*
1Masaki NAKAO*
1 Masatoshi NISHIOKA*
1Minako NABESHIMA
*
1Takeo MIZUNO*
2*1 Osaka City University, Dept. of Urban Engineering, Osaka, Japan
*2 H. Ikeuchi & Co., Ltd., Osaka, Japan
Corresponding author: Craig FARNHAM, [email protected] ABSTRACT
Water mist of average droplet diameter near 20μm can be used to create pedestrian “cool spots” or help improve cycle efficiency of outdoor air conditioner units. Pump waste heat, sunlight and other factors may cause the supply water temperature to become warm. The effect of water temperature over the range from 8°C to 92°C on mist mass flow rate, droplet diameter, mist evaporation rate and cooling effect were measured. The temperature of air in the mist cone was also measured. It was found that an increase of water temperature from 27°C to 60°C yields 7%
lower spray mass flow, 5% smaller Sauter mean diameter, and 6% faster evaporation. Temperatures inside the mist cone dropped below ambient within 20-40cm of the nozzle even when 92°C water is sprayed. Increasing temperature of mist spray supply water could have use to speed evaporation in tight spaces, as a heat sink, or as a legionella countermeasure.
Key Words : Mist, Evaporation, Cooling, Temperature, Droplet
1. INTRODUCTION
Evaporative mist cooling is increasingly being used in Japan to decrease outdoor air temperatures. Applications include creating “cool spots” for pedestrians, and reducing intake air temperatures of air conditioning outdoor units or gas turbines to boost cycle efficiency. Small water droplets will naturally reach the wet bulb temperature during evaporation as confirmed by Pruppacher and Klett(1) and cool the entrained air.
Generally, tap water is used for such cases. A difference between the mist water temperature and the air temperature will cause a transfer of sensible heat to the air. However, the latent heat transfer is typically much larger than the sensible heat. Yet if the supply water temperature is hot, the warming effect may be significant or the spray itself may be affected.
Hoffman et al.(2) examined the effect of water temperature of up to 20˚C higher than ambient air on fertilizer solution sprays with around 200μm average droplet diameter. They found either no significant change or a trend to slightly smaller average diameter in some cases. Moon et al.(3) examined the effect of temperature on the atomization in a fuel injector. They found that increasing the temperature of gasoline from 25˚C to 85˚C
yielded a decrease in Sauter mean diameter from 27μm to 20μm.
When water temperatures differ from the environment air, the effect on heat and mass transfer is likely to take place very close to the nozzle. Holterman(4) and Chaker et al.(5) performed detailed iterative calculations on mist droplet speed and droplet temperature respectively. As mist system droplets are very small, even relatively large mist droplets of 100μm diameter will decelerate to near zero relative velocity with air and cool to the wet bulb temperature within about 0.1 second of formation at the nozzle. This suggests that any warming effect from hot supply water would remain localized near the nozzle.
High pressure pumps used to drive misting systems can become warm when pumping for a long time. Piping and nozzle headers may be exposed to direct sunlight or waste heat. Mist spray flow rates can be quite low, such that the supply water speed inside the piping can be as low as 1cm/s for a single nozzle system. It is possible that the water can become quite warm before reaching the nozzles.
Further, it may be desired in some applications to deliberately pump hot water through the system, such as if it increases the speed of evaporation to reduce wetting of the cooling target, or is used as a legionella countermeasure. This
research examines the effect of increased water temperatures on a mist spray and its cooling effect.
2. THEORY
An increase in an evaporative mist cooling system water supply temperature above the ambient air temperature is expected to have two major effects;
- Loss of some of the net cooling due to sensible heat transfer from the warm water to the air.
- Change in the nature of the mist spray due to temperature-dependency of water properties
2.1 Thermal balance of evaporating mist as a whole The cooling effect of mist sprays comes from the latent heat of evaporation. As the mist droplets evaporate, they take heat from the surrounding air. Latent heat is exchanged for sensible heat. The amount of latent heat transferred, QL depends on the mass of mist evaporated, as shown in Eq. (1). However, some sensible heat, QS is exchanged with the air, depending on the initial droplet temperature, T0 and air temperature, TA as shown in Eq. (2). A water supply above the air temperature will transfer some sensible heat to the air. The heat capacity of water, CP is 4184J/kgK, while the latent heat of evaporation, L is about 2.45x10⁶J/kg. This means the sensible heat transfer from a mist with a water supply 30°C warmer than the air will cancel about 5% of the cooling effect of the mist mass evaporating.
𝑄L= 𝐿𝑚ev (1)
𝑄s= 𝐶P𝑚m(𝑇0− 𝑇A) (2)
2.2 Mist evaporation
Droplet evaporation rates depend on the air conditions. One form of a single droplet evaporation equation, Eq.(3) derived from Pruppacher and Klett(1) for use in typical air conditions calculates the change in radius, a over time as a function of the wet bulb depression, ΔTWB. The wet bulb depression is also useful as an index to compare the evaporative potential of various air conditions. It is the maximum possible temperature drop due to evaporative cooling. Further, if air conditions can be assumed as unchanging due to the evaporation, such as a single droplet in a relatively large parcel of air or a similarly fine mist, an integration of Eq. (3) to zero radius shows that droplet evaporation time, tev is directly proportional to the square of the radius, Eq. (4), or diameter. This fact is often termed the
“diameter-square law”.
𝑎 (𝑑𝑎
𝑑𝑡) ≈ − ∆𝑇WB𝑘A
𝐿𝜌w (3)
𝑡𝑒𝑣≈ ( 𝐿𝜌w
∆𝑇WB𝑘A) 𝑎2 (4)
These equations yield a rough estimate of the fastest time in
which mist droplets would evaporate. However, as mist evaporates the air cools, thus the wet bulb depression becomes smaller and evaporation slows.
2.3 Temperature dependent water properties
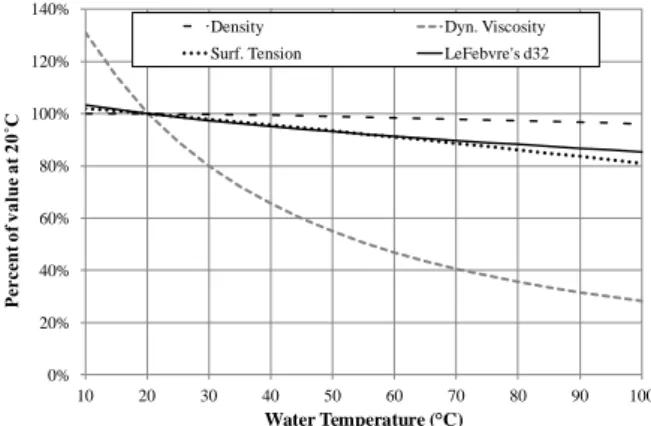
Water properties important to spray and evaporation processes are temperature dependent. Here, properties are calculated for ordinary water using the IAPWS95 formulations for density(6) and for surface tension(7). Dynamic viscosity is calculated using the approximation of Kestin et al.(8) Fig. 1 shows the change in water properties relative to their values at 20°C.
An example of the effect of water properties on droplet formation is the basic case of the dripping faucet, where the growing droplet reaches a diameter such that the surface tension is no longer sufficient to support the weight of the drop and it falls. This critical drop diameter D for a faucet with an orifice diameter of d0 is given by,
𝐷 = (6𝑑0𝜎 𝜌𝐿𝑔)
1 3⁄
(5) The change in physical properties due to an increase of water temperature from 20°C to 90°C would yield 5% smaller drops in such a case. This decrease in drop size is mainly due to the decreased surface tension.
In the process of atomization, the behavior of the liquid stream suddenly interacting with air at high speeds at the nozzle outlet is far more complex than the faucet case.
Fig. 1. Change in water properties and LeFebvre’s d32 equation as a function of temperature relative to their values at 20°C.
The nozzles used in this research are high-pressure swirl atomizers. For this type of nozzle, Lefebvre(9 ) proposed an empirical equation for Sauter mean diameter, d32 as a function of sprayed liquid density, surface tension, viscosity and other parameters, as shown in Eq. (6). Here, the atomization process is thought of as divided into 2 stages. The first stage is the generation of instabilities in the liquid sheet which forms at the nozzle outlet, and is accounted for in the first term of the
0%
20%
40%
60%
80%
100%
120%
140%
10 20 30 40 50 60 70 80 90 100
Percent of value at 20˚C
Water Temperature ( C)
Density Dyn. Viscosity
Surf. Tension LeFebvre's d32
- 37 - equation. The second stage is the conversion of the instabilities into ligaments which break up into droplets further away from the nozzle outlet, and is represented by the second term of the equation.
𝑑32= 4.52 ( 𝜎𝜇2 𝜌𝐴∆𝑃2)
0.25
(t cosθ)0.25+ 0.39 (𝜎𝜌𝐿
𝜌𝐴∆𝑃)0.25(t cosθ)0.75 (6) Lefebvre found that liquid density changes had a relatively small influence on d32 compared to viscosity and surface tension.(10) A plot of the relative change in d32 with the values at 20°C for the nozzle used here as the basis is included in Fig. 1.
As temperature increases from 20°C to 90°C, predicted d32
decreases by 13%, largely due to the change the first term.
2.4 Droplet evaporation and temperature change
A more detailed evaluation of mist droplet evaporation is needed to predict the droplet temperature change. This involves calculating the change in speed of the sprayed drops, their rates of heat and mass transfer with the air, and the resulting change in droplet size and temperature, through iteration.
The high-pressure swirl atomizing nozzles used here spray mist droplets from the nozzle orifice at initial speeds on the order of tens of meters per second. Surrounding air is entrained into the mist spray and the droplets transfer their momentum to it. The droplets decelerate rapidly due to air resistance and their relatively small mass.
The drag force Fd is expressed as a function of the drag coefficient Cd,
𝐹d= 𝐶d1
2𝜌A𝐴𝑣2 (7)
The mist droplets studied here are all under 100μm in diameter. The average droplet velocity as measured by a PDPA (Phased Doppler Particle Analyzer) at 2 cm from the nozzle outlet ranged from 10-15m/s. Attempts to measure velocity even closer to the nozzle were even more unreliable, due to the density of the mist. The Reynolds numbers of all droplets are less than 100. Lapple and Shepherd’s empirical relationship(11) for Cd is valid for Re<1000.
1 0125 072
24 .
d . Re
C Re (8)
Holterman(4) analyzed the deceleration of droplets in a horizontal spray. Initially droplets travel too fast to be treated as Stokes flow. As the drag force is higher than Stokes, the deceleration rate is initially faster than the Stokes flow case as calculated by an empirical relation. The drops slow to the Stokes flow regime and eventually reach a relative velocity of zero.
Holterman made iterative calculations for “relaxation time”, the time for a drop to lose 95% of its initial speed, and for “stopping distance”, the distance the drop travels until its horizontal motion stops in still air.
Holterman’s calculations showed that a 100μm diameter mist droplet with an initial horizontal speed of 10m/s would have a relaxation time of about 13ms with a stopping distance of about 120mm. Doubling the initial speed to 20m/s only increases stopping distance to about 200mm. A 20μm droplet has a relaxation time of 0.8ms and stopping distance of 8mm.
Continuing travel of the droplets is due to being carried along by the flow of air and the influence of gravity.
Chaker et al.(5) outlined a complete set of equations for calculating the evaporation and temperature change in water droplets in an evaluation of gas turbine inlet mist cooling systems.
The temperature change is determined by iteration, from the convection heat transfer with air and the loss of energy to the evaporated mass in each time step.
𝑇d(𝑡+∆𝑡)= 𝑇d(𝑡)+ ∆𝑡𝑆d
𝑚d𝐶P[ℎ𝑐(𝑇A− 𝑇d) − 𝐿𝑚̇d] (9) where the evaporating droplet mass flux ṁd is found by,
𝑚̇d= 𝑆ℎ𝑀𝐷f
𝑅𝐷d (𝑃v,d
𝑇d −𝑃v,a
𝑇a) (10)
and the convective heat transfer coefficient is found by, hc=ka
Dd[2 + 0.6 (ρa2g(Ta− Td)Dd3 μa2Ta )
0.25
( μa
ρaDf)0.33] (11) We calculate the evaporation rate and temperature change for an 80μm droplet sprayed horizontally with an initial velocity of 20m/s by following the procedures outlined by Chaker for mass flux and temperature, combined with those outlined by Holterman for droplet speed and distance. Water and air properties are calculated as temperature dependent. All interactions at the droplet surface are taken to be at the film temperature (average of droplet and surrounding air temperature). The droplet internal temperature is assumed to be uniform, which is reasonable as the Biot number is less than 0.2.
The iteration time step was 0.1ms. Smaller time steps yielded no significant change in the result. Results are shown in Fig. 2.
Here, the droplet temperature rapidly falls from the initial 92˚C to below the ambient air temperature within 35ms, no longer warming the surrounding air through sensible heat flux.
The deceleration is also rapid, with a relaxation time of 16ms, and a stopping distance of about 136mm. This example of a large, hot droplet was chosen as a “worst case” for use in mist evaporative cooling.
Cooler and smaller droplets in hot and dry air at 35˚C and 40%RH will have much faster reactions. A 40μm diameter drop will fall below ambient air temperature within 5ms with a stopping distance of 43mm.
Fig. 2 Temperature, velocity, diameter and distance traveled for a 80mm droplet with initial velocity of 20m/s and initial
temperature of 92˚C.
Thus, the effect of hot supply water on the speed of the single droplet evaporation process itself can be ignored for our purposes. Calculations and simulations of mist evaporation can be done with water properties set as constants.
However, the effect on the air temperature and net cooling cannot be ignored. Nor can we ignore the possibility that the temperature-dependency of the water properties has an influence on the process of droplet formation and initial droplet size.
The above calculations assume that ambient air temperature is constant. Calculating the change in air conditions and their effect to slow evaporation within a mist spray of millions of droplets is beyond the scope of a simple calculation. Modeling of air and mist through CFD (Computational Fluid Dynamics) can show if the rapid deceleration and cooling of hot mist droplets is maintained even inside a mist spray.
2.5 CFD model of mist spray
If a CFD model accurately represents reality, there is value in the software ability to output properties of the air and mist that would be difficult or impossible to measure in reality; such as droplet size distributions at any and all points in the mist, droplet temperatures, and air temperatures inside the mist.
A 3D model of the mist spray in a 400cm x 45cm x 45cm duct was made using Ansys® FLUENT 13.0 to help confirm the effects of supply water temperature on evaporation and cooling.
3. APPARATUS AND PROCEDURES
The nozzles used to produce the mist are hollow-cone, high-pressure swirl atomizers made by H. Ikeuchi Co., Ltd.
(Model# KBN80031). A high pressure water pump supplies tap water at 5.5MPa, which yields a nozzle flow rate of 2.1L/hr.
3.1 Measurement of droplet diameters
The droplet diameter distribution was measured with a PDPA (Phased Doppler Particle Analyzer) made by Artium
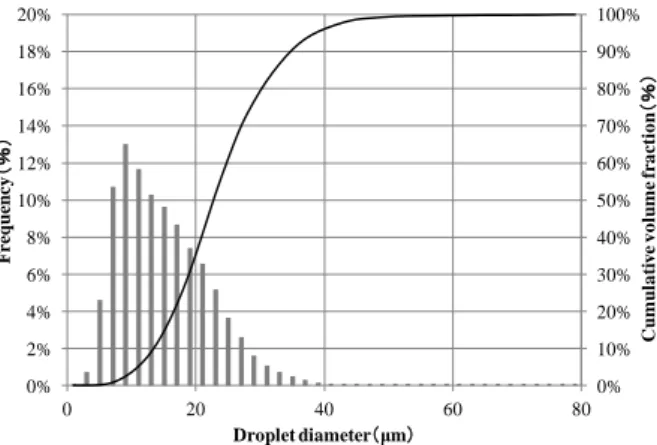
Technologies Inc. (Model# PDI-200), which uses interference patterns in intersecting laser beams to sense droplet diameter and speed without affecting the spray. The baseline droplet diameter distribution for the nozzle used in these experiments is the average of 8 measurements taken 10cm from the nozzle along the centerline. Each measurement collected data on 10,000 droplets to form a distribution. The supply water temperature was 27°C. The average Sauter mean diameter, d32 was 21μm.
The diameter distribution is shown in Fig. 4, grouping the droplets into bins of 2μm each, such that the mean diameters are 1μm, 3μm, 5μm and so on. The cumulative volume fraction is also shown.
To find the effect of water temperature, diameter measurements were taken with the PDPA at 10cm from the nozzle as the water temperature was slowly cycled from room temperature to 92°C and back to room temperature again.
Measurements of 10,000 droplets were taken about every 2 degrees. This process was repeated, taking diameter measurements at 30cm from the nozzle.
3.2 Control of water supply temperature
Nozzle supply water was heated inside the nozzle header, immediately before reaching the nozzle. A 400W electric wire heater of 1900mm length with automatic temperature controller, made by Nippon Heater Co., Ltd. (Model# MC2-104-05) was wrapped around the U-shaped header pipe with the nozzle fitting at one end. Flexible metal hose connected this header to the high-pressure water pump. The hose length was 10m. Part of the hose was coiled and immersed in a bucket of room temperature water to counter any heating of the water by the pump. This setup is shown in Fig. 3.
Fig. 3. Mist water temperature control and PDPA setup
Nozzle water spray temperature was measured in 2 ways.
First, a T-type thermocouple was mounted on the nozzle header surface 5cm upstream of the nozzle and wrapped in 2 layers of 1cm-thick pipe insulation of 15cm length. Second, a T-type thermocouple was embedded in sponge and placed into the mouth of a bottle which fit closely over the nozzle. The bottle and sponge interior almost instantly reach a saturation state, such
0 20 40 60 80 100
0 30 60 90 120 150
0 20 40 60 80 100
Droplet temperature (˚C) Velocity relative to air (m/s) Droplet diameter (μm) Distance traveled (mm)
Elapsed time from droplet formation (ms) Diameter Distance traveled Temperature Rel. velocity Ambient Temperature
- 39 - that there is no evaporation, and thus no evaporative cooling of the spray water. Repeated trials confirmed that the sponge temperature and the pipe surface temperature were within 1°C when the water temperature was steady.
Fig. 4. Droplet diameter distribution and cumulative volume fraction measured at 10cm from nozzle. Average of 8 measurements with supply water at 27°C.
3.3 Measurement of mass flow rate
Nozzle flow rate was measured as mass flow. A plastic bottle with a sponge near the opening fits around the nozzle. The sponge is slightly separated from the nozzle tip, allowing droplet formation, but almost no evaporation. The bottle is weighed before and after a set period and the flow rate calculated. The electric heater was set to various temperatures. When the sensor at the nozzle header reached a steady state, the flow rate was measured by collecting mist for 2, 3 or 4 minutes.
To show that the change in flow rate is due to the water temperature only, a second nozzle of the same model was added upstream of the electric heater and header, separated by 5m of hose. The second nozzle is downstream of the room temperature water bath of the flexible high-pressure hose coming from the pump (see Fig. 5), to eliminate temperature increases due to pump warming. Flow rates from the second, cool nozzle, and the original warmed nozzle were taken simultaneously over temperatures ranging from 22°C to 90°C. The nozzles were then exchanged and the procedure repeated.
3.4 Measurement of mist evaporation rate and cooling Evaporation rate and evaporative cooling measurements were done in a forced-draft air duct shown in Fig. 6. The duct cross-section is 45cm x 45cm. An air blower is connected by flexible ducting at the duct outlet such that the suction drives air through the duct. Combined with damper control, the average air speed in the duct can be set at 2 - 3m/s. At the end of the duct is an air filter made by Japan Vilene Co., Ltd. (Model# Viledon VG-40-56F). The filter particle size capture rate will trap
approximately 99% of the particle distribution from the nozzles used here.
Fig. 5 Setup for simultaneous spray of warm mist and room temperature mist for measurement of difference in mass flow rate.
Fig. 6. Diagram of duct evaporation measurement apparatus and sensors.
A single nozzle was placed on the duct centerline from 0.5m - 2m from the measurement filter, spraying towards it for 2 minute periods. The filter is weighed before and after spraying to find the weight of mist captured, and thus the evaporation rate as a ratio with the total amount of mist sprayed as in Eq. (12). The amount of mist sprayed is taken as a function of the supply water temperature for the nozzles used, given in Eq. (14), as discussed in the results Section 4.1.
T m Y mm filter
1Δ
(12)
Two temperature and humidity sensors are located just upwind of the nozzle, their average is used as the inlet air condition.
A grid of 25 uncoated T-type thermocouples with solder beads under 1mm was mounted behind the filter for 3 cases.
They were arranged in an evenly spaced 5x5 grid across the 45cm x 45cm outlet. Readings were recorded every 2 seconds and the average of all thermocouple data was taken for 30 seconds before misting, and 15 seconds at the middle of the 2-minute misting period. The difference between the initial and the middle average was taken as the net cooling effect. However, there is a possibility that some sensors may have become wet, as the filter does not perfectly capture all droplets.
Evaporation rates were measured for 7 different cases of distance from nozzle to filter, z and inlet air temperature and
0%
10%
20%
30%
40%
50%
60%
70%
80%
90%
100%
0%
2%
4%
6%
8%
10%
12%
14%
16%
18%
20%
0 20 40 60 80
Cumulative volume fraction(%)
Frequency(%)
Droplet diameter(μm)
humidity. All cases had the duct air speed at 3m/s. In each case, the water temperature was varied from the room temperature to about 60°C, and 4 to 7 trials were done. Experiment conditions are listed in Table 1.
Table 1. Evaporation test conditions
Case z(m) Temp(°C) R. Hum(%) ΔTWB(K)
A 1.25 23 38 8.6
B 0.75 19 45 6.7
C 0.5 20 69 3.7
D 1.0 19 64 4.2
E 2.0 18 68 3.6
F 1.5 7 48 2.9
G 2.0 5 56 3.2
3.5 Direct measurement of temperature in mist cone A set of 6 uncoated T-type thermocouples with solder beads less than 1mm diameter were spaced at 3cm intervals in a row and placed along the nozzle spray centerline, starting 1.5cm from the nozzle. The water temperature was raised from 27°C to 92°C and temperatures of the wet thermocouples recorded at 2 second intervals and the 30-second time average was used. The set was then moved closer, to 5mm from the nozzle, and the procedure repeated.
3.6 CFD model settings
The model has 1cm tetrahedral mesh near the nozzle, ranging up to 4cm mesh at the duct inlet and outlet, yielding a total of 1.2 million elements, shown in cross-section in Fig. 7.
The model was run on a Windows7® based 64-bit PC with a quad-core Intel® Xeon processor and 12GB of RAM. A steady-state calculation converged to a solution in 4 hours.
Fig. 7 CFD model mesh of duct
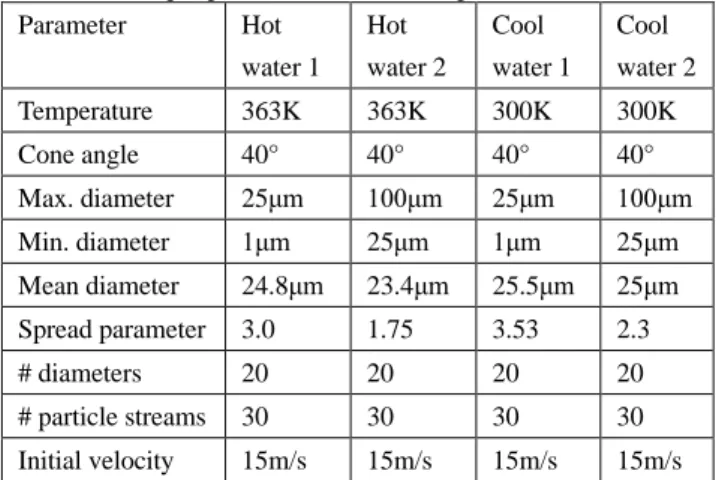
An injection point representing the nozzle used in the experiments was set along the centerline of the duct, spraying along its length. Two simulations were done to evaluate the effect of the water temperature change. The nozzle flow rate was not changed (though the mass flow rate was later found to be affected by water temperature, see Fig. 8). The droplet diameter distributions were changed to a best-fit with the PDPA droplet diameter distribution measurement results discussed in Section 4.2 and shown in Fig. 10. Fluent can generate a Rosin-Rammler distribution, but such distributions defined by a single median and standard deviation tend to not match real mist droplet distributions very well.(12) To make a more realistic distribution,
two distributions were combined, one for smaller diameters, and the other for the larger diameters. Input parameters for the “Set Injection Properties” window in FLUENT are given in Table 2.
Table 2 CFD input parameters for mist droplet distributions
Parameter Hot
water 1 Hot water 2
Cool water 1
Cool water 2
Temperature 363K 363K 300K 300K
Cone angle 40° 40° 40° 40°
Max. diameter 25μm 100μm 25μm 100μm
Min. diameter 1μm 25μm 1μm 25μm
Mean diameter 24.8μm 23.4μm 25.5μm 25μm
Spread parameter 3.0 1.75 3.53 2.3
# diameters 20 20 20 20
# particle streams 30 30 30 30
Initial velocity 15m/s 15m/s 15m/s 15m/s Change in the droplet evaporation processes due to water temperature effects in FLUENT was handled by defining the saturation vapor pressure and binary diffusivity of the air-water interface as linear interpolations from manually-input tables rather than their default constant values. The binary diffusivity equation(13) used to build a table was,
P P T . T
D
. v
0 94 1
0
105
211
0 (13)
with units of m2/s, where the reference temperature T0 is 273.15K and P0 is standard atmospheric pressure. The pressure term was assumed as unity for this case. A saturation vapor pressure table was built from the approximation used in HASP/ACSS/8502 air conditioning simulator.(14)
Water density, thermal conductivity and latent heat of evaporation were set constant at their values for 27°C.
Duct air speed was set at 0.3m/s to allow for a steady flow that can yield convergence in the steady-state calculation, yet not differ significantly from the air speed arising from a mist spray in open air. Droplet drag was set to be handled as spheres.
Effects of gravity were included, yielding a mist cone that bends downward. The air flow was handled as turbulent with the realizable k-ε model in FLUENT.
The only difference between the two simulations input parameters was water temperature; one with the spray water source at room temperature (27˚C) and one with the spray water source at high temperature (92˚C). The mass flow rate was not adjusted (in experiment, mass flow dropped with higher temperature) to avoid confounding the results. The duct inlet air was set at 27˚C and 75% humidity, which was the ambient in the experiments to measure temperature inside the mist.
The simulation was repeated for air conditions more favorable to evaporation which might be encountered as a “best case”, a very hot, dry summer mid-day for Japan, 35˚C and 30%
- 41 - humidity, in which a mist cooling system would likely be used.
The droplet distributions were kept the same as above. The unheated droplet temperature was set at 35˚C (ambient).
Abbreviation labels used in the rest of this report for the above cases are given in Table 3. Here “C” is cool, “H” is hot, “a”
is air and “w” is water. Thus the first case “CaCw” is “Cool air, Cool water” and so on. The wet bulb depression ΔTWB is also given, which is the maximum possible temperature drop due to mist evaporative cooling.
Table 3. CFD mist-in-duct model conditions Case
Inlet air conditions
Water temp.
(°C) Temp
(°C)
R.Hum (%)
ΔTWB
(K)
CaCw 27 75 3.4 27
CaHw 27 75 3.4 92
HaCw 35 30 13.4 35
HaHw 35 30 13.4 92
4. RESULTS
Raising the mist supply water temperature had an effect in all aspects considered in these experiments.
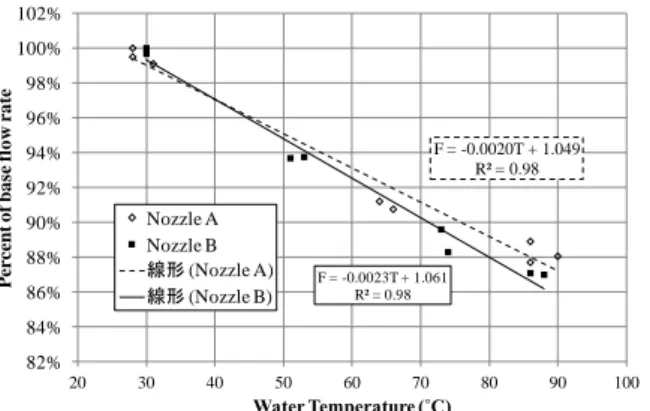
4.1 Effect of water temperature effect on mass flow rate The nozzle mass flow rates decreased with higher temperatures. Simple linear curve fits have high R2 values of 0.98 for each nozzle. The slope of the best fits are 0.20% and 0.23% mass flow decrease per °C increase for Nozzle A and B respectively. A supply water temperature of 60°C will yield about a 7% smaller mass flow rate from this nozzle than a typical summer tap water temperature of 27°C. The flow rate data are shown in Fig. 8.
Fig. 8. Effect of water temperature on mass flow rate from the nozzle.
The best-fit curve for all data, which has a R2 of 0.97, is
T m
. . T
mm 0105400021 (14)
Where m0 is the base mist mass flow rate at 27°C and T is in degrees C. This is used to calculate the sprayed mass flow rate
during the duct evaporation trials over the range of temperatures.
4.2 Effect of water temperature on droplet diameter There was a trend to smaller d32 at higher temperatures as shown in Fig. 9. The best fit trend line has a R2 value of about 0.11, with an average decrease of 10% from 20°C to 90°C, similar to the trend predicted by Lefebvre. There is a similar decrease, with a stronger correlation (R2=0.30) for the simple (arithmetic) diameter, d10. Both trends are shown in Fig. 9. A plot of the droplet diameter distributions for low temperature water (average of 9 measurements at 20-30°C) and high temperature water (average of 11 measurements at 75-90°C) is shown in Fig. 10. The hot water tends to have a higher fraction of droplets under 15μm, which is about the arithmetic average diameter, while the cooler water has more of the larger droplets.
This trend is similar to that found by Moon et al. (3) with gasoline at similar temperatures.
Fig. 9. Effect of temperature on average droplet diameters d10
and d32
Fig. 10 Averaged droplet diameter distributions for low and high temperature water
An increase of water temperature from 28 to 60°C will yield an average 5% drop in d32 for these nozzles. Because droplet evaporation time is proportional to the square of the diameter, a 5% smaller droplet will have nearly a 10% faster evaporation time, as (95%)2 = 90.25%.
However, these smaller measured diameters themselves may
F = -0.0020T + 1.049 R² = 0.98
F = -0.0023T + 1.061 R² = 0.98
82%
84%
86%
88%
90%
92%
94%
96%
98%
100%
102%
20 30 40 50 60 70 80 90 100
Percent of base flow rate
Water Temperature (˚C) Nozzle A
Nozzle B 線形(Nozzle A) 線形(Nozzle B)
d32= 22.9 - 0.0324T R² = 0.11
d10= 15.4 - 0.0328T R² = 0.30
10 12 14 16 18 20 22 24 26
10 20 30 40 50 60 70 80 90 100
Mean diamter (μm)
Water Temperature ( C)
●d32 +d10
0%
2%
4%
6%
8%
10%
12%
14%
16%
0 10 20 30 40 50 60
Frequency (%)
Droplet diameter(μm)
20-30degC 75-90degC
in part be the result of faster evaporation. As the droplets traveled from the orifice to the measurement point 10cm away, the higher air temperature in the mist (see below) resulting from sensible heat transfer from the hot droplets may have increased evaporation speeds during transit.
4.3 Effect of water temperature on evaporation and cooling
The evaporation rates as measured by mist collecting at the measurement filter increased with higher water temperatures.
This includes considering the lower mass flow rates due to increased temperature as noted above. Among the data there are 11 pairs in which the duct conditions were the same and the water temperature was similar (within 2 degrees). The average difference between measured evaporation rates among these pairs was 2.4%, which can be taken as an indication of the measurement error.
There were 7 sets of evaporation rate measurements. Among these, there were 3 measurements of the cooling effect with the 5x5 thermocouple grid, results are shown in Table 4. In 6 of 7 cases there was a clear trend to increased evaporation. The slopes of the 7 trend lines as determined by least-squares regression are used to calculate the expected change in evaporation rate when increasing the water supply temperature from 20°C to 60°C.
The average of all cases is a 7.3% increase in evaporation rate when increasing water supply temperature from 20°C to 60°C.
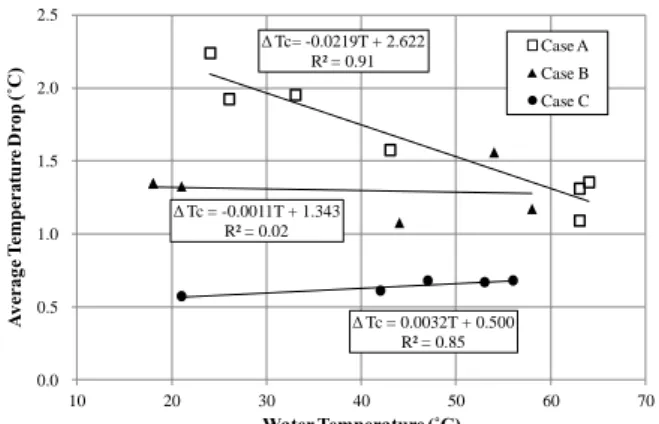
Using the same trendline analysis as above for the average cooling measured by the thermocouple grid behind the filter, there was an average loss of 0.26K of cooling when increasing the water supply temperature from 20°C to 60°C. A plot of the change in measured cooling (Fig. 12) shows that cooling was significantly affected in only one case, which was also the case with the highest evaporation rate and longest distance from nozzle to filter among the three.
Table 4. Effects of water temperature on evaporation rate and cooling
Case
Evaporation trend for 20°C
to 60°C
Avg.
Evap. Rate (%)
Cooling change for 20°C to 60°C
A -2.1% 82 -0.88 K
B +5.8% 63 -0.04 K
C +10.2% 37 +0.13 K
D +8.6% 50
No data
E +6.6% 95
F +12.9% 49
G +8.9% 50
Avg +7.3% -0.26 K
Further experiments are needed to determine if there is wetting of some sensors, which would affect these averaged
results. Also, the duct is far too short to allow for complete evaporation with these nozzles. At duct lengths where the mist can completely evaporate, there should be little effect on the net cooling, due to the relatively small amount of sensible heat compared to the latent heat of evaporation.
Fig. 11 Plot of results for evaporation rates in a duct as a function of the supply water temperature.
Fig. 12. Plot of average temperature drop measured by the thermocouple grid as a function of supply water temperature.
4.4 Temperature inside the mist cone
The temperature measured inside the spray in the very dense sprayed mist near the nozzle drops to near-ambient air temperature within only 20mm of the nozzle as shown in the plot of results for case CaHw and CaCw in Fig. 13. Even with the supply water temperature at 92°C inside the nozzle, the measured temperature (plotted with X) only reached 47°C at 5mm from the nozzle. The temperature was less than 1 degree above the initial ambient within 20mm of the nozzle. Measured temperatures when supply water was near ambient (plotted as +) were all below the air temperature and within 15mm fell to about the wet bulb temperature of the initial air condition.
In the CFD simulation runs, virtual sensors were set along the axis of the spray direction at the 1cm, 5cm, 10cm, 20cm and 50cm from the outlet. Unlike the experiment, the air temperature and the temperature of the mist droplets can be evaluated separately. The results are included Fig. 13, with air temperature (triangles) and droplet temperature (circles) for the case of hot
0%
10%
20%
30%
40%
50%
60%
70%
80%
90%
100%
0 10 20 30 40 50 60 70
Evaporation rate (%)
Water Temperature (˚C)
Case A Case B Case C Case D
Case E Case F Case G
Δ Tc= -0.0219T + 2.622 R² = 0.91
Δ Tc = -0.0011T + 1.343 R² = 0.02
Δ Tc = 0.0032T + 0.500 R² = 0.85 0.0
0.5 1.0 1.5 2.0 2.5
10 20 30 40 50 60 70
Average Temperature Drop (˚C)
Water Temperature (˚C)
Case A Case B Case C
- 43 - supply water (red filled) and ambient supply water temperature (not filled).
In case CaHw, the measured temperatures all fall between the air and droplet temperatures as predicted by the CFD simulation. It is likely the sensors were measuring a combination of the air temperature and the water which adhered to the sensors. In case CaCw, the CFD simulation predicts a quick drop to the wet bulb temperature, while the measured temperatures were about 0.5K higher.
Profiles of air temperature results from the CFD model along a section of the middle of the duct and mist cone for cool water and hot water are shown in Fig. 14 for Case CaCw and CaHw. For CaCw, air temperature quickly drops to the wet bulb temperature (the darker shade of blue). For CaHw, there is a region of air temperature slightly higher than ambient, extending to about 40cm from the nozzle. Beyond 50cm the temperature starts to drop below ambient. The temperature drops below ambient sooner at the edges of the mist cone.
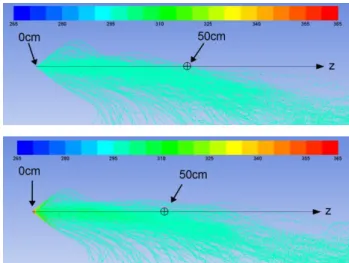
A plot of pathlines of droplets for Case CaCw and CaHw is shown in Fig. 15, with the droplet temperature indicated by the color. Beyond the immediate region of the nozzle there is little difference in droplet temperature.
Yet these are “worst cases” with relatively cool, damp air and a water supply temperature at 92°C. Mist evaporative cooling would likely not be used. In a “best case” where misting would be used in Japan, the temperature profiles for cases HaCw and HaHw are given in Fig. 16. Here the case of cool water yields temperature drops approaching the wet bulb temperature as expected. The case of hot water shows no region of air temperature increasing above ambient, the temperature drop is about 1-2K smaller than for cold water in the region plotted and approaches the wet bulb temperature about 1m from the nozzle.
Fig. 13 Temperature inside mist at centerline for Case CaCw and Case CaHw.
A pedestrian in an evaporative mist cool spot would likely not know that hot water is being sprayed unless they touch the nozzles or headers. If hot water is used, installing nozzles and
headers such that they can be directly touched could be a safety hazard to operators and curious pedestrians.
Fig. 14 CFD results. Profile of air temperature for Case CaCw (top) and Case CaHw (bottom). Note: Temperatures given in Kelvin.
Fig. 15. CFD results. Profile of water droplet temperature along pathlines for Case CaCw (top) and Case CaHw (bottom). Note:
Temperatures given in Kelvin.
Fig. 16. CFD results. Profile of air temperature for Case HaCw (top) and Case HaHw (bottom). Note: Temperatures given in Kelvin.
20 25 30 35 40 45 50 55 60 65 70
0 5 10 15 20
Temperature (˚C)
Distance from nozzle along centerline (mm) CFD, CAHW air CFD, CACW air CFD, CAHW drops CFD, CACW drops Experiment, CAHW Experiment, CACW Initial Air Temp Initial Wet Bulb Temp
5. DISCUSSION AND CONCLUSIONS
Increased supply water temperatures for mist spraying with this nozzle lead to:
- Smaller mass flow rates - Smaller mean droplet diameter - Faster evaporation
- Possible increase in temperature close to the nozzle - Slight reductions in net cooling
Increasing water temperature may be a useful measure to increase evaporation rates of mist sprays. This may be useful as a measure to reduce wetting in tight spaces, such as applications to air conditioning units or in inlet air cooling for gas turbines, possibly reducing scaling. Further, there seems to be little reduction in cooling effect nor danger of scalding from the spray even at near-boiling supply water temperatures. However, precautions to prevent people touching the hot nozzles and headers themselves would be needed. Further, the effect of long term spraying of hot water on the nozzles themselves (perhaps degrading components or adhesives in the structure, or reducing lifespan) was not examined here.
Mist water supply lines could be used as a heat sink for some other relatively small waste heat source in the area of application, on the order of 5-10% of the net cooling effect, such as using the mist supply water to cool the high pressure water pump. The equivalent amount of sensible air cooling from evaporation would be lost, but if a waste heat source could be used to heat the mist supply water to 60°C, it could have the added value of keeping the spray clear of bacteria. Spraying at 60°C for long periods during operation as a preventative measure against legionella would have little adverse affect on cooling.
Further research is needed to confirm temperature trends over a range of conditions and with other nozzles. The effect of spraying hot water on the lifespan of these nozzles will require long-duration testing. Also, the effect of spraying hot water from multiple nozzles together in the same space will be investigated.
NOMENCLATURE
Symbol Meaning Units
a droplet diameter μm
cp specific heat at constant pressure J/kg・K
d32 Sauter mean diameter μm
kA thermal conductivity of air W/m・K L latent heat of evaporation J/kg mev mass of evaporating mist spray kg/s
ΔP pressure loss at orifice Pa
QL latent heat transfered W
Qs sensible heat transfered W
t spray sheet thickness m
tev droplet evaporation time s
TA temperature of air °C
T0 initial temperature of supply water °C
Y mist evaporation rate -
z distance from nozzle to filter m
μ dynamic viscosity N・s/m2
ρA density of air kg/m3
ρw density of water kg/m3
θ spray angle °
σ surface tension of water in air N/m
References
(1) H. Pruppacher and J. Klett: Microphysics of Clouds and Precipitation. Kluwer Academic Publishers. (1997), pp.
490.
(2) W. Hoffman, B. Fritz, W. Bagley and Y. Lan: J. ASTM Int’l., 8-4(2011), PaperID JAI103461.
(3) S. Moon, E. Abo-Serie and J. Choi: Atomization and Sprays. 8-17 (2007), pp.529-550.
(4) H. Holterman: Kinetics and evaporation of water drops in air. IMAG, Report 2003-12/Wageningen UR.
(2003)Wageningen, The Netherlands.
(5) M. Chaker, C. Meher-Homji and T. Mee III: Inlet Fogging of Gas Turbine Engines – Part A, Proc. Of ASME Turbo Expo, Amsterdam, (2002) Report #2002-GT-30562.
(6) W. Wagner and A. Pruss: J. Phys. Chem. Ref. Data, 31-2 (2002), pp.387-534.
(7) IAWPS: “IAPWS Release on Surface Tension of Ordinary Water Substance”, http://www.iapws.org/relguide/surf.pdf, (1994).
(8) J. Kestin, M. Sokolov and W. Wakeham: J. Phys. Chem.
Ref. Data, 7-3 (1978), pp.941-948.
(9) Lefebvre, Atomization and Sprays. Hemisphere Publishing, (1989) pp. 220.
(10) Lefebvre, Ibid, pp. 220.
(11) K. Asano: Butsuri Idou no Kiso to Ouyou (Fundamentals and Applications of Transport Physics) Maruzen (2004), [in Japanese].
(12) R. Mugele and H.Evans: Industrial and Engineering Chemistry, 43-6 (1951), pp.1317-1324.
(13) Pruppacher. Ibid, pp.505.
(14) Japan Building Mechanical and Electrical Engineers Association, HASP/ACSS/8502 Manual, (1986), [in Japanese].
(Received Oct 30, 2012, Accepted Dec 20, 2012)