Journal of Thermal Science and Technology
1. Introduction
The cooling process of circulating water in the NDWCTs is an extremely important process, which is achieved by the contact heat dissipation and evaporation heat dissipation in the NDWCT. For the NDWCTs, the water loss of cooling tower mainly includes evaporation loss, windage loss and blowdown loss. Evaporation loss makes up most of the water loss at thermal power plants. For this reason, the study on the prediction of evaporation loss in the NDWCTs lay a theoretical foundation for the thermal power plant to decrease the emission and save water.
In the power industry, water is often used as a heat transfer medium to dissipate heat, and in many areas, water has become a scarce resource. How to take measures to reduce or recover water consumption of thermal power plants, many scholars have paid attention to this issue, and achieved remarkable results (Yuan et al., 2019; Bustamante et al., 2016; Wei et al., 2018; Saidi et al., 2010). The application of the direct air-cooled technology in power plants is a key measure to achieve water conservation. Factors such as wind direction, fan performance and blade installation angle have a great influence on the cooling capacity of a direct air-cooled system (Yang et al., 2011; Zhang et al., 2019a, 2019b; Zhang et al,. 2018a, 2018b). However, the direct air-cooled systems account for a small part of the cooling towers. Most cooling methods in thermal power plants are wet cooling.
Several mathematical models for predicting evaporation loss had been established in the mechanical wet cooling towers. Kairouani constructed a mathematical model for the numerical prediction of the performance of cross flow cooling towers and used this model to predict the thermal behavior of six cooling towers located in the South of Tunisia. It was found that the actual water losses by evaporation represent 4% of the total water flow rate, which corresponds to 106 m3
per year (Kairouani et al., 2004). Based on ASHRAE’s rule of thumb Qureshi set an empirical formula, and it could accurately predict the evaporation loss of cooling tower (Qureshi et al., 2006; Qureshi et al., 2007).
Effect of change factors on evaporation loss based on cold end
system in natural draft counter-flow wet cooling towers
Wei YUAN*, Fengzhong SUN*, Ruqing LIU*, Xuehong CHEN* and Ying LI*
*School of Energy and Power Engineering, Shandong University17923 Jingshi road, Jinan 250061, China E-mail: [email protected]
Received: 12 June 2020; Revised: 25 October 2020; Accepted: 9 December 2020 Abstract
The water loss caused by evaporation heat dissipation is non-negligible for a natural draft counter-flow wet cooling tower (NDWCT), which is evidently influenced by many change factors. Based on Merkel method, the Merkel number is revised in consideration of the effect of water loss. Taking the NDWCTs equipped for 300MW and 600MW power plants as experimental objects, a mathematical model is established for predicting the evaporation loss of the NDWCT. The accuracy of the model is verified by experimental data, and the mathematical model for predicting evaporation loss is feasible. Then, the effect of change factors, including mass flow rate of circulating water and air parameters, on the tower evaporation loss is studied in the case of fixed the thermal load dissipated by the condenser. Results show that the evaporation loss varies little with the change of mass flow rate of circulating water. Therefore, Water conservation cannot be achieved by changing mass flow rate. With the increase of dry bulb temperature, the evaporation loss, as well as the rate of evaporation loss caused by unit temperature drop increases. As the relative air humidity increases, the NDWCT outlet water temperature increases, whereas the evaporation loss and the rate of evaporation loss caused by unit temperature difference decrease.
Keywords : Natural draft counter-flow wet cooling towers, Mathematical method, Evaporation loss, Circulating
2 © 2021 The Japan Society of Mechanical Engineers [DOI: 10.1299/jtst.2021jtst0015]
Many researchers studied the thermal performance of cooling tower by establishing mathematical models (Hajidavalloo et al., 2010). In 1925, Merkel proposed the cooling towers thermal evaluation theory, and this model had been widely used (Merkel et al., 1925; Reuter et al,. 2012; Naik et al., 2017). Similar to simplified assumptions as Merkel method, the effectiveness- number of transfer unit (e-NTU) method for studying the thermal performance cooling towers was developed (Jaber et al., 1989; Stabat et al., 2004). Three mathematical models of the Merkel, e-NTU, and Poppe methods were compared and analyzed in detail (Kloppers et al., 2005).
At present, the research on the prediction of evaporation loss mainly focuses on the mechanical wet cooling towers. There are rare studies on evaporation loss in the NDWCTs. In this study, based on the widely used Merkel method, the Merkel number was modified in consideration of the effect of water loss. A mathematical model for predicting the evaporation loss of the NDWCT was established. Then, MATLAB software was used to compile the solution program of the mathematical model. The accuracy of the mathematical model was verified by comparing the calculated results with the experimental data. Based on this, the effect of change factors on evaporation loss based on cold end system was studied in the NDWCT.
2. Mathematical model
At present, widely used mathematical models for predicting evaporation loss include Merkel method, Poppe method, empirical equation and e -NTU Methods in the wet cooling towers. In this study, the Marker method was chosen for predicting evaporation water loss. Two assumptions were adopted: the change of mass flow rate of circulating water is not taken into account, and the Lewis factor is equal to 1 (Stabat et al., 2004; Kloppers et al., 2005). In this study, the Merkel method was modified to meet the research requirements in consideration of the effects of water loss.
Heat and mass transfer in the NDWCT was a very complex process. To simplify the calculation, several important assumptions were set.
Radiation heat transfer from air to water was negligible.
The conditions of water and air vary only with the vertical position in the tower. Heat and mass transfer through the tower wall to the environment was negligible. Windage and blowdown loss were negligible.
Temperatures of water and air at any cross-sections were uniform.
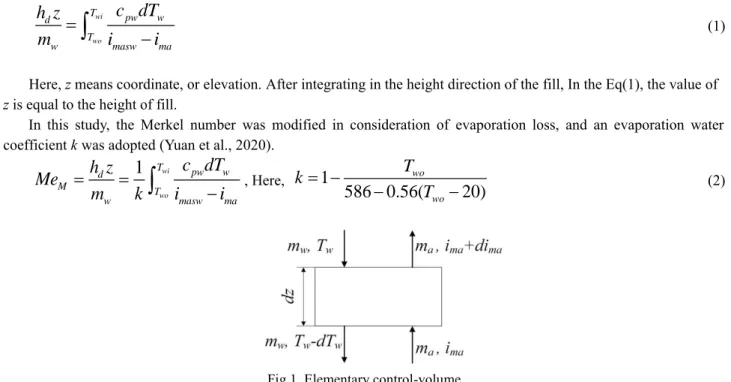
On the basis of mass and energy balance of the control volume as shown in Fig 1, Equation (1) was obtained.
wi wo T pw w d T w masw mac dT
h z
m
i
i
(1)Here, z means coordinate, or elevation. After integrating in the height direction of the fill, In the Eq(1), the value of
z is equal to the height of fill.
In this study, the Merkel number was modified in consideration of evaporation loss, and an evaporation water coefficient k was adopted (Yuan et al., 2020).
1
wi wo T pw w d M T w masw mac dT
h z
Me
m
k
i
i
, Here,
1
586 0.56(
20)
wo woT
k
T
(2)Fig 1. Elementary control-volume
Here, hd is mass transfer coefficient, mw and ma are the mass flow rate of circulating water and air respectively, Tw is
the temperature of circulating water, Twi and Two are inlet water temperature and outlet water temperature of NDWCT,
respectively, imasw is saturated enthalpy value of air with the temperature of Tw.
The airflow sucked into the NDWCT was determined by the suction force which was generated by the density difference of the air. The resistance of the airflow was equal to the draft force due to the density difference.
The draft equation:
(
)
22
am t inlet ai ao amv
H
H
g
(3)Where Pdraft
HtHinlet
g(
ai
ao) is represents the draft force,2 2 am res am v
P is represents the resistance of the air flowing.
The ventilation capacity of the NDWCT ma was shown as follow
2
(
)
t inlet ai ao a f am amg H
H
m
A
(4)Where Af is cross sectional area of filler, ρam is the mean air density ρam = (ρai + ρao)/2, ρai and ρao are the inlet air
density and outlet air density, ξ is total drag coefficient of the tower.
The calculation formula of water loss caused by evaporation heat dissipation in the NDWCT was below.
(
)
evap a o i
m
m w
w
(5)Where mevap is evaporation loss of NDWCT, wi is inlet mass-fraction humidity of air stream, wo is outlet mass-fraction humidity of air stream.
Selected the same fillers as the test tower for physical modelling experiment, and the fitting formula of Merkel number and gas-water ratio was got.
'
n MMe C (6)
Where λ is the gas-water ratio, C and n are test constants which were acquired from experimental test of the fill in the simulation test tower. The values of C and n were shown in Table. 1, respectively.
Table 1 Values of C and n at different capacity units. Capacity 300MW 600MW
C 1.69 2.19
n 0.54 0.65
For predicting evaporation loss of NDWCT, MATLAB software was used to compile the solution program of the mathematical model. Through iterative calculation to obtain the tower water temperature Two, the tower airflow mass ma and outlet air moisture content wo, and then obtain the evaporation loss. The program block diagram for solving this
2 © 2021 The Japan Society of Mechanical Engineers [DOI: 10.1299/jtst.2021jtst0015]
Fig. 2 The flowchart of the evaporation loss in NDWCT.
3. Experimental verification
The NDWCTs in the 300MW and 600MW coal-fired units were selected as the research objects to verify the accuracy of mathematical model. Table 2 showed the geometric dimensions of the NDWCTs. The experiment was carried out on the NDWCTs of China in summer. The atmospheric pressure, ambient dry and wet bulb temperature were measured by a small-type meteorological station, which was installed 40 meters away from the NDWCT and 3 meters above the ground level. The temperature sensors were used to measure the water temperature, and the water temperature of the central shaft in the NDWCT was measured as the inlet tower water temperature, the water surface temperature in the collecting basin as the outlet water temperature. Table 3 showed the testing instruments.
The outlet water temperature of NDWCT Two was calculated and tested under 5 different working conditions
respectively. Different working conditions of 300MW and 600MW coal-fired unit were shown in Table 4, Table 5. Table 2 Geometric dimensions of the NDWCTs
Capacity 300MW 600MW
Geometric dimensions
Tower height(m) 123.4 150.6
Tower inlet height(m) 8.3 9.8
Distance between sprinkling device and
tower outlet(m) 113.5 137.6
Air inlet diameter(m) 84.7 115.7
outlet diameter(m) 52.5 72.0
Area of water spray filler(m2) 5500.0 9000.0 Filler
characteristics Fitting formula of fillers
' 0.54 1.69 M Me ' 0.65 2.19 M Me 4
Table 3 Testing instruments
Item Testing instrument Accuracy
Atmospheric pressure Small-type meterological station ±1.5% Inlet dry and wet bulb temperature Small-type meterological station ±0.1℃ Inlet and outlet tower water temperature Platinum resistance thermometer ±0.1℃ Mass flow rate of circulating water FLEXIM ultrasonic flowmeter ±0.5%
Table 4 Five different working conditions of 300MW unit
Working conditions
Meteorological parameter
Mass flow rate of circulating water (t/h) Inlet tower water temperature (℃) Atmospheric pressure (kPa) Dry bulb temperature (℃) Wet bulb temperature (℃) 1 99.6 26.5 19.9 38286 38.2 2 100.1 31.1 26.4 38286 41.4 3 100.8 26.7 21.0 22746 41.7 4 100.1 30.9 26.6 38286 41.1 5 100.4 28.6 23.6 38286 38.8
Table 5 Five different working conditions of 600MW unit
Working conditions
Meteorological parameter Mass flow rate of circulating water (t/h) Inlet tower water temperature (℃) Atmospheric pressure (kPa) Dry bulb temperature (℃) Wet bulb temperature (℃) 1 100.4 31.98 27.90 74272 41.34 2 101.1 27.52 25.40 74272 38.06 3 101.1 28.16 25.40 74272 38.49 4 101.1 27.59 24.21 74272 37.02 5 101.1 28.32 23.67 74272 38.36
2 © 2021 The Japan Society of Mechanical Engineers [DOI: 10.1299/jtst.2021jtst0015]
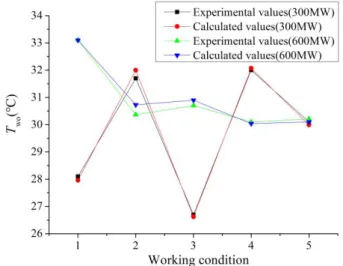
Fig. 3 Experimental and calculated values of Two at 5 working conditions.
Figure 3 shows the experimental and calculated values of Two at various working conditions. Through the comparative
study and analysis of the calculated and experimental values of 300 MW and 600MW units, it can be found that the calculated values of Two were not far from the experimental value. Both calculated and experimental values of 300 MW
and 600MW units at different conditions had a relative error of less than 3%. Therefore, it could be considered that the mathematical calculation model of evaporation loss of the NDWCT established in this study was accurate, and the program for predicting evaporation loss was feasible.
4. Effect of mass flow rates on evaporation loss
The main factors that affected the cold end system included mass flow rate of water, air-dry bulb temperature and relative air humidity. In the actual operation of the cold end system in a thermal power plant, the cooling performance of the NDWCT and the heat transfer performance of the condenser affected and restricted with each other. In order to comprehensively analyze and evaluate the evaporation loss of NDWCTs, the influence of circulating water mass flow rate and meteorological parameters on evaporation loss in the NDWCT was studied with a fixed thermal load released by the cold end system. In fact, when the mass flow rate of circulating water and environmental air parameters changed, the exhaust pressure of the steam turbine would change, resulted in the change of steam turbine unit efficiency. Finally, the heat transfer load of the condenser changed. Therefore, to obtain the actual variation of evaporation loss, the mathematical calculation model of evaporation loss should be solved jointly with the steam turbine variable working condition model and the condenser heat transfer model. In order to simplify the calculation, this paper assumed that the heat transfer load in the cold end system did not change. The difference between inlet and outlet water temperature can be regarded as the temperature rise of the cooling water in the condenser.
The working condition 4 was selected as the study subject: Atmospheric pressure of 100.1 kPa, air-dry bulb temperature of 30.9℃, wet bulb temperature of 26.6℃, circulating water of 38286 t/h, the difference between inlet and outlet water temperature of 9.03℃. Besides, the heat transfer load in the condenser was assumed to remain unchanged. Compared with working condition 4, only the mass flow rate of the circulating water changed. The circulating water of 38286t/h was considered as 100% of the total circulating water. Figure 4 showed the change of inlet and outlet water temperature at various mass flow rates. From the analysis of the cold end system, assumed that the heat transfer load in the condenser did not change, when the mass flow rate of circulating water decreased, the inlet water temperature of circulating water increased, and the outlet water temperature slightly reduced. That is to say, the change of the inlet water temperature had little effect on the outlet water temperature.
As shown in Fig. 5, the change of evaporation loss was not large along with the decrease of mass flow rate, and the evaporation loss reduced slightly, but the reduction was very small. For per 1% reduction in the mass flow rate, evaporation loss only reduced by about 0.065t/h correspondingly. In general, evaporation loss did not change significantly with the decrease of the mass flow rate.
Fig. 4 Outlet water temperature at various mass flow rates
Fig. 5 Evaporation loss at various mass flow rates.
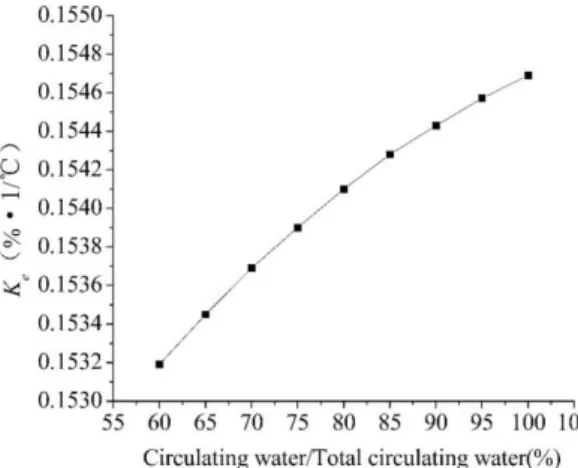
In order to evaluate the evaporation loss of NDWCT comprehensively, except for evaluating the total evaporation loss, the relative variation index of evaporation loss should be taken into account. This paper defines a physical parameter
Ke, which represented the ratio of evaporation loss to total circulating water at per 1 ℃ temperature drop. Figure 6 showed
the relationship between Ke and mass flow rate. The evaporation loss rate caused by a unit temperature difference Ke
increased gradually with the increase of the mass flow rates.
Fig. 6 Relationship between Ke and the mass flow rates of circulating water.
5. Effect of air parameters on evaporation loss
5.1 Air-dry bulb temperature
Based on the basic calculation condition 4, only the air-dry bulb temperature changed. As shown in Fig. 7, with the increase of the dry bulb temperature, the inlet water temperature and outlet water temperature increased proportionally, but the difference between them remains unchanged. As the ambient dry bulb temperature increased, the evaporation loss of the NDWCT increased, as shown in Fig. 8. When the air-dry bulb temperature rose per 1℃, the inlet water temperature and outlet water temperature increased about 0.7℃ correspondingly, and evaporation loss increased about 4.58 t/h. As can be seen from Fig. 9, Ke increased ambient dry bulb temperature.
2 © 2021 The Japan Society of Mechanical Engineers [DOI: 10.1299/jtst.2021jtst0015]
Fig. 7 Inlet and outlet water temperature at various air-dry bulb temperature
Fig. 8 Evaporation loss at various air-dry bulb temperature
Fig. 9 Relationship between Ke and air-dry bulb temperature
5.2 Relative air humidity
Compared with the reference working condition 4, only the relative air humidity was changed, as shown in Fig. 10, 11, the inlet water temperature and outlet water temperature also increased proportionally with the increase of the relative air humidity. Evaporation loss decreased with the increase of the relative air humidity. For per 1% increase in relative air humidity, the water temperature of inlet and outlet towers increased by about 0.09 °C, and the evaporation loss reduced by about 0.925 t/h. Figure 12 showed the relationship between Ke and relative air humidity. Ke decreased with the rise of
relative air humidity.
Fig. 10. Inlet and outlet water temperature at various relative air humidity
Fig. 11. Evaporation loss at various relative air humidity
Fig. 12 Relationship between Ke and relative air humidity
6. Conclusions
In this study, a mathematical model for predicting the evaporation loss of the NDWCT was established. Taking a 300MW power plant as the study object, the accuracy of the mathematical model was verified, and the mathematical model for predicting evaporation loss was feasible. Then, based on the cold end system, evaporation loss in the NDWCT was predicted at various circulating water rates and air parameters. The following conclusions were obtained:
(1) When the heat transfer load in the cold end system remains constant, evaporation loss does not change significantly with the change of the inlet tower water rate. Water conservation cannot be achieved by taking measures to change the mass flow rate of circulating water in the conventional cold end system.
(2) As dry bulb temperature increases, inlet water temperature increased and Evaporation loss increased, as well as the rate of evaporation loss caused by a unit temperature difference increased in the case of fixed the thermal load dissipated by the condenser.
(3) When the relative air humidity increases, the inlet water temperature increases, while the evaporation loss and the rate of evaporation loss caused by a unit temperature difference decreases.
Nomenclature
Af -cross sectional area of filler (m2) Subscripts
cp - specific heat at constant pressure (J/kg℃) a - air
C, n –constants i - inlet
g - gravitational acceleration (m/s2) M - Modification
hd - mass-transfer coefficient (kg/m3s) m - mean, or mass transfer
Hinlet - tower inlet height (m) o - outlet
i - enthalpy (J/kg) s - saturation
Me - Merkel number w - water
m - mass flow rate (kg/s)
NDWCT - natural draft counter-flow wet cooling tower
T - temperature (℃)
w - mass-fraction humidity of air stream, kg of water/kg of
dry-air (kg/kg)
Greek Letters
2 © 2021 The Japan Society of Mechanical Engineers [DOI: 10.1299/jtst.2021jtst0015]
λ - air-water ratio
ξ - total drag coefficient of tower
References
Bustamante, J. G., Rattner, A. S. and Garimella, S., Achieving near-water-cooled power plant performance with air-cooled condensers, Applied Thermal Engineering, Vol. 102, (2016), pp. 362-371.
Hajidavalloo, E., Shakeri, R. and Mehrabian, M. A., Thermal performance of cross flow cooling towers in variable wet bulb temperature, Energy Conversion and Management, Vol. 51, No. 6(2010), pp. 1298-1303.
Jaber, H. and Webb, R. L., Design of cooling towers by the effectiveness-NTU method, Journal of Heat Transfer, Vol. 111, No. 4 (1989), pp. 837-843.
Kairouani, L., Hassairi, M. and Tarek, Z., Performance of cooling tower in south of Tunisia, Building and environment, Vol. 39, No. 3 (2004), pp. 351-355.
Kloppers, J. C. and Kröger, D. G., Cooling tower performance evaluation: Merkel, Poppe, and e-NTU methods of analysis, Journal of Engineering for Gas Turbines and Power, Vol. 127, No. 1 (2005), pp. 1-7.
Merkel, F., Verdunstungskühlung V D I. Forchungsarbeiten, Heat and Mass Transfer Handbook, (1925), pp. 1-48. Naik, B. K., and Muthukumar, P., A novel approach for performance assessment of mechanical draft wet cooling towers,
Applied Thermal Engineering, Vol. 121, (2017), pp. 14-26.
Qureshi, B. A. and Zubair, S. M., Prediction of evaporation losses in wet cooling towers, Heat transfer engineering, Vol 27, No. 9 (2006), pp. 86-92.
Qureshi, B. A. and Zubair, S. M., Prediction of evaporation losses in evaporative fluid coolers, Applied thermal engineering, Vol. 27, No. 2 (2007), pp. 520-527.
Reuter, H. C. R. and Kröger, D. G., Computational models for predicting cooling tower fill performance in cross-counterflow configuration, Journal of Thermal Science and Engineering Applications, Vol. 4, No.2 (2012). Saidi, M. H., Aghanajafi, C. and Mohammadian, M., Analysis of dehumidification effects on cooling capacity of an
evaporative cooler, Journal of Thermal Science and Technology, Vol. 5, No. 1 (2010), pp. 151-164.
Stabat, P., and Marchio, D., Simplified model for indirect-contact evaporative cooling-tower behaviour, Appl Energ, Vol. 78, No. 4 (2004), pp. 433-451.
Yang, L. J., Du, X. Z.and Yang, Y. P., Influences of wind-break wall configurations upon flow and heat transfer characteristics of air-cooled condensers in a power plant, International Journal of Thermal Sciences, Vol. 50, No. 10 (2011), pp. 2050-2061.
Yuan, W., Sun, F. and Zhao, Y., Numerical study on the impact mechanism of windshield devices on frozen phenomena in a direct air-cooled system. International Journal of Heat and Mass Transfer, Vol.142, (2019), pp. 118206. Yuan, W., Sun, F., Chen, X and Liu, R., Effect of Thermal Load on Evaporation Loss of Natural Draft Counter-Flow Wet
Cooling Towers, Journal of Thermal Science and Engineering Applications, Vol. 12, No.5 (2020).
Zhang, L., Zheng, Z., Zhang, Q. and Wang, S., Simulation of entropy generation during the evolution of rotating stall in a two-stage variable-pitch axial fan, Advances in mechanical engineering, Vol, 11, No. 5 (2019a), pp. 1-12.
Zhang, L., He, R., Wang, X., Zhang, Q. and Wang, S., Study on static and dynamic characteristics of an axial fan with abnormal blade under rotating stall conditions, Energy, Vol. 170, (2019b), pp. 305-325.
Zhang, L., Zhang, L., Zhang, Q., Jiang, K., Tie, Y., and Wang, S., Effects of the second-stage of rotor with single abnormal blade angle on rotating stall of a two-stage variable pitch axial fan, Energies, Vol. 11, No12(2018a), pp. 3293. Zhang, L., and Engeda, A., Numerical simulation of rotating stall in a two-stage axial fan, Thermal Science, Vol 22, No.
S2(2018b), pp. S655-S663.
Zijie, W., Fusheng, P., Xiaoping, M. and Wei, L., Experimental and Theoretical Study of an Underground Non-Typical Cooling Tower, Journal of Chemical Engineering of Japan, Vol. 51, No. 3(2018), pp. 243-252.