EFFECT OF SOIL PROFILE STRUCTURE ON SEASONAL CHANGES OF SOIL TEMPERATURE
IN URBAN FORESTS
Seiya MIYAJIMA, Hayato MATSUDAIRA and Makiko WATANABE
Abstract Field observations of soil temperature were carried out in an urban park to compare the characteristics of heat transfer in urban forest soils having different soil profile structures. The diurnal variation of soil temperature was significant down to 10 cm depth. Their patterns in the layers deeper than 30 cm differed by seasons and soil profile structures having contrasted soil properties. Temperature transmission to deeper layers was faster in the soil profile having stronger soil compaction and abundant artifacts than in the soil profile with weaker soil compaction and no artifacts.
From February to April, the soil temperature was higher in the undisturbed profile, having lower soil pH (acidic), lower compaction, smaller bulk density, and larger carbon content, than in the lithological disturbed profile containing a large amount of concrete rubbles with higher soil pH (neutral to weak alkaline), higher compaction, larger bulk density, and smaller carbon content. The reverse trend appeared from mid-April to December. Moreover, the annual range of soil temperature was larger and occurred deeper in the lithological disturbed profile than in the undisturbed profile. Thermal diffusivity and thermal conductivity were 0.9–7.9 × 10⁻³ cm2 s−1 and 0.20–1.85 Wm-1K-1 for the lithological disturbed profile, respectively. The values were smaller, 0.3–5.3 ×10⁻³ cm2 s−1 and 0.02–0.45 Wm-1K-1, respectively for the undisturbed profile. Based on our two years observation, we conclude that the intensive soil compaction and lithological discontinuity regulate soil thermal properties of urban forests, by which soils may likely to be assigned to a higher soil temperature regime.
Key words: urban forest soils, lithological disturbance, soil compaction, thermal properties 1. Introduction
Soil temperature in urban areas has been highlighted in relation with urban heat island effect.
Turkoglu (2010) conducted analysis of urbanization on soil temperature in Ankara, Turkey based on the data collected over 40 years (1960–2005) at two meteorology stations. The mean monthly urban soil temperature was revealed generally higher than the rural soil temperature, with differences ranged between 1.8–2.1 °C. Shi et al. (2012) reported the observation results from the two model profiles in Nanjing, China and found that urban soil was 1.21°C warmer than rural soil.
Savva et al. (2010) carried out an 8-years observation of soil temperature in 10-cm depth at urban and rural forest and grassland site in Baltimore, USA and revealed that the average annual soil temperature was higher in urban than rural sites by 1.5 °C under turf grass and by 0.4 °C under
GEOGRAPHICAL REPORTS
OF TOKYO METROPOLITAN UNIVERSITY 52 (2017) 11–22
forest. Edmondson et al. (2016) carried out 11 months observation of surface soil temperature at approximately 1.5 cm soil depth in Leicester, UK and revealed the moderation of the urban heat island effects by trees and shrubs.
Urban soils are structurally modified and develop compaction and lithological discontinuity with the presence of anthropogenic materials and other contaminants (Craul 1985). Although the characteristics of urban soils are difficult to estimate from current landscapes, such as topography and vegetation, the vertical soil hardness represents the process of soil formation under intensive anthropogenic land use and land creation (Uoi et al. 2014). Artifacts, modifiers, and compaction may alter the soil moisture capacity and capillarity, with consequent effects on soil surface temperature and heat transmission. Several field studies have investigated the impact of track compaction on the thermal conductivity of farmland soil (Usowicz et al. 2006; Kossowski and Usowicz 1995; Lipiec et al. 2007). The findings from these studies also can be applied to anthropogenic soils in urban areas. Although, the impact of human activities on thermal properties of urban soils may differ from farmland soils because they have miscellaneous disturbance such as mixing, compaction, filling, scraping, and artifact contamination. Miyajima et al. (2015) carried out field observations in several green areas of Tokyo Metropolis and examined the difference between the characteristics of heat transfer in the soils having the same turf coverage but different profile modifications.
Fig. 1 (a) Location of the Gyoen and (b) the observation sites MJY and Gate.
(b) (a)
Tokyo Metropolis
(b)
Fig. 2 Photos of the observation sites. (a) Vegetation of the MJY site, (b) Observation station of MJY site, (c) Installation of the equipment at MJY site, (d) Vegetation of the Gate site, (e) Observation station of Gate site, (f) Installation of the equipment at Gate site
Soil temperature regimes are used in defining classes at various categorical levels in the taxonomy on basis of soil temperature at a depth of 50 cm from the soil surface or at a lithic or paralithic contact, whichever is shallower (Soil Survey Staff 1999), because of soil temperature is a major concern for the growth environment of plant, soil respiration, and the formation or translocation of inorganic compounds as well. Studies by Sakuma (1987) and Sakuma and Kobayashi (1987) examined soil temperature regime in deciduous forests in Hokkaido and discussed the water and heat balance. Murata et al. (2012) reported the soil temperature of the Institute of Nature Studies, the green park located in Minato-ku, Tokyo, as 15–16°C that could be categorized to the boundary of mesic and thermic regimes. Genchi et al. (1998) observed the soil temperatures of the asphalt sealed soils at depth of 50cm in Tokyo, from 1996 to 1997, and obtained 21°C as mean annual soil temperature.
In this study, we measured the temperature (°C) and moisture (m3 m−3) in soil profiles of urban forest to 50 cm depth for two years to provide basic information of soil temperature regimes for urban forest in Tokyo Metropolis and to make clearer how soil heat transmission is affected by modified lithological structure, such as compaction and addition of anthropogenic materials.
2. Material and Methods
Urban forest sites in the Shinjuku Gyoen
The effect of soil profile structure on the soil temperature of urban forest was examined in the Sinjuku Gyoen National Garden (from further on the Gyoen), a historical large-scale green space in Tokyo Metropolis (35°41'06"N, 139°42'36"E, 30 m above sea level). The Gyoen had been constructed on the site of a private mansion belonging to Lord Naito in the late 16th century. In 1906, it became an imperial garden and was used as a field during the World War II. In 1945,
(d)
(a) (b)
(e)
(c)
(f)
most of the buildings in the Gyoen were destroyed by the Great Tokyo Air Raids. The 58.3 ha area of the Gyoen was re-designated as a national garden and opened to the public in 1949. The representative soil type in the Gyoen is Pachic Melanudands; Melanic Silandic Andosols (Tokyo Metropolitan Government 1998).
Observation of soil temperature and soil moisture
Two observation sites were set in the forest areas of the Gyoen, namely the MJY (Momijiyama) and the Gate (Service Gate) as shown in Fig 1. The aim of the observation was to compare the heat transfer properties between two soil profiles with different lithological structures in each area. The MJY site has been kept as a secondary forest since Meiji era (late 18th century), currently composed of Japanese maple and Camellia japonica. While, the Gate site is near the service gate of Gyoen, which was once occupied by residential buildings and then turned to a forest currently composed of Japanese maple and Castanopsis sieboldii. The landscape photos of the two observation stations are shown in Fig.2.
A thermometer (HOBO/U12-800, Onset Computer Corporation, Massachusetts) and soil moisture meter (EC-5, DECAGON Devices Inc., Pullman) were installed in each profile at depths of 2, 10, 30 and 50 cm. The data was collected at 30-min intervals using loggers from February 2015 to December 2016. The measurement error of the thermometer was ±0.35°C at 20°C.
Soil survey and soil analyses
Soil surveys were carried out in advance in the open pits, which were prepared for the instrument installation. Soil hardness was measured by Softness (cm drop-1) using a dynamic cone penetrometer (H-100, Daito Techno Green, Tokyo) adjacent to the pits. Softness (cm drop-1) describes the soil penetration resistance based on the depth (cm) of cone penetrating into soil per stroke by dropping a 2 kg mass hammer from 0.5 m height. In this measurement, the decrease of softness value (cm drop-1) describes the increase of soil compaction. Bulk density (Mg m-3) and solid phase fraction of soil (m3 m-3) were obtained by measuring the three phases using a digital actual volumenometer (DIK 1150, Daiki Rika Kogyo Co Ltd, Saitama). The fraction of air (m3m-3) was obtained by subtracting volumetric fraction of solid (v/v%) and water content (v/v%) from 100 (v/v%). Soil pH was measured by electrode method (TPX-999, TOA). The content of total carbon (g kg-1) of the soils was measured by dry combustion method using an NC analyzer (NC-22F, Sumika Chemical Analysis Service Ltd., Osaka).
Calculation of thermal properties
Thermal diffusivity (cm2 s−1) and thermal conductivity (Wm-1K-1) were calculated based on the change of soil temperature between the layers of depths 2 and 10 cm. The data of water content was taken from the daily mean moisture content at depths of 2 and 10 cm. Thermal properties were calculated from the wave amplitude on the assumption that the diurnal change of soils at 2 and 10 cm depths on non-rainfall days are represented by a sinusoidal wave.
3. Results and Discussion
The difference of the soil profile structures
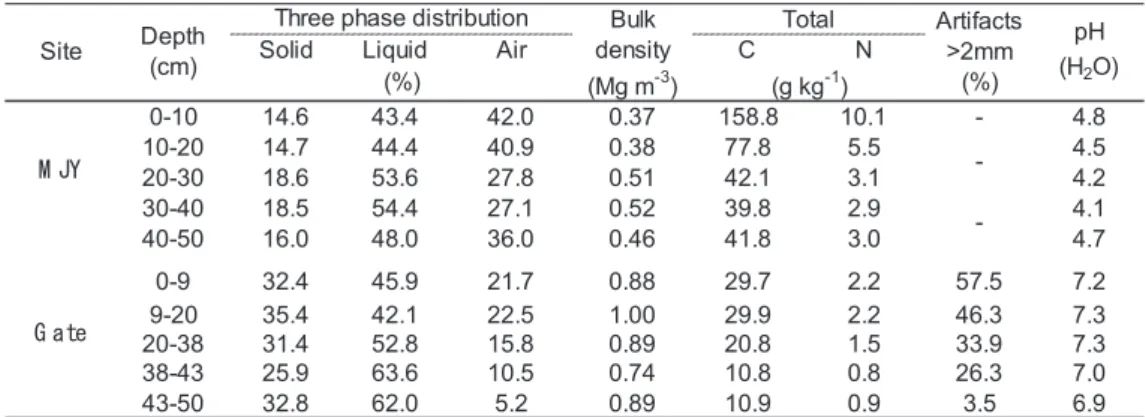
Table 1 and Fig. 3 represent the soil profile descriptions of the two forest sites: Momijiyama (MJY) and Service Gate (Gate). The MJY profile was divided into three horizons the Gate profile
was divided into five horizons according to soil color and soil texture. The softness value in the MJY profile was approximately 1–2 cm drop−1 from ground surface to a depth of 50 cm. Although the layer around depth of 5–15 cm in the MJY profile tended to have a strength deficiency shown by the large value of Softness > 4. The layer of The bulk density and volumetric solid fraction in the MJY profile was 0.37–0.52 Mg m-3 and 14.6–18.6 %, respectively. There was no artifact in the profile. The soil pH and total C content of the MJY profile were 4.1–4.8 and 39.8–158.8 g kg-1, respectively. A strong profile disturbance was recognized in the Gate site. The profile was strongly consolidated (softness value: 0.1–0.2 cm drop-1) and had a compaction feature (softness value <0.1 cm drop-1) at the depth of 20–30 cm. The bulk density and volumetric solid fraction of the Gate profile was 0.74–1.0 Mg m-3 and 25.9–35.4 %, respectively, which contained artifacts (>50 wt %) such as concrete and porcelain rubbles. The soil pH values and total carbon content were 6.9–7.3 and 10.8–29.9 g kg-1, respectively.
Table 1 Soil properties of Momijiyama (MJY) and Service Gate (Gate) profiles
Solid Liquid Air C N
0-10 14.6 43.4 42.0 0.37 158.8 10.1 - 4.8
10-20 14.7 44.4 40.9 0.38 77.8 5.5 4.5
20-30 18.6 53.6 27.8 0.51 42.1 3.1 4.2
30-40 18.5 54.4 27.1 0.52 39.8 2.9 4.1
40-50 16.0 48.0 36.0 0.46 41.8 3.0 4.7
0-9 32.4 45.9 21.7 0.88 29.7 2.2 57.5 7.2
9-20 35.4 42.1 22.5 1.00 29.9 2.2 46.3 7.3
20-38 31.4 52.8 15.8 0.89 20.8 1.5 33.9 7.3
38-43 25.9 63.6 10.5 0.74 10.8 0.8 26.3 7.0
43-50 32.8 62.0 5.2 0.89 10.9 0.9 3.5 6.9
Artifacts
>2mm (%)
pH (H2O)
-
G ate
M JY -
(%) (g kg-1)
Site Depth (cm)
Three phase distribution Bulk density (Mg m-3)
Total
Fig. 3 Vertical profiles of soil compaction in the profiles, MJY (a) and Gate (b).
(a)MJY (b) Gate
:1st
:2nd
:3rd
Seasonal change of soil temperature
Figure 4 shows the sequential change of the soil temperature in the forest profiles (MJY and Gate) at each depth (cm) in a week of summer and winter seasons having no rainfall. A clear diurnal variation of soil temperature in the forest area was confirmed down to the depth of 10cm.
Due to less solar radiation directly reaching to the surface of the earth, the forest area had less variation compared to the turf area in Gyoen, where the diurnal variation was detectable down into the profile to 30 cm depth (Miyajima et al. 2015).
Although the tendency of the diurnal variation did not show much difference between profiles, the diurnal and annual ranges of soil temperature were larger in the Gate profile than in the MJY profile. The temperature difference between the two forest profiles tended to enlarge in the deeper soils. Statistical evaluation (Student’s t-test) was carried out to examine the significance of the mean annual soil temperature difference between the MJK and Gate profiles by depth. There was no significant difference between the soil temperatures of the MJY and Gate profiles for the surface 10 cm soil (0–10 cm), but the soils deeper than 30 cm had significant difference between the two profiles at significance level P<0.05.
The temperature difference between MJY and Gate profiles through the observation period is shown in Fig. 5. In February, the MJY profile had higher temperature by 1.2 °C than the Gate profile in the deeper soils (>30cm). Reversely, the soil temperature was higher in the Gate profile through the whole day in August; 0.5 °C higher in shallow layers (<20cm) and 2.1 °C higher in deeper soils (>30cm).
Fig. 4(a) Sequential changes of the soil temperature in the MJY and Gate profiles at each depth (cm) in a week of summer season, August 2015 and 2016, having no rainfall.
Time/Date/Year
Temperature(°C)
MJY Gate
Fig. 4(b) Sequential changes of the soil temperature in the MJY and Gate profiles at each depth (cm) in a week of winter season, February 2015 and 2016, having no rainfall.
Fig. 5 Soil temperature difference between MJY and Gate sites by depth.
Time/Date/Year
Temperature(°C)
MJY Gate
2015 2016
MJY-Gate Temperature difference (°C)
Date/Year
Soil temperature regime
Soil temperature regimes are generally obtained by the mean annual soil temperatures (°C) taken at a depth of 50 cm from the soil surface, which are classified into ten regimes; cryic, frigid, hyperthermic, isofrigid, isohyperthermic, isomesic, isothermic, mesic, pergelic, and thermic (Soil Survey Staff 1999). The mesic soil temperature regime has mean annual soil temperatures of 8 °C or more, but less than 15 °C, and the difference between mean summer and mean winter soil temperatures is greater than 5 °C. The thermic soil temperature regime has mean annual soil temperatures of 15° C or more, but less than 22 °C; and a difference between mean summer and mean winter soil temperatures of greater than 5 °C (Soil Survey Staff 1999).
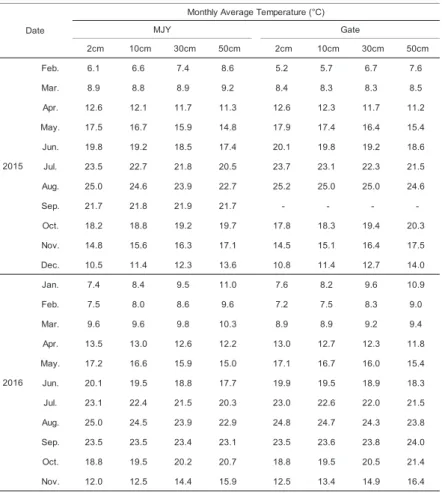
The mean annual temperature recorded at the Tokyo Meteorological station, central Tokyo (35°41'05"N, 139°45'00"E, 25 m a.s.l.) was 16.69 °C. Based on the soil temperature data collected from October 1, 2015 to September 30, 2016, the soil temperatures at the depth of 50cm in the MJY and Gate profiles were obtained as 16.07 °C and 16.35 °C, respectively. The soil temperature differences between mean summer and mean winter at the depth of 50 cm were 10.7 °C and 11.8 °C in MJY profile and Gate profile, respectively (Table 2).
Table 2 Mean monthly soil temperature (°C) by depth in the MJY and Gate profiles
2cm 10cm 30cm 50cm 2cm 10cm 30cm 50cm
Feb. 6.1 6.6 7.4 8.6 5.2 5.7 6.7 7.6
Mar. 8.9 8.8 8.9 9.2 8.4 8.3 8.3 8.5
Apr. 12.6 12.1 11.7 11.3 12.6 12.3 11.7 11.2
May. 17.5 16.7 15.9 14.8 17.9 17.4 16.4 15.4
Jun. 19.8 19.2 18.5 17.4 20.1 19.8 19.2 18.6
Jul. 23.5 22.7 21.8 20.5 23.7 23.1 22.3 21.5
Aug. 25.0 24.6 23.9 22.7 25.2 25.0 25.0 24.6
Sep. 21.7 21.8 21.9 21.7 - - - -
Oct. 18.2 18.8 19.2 19.7 17.8 18.3 19.4 20.3
Nov. 14.8 15.6 16.3 17.1 14.5 15.1 16.4 17.5
Dec. 10.5 11.4 12.3 13.6 10.8 11.4 12.7 14.0
Jan. 7.4 8.4 9.5 11.0 7.6 8.2 9.6 10.9
Feb. 7.5 8.0 8.6 9.6 7.2 7.5 8.3 9.0
Mar. 9.6 9.6 9.8 10.3 8.9 8.9 9.2 9.4
Apr. 13.5 13.0 12.6 12.2 13.0 12.7 12.3 11.8
May. 17.2 16.6 15.9 15.0 17.1 16.7 16.0 15.4
Jun. 20.1 19.5 18.8 17.7 19.9 19.5 18.9 18.3
Jul. 23.1 22.4 21.5 20.3 23.0 22.6 22.0 21.5
Aug. 25.0 24.5 23.9 22.9 24.8 24.7 24.3 23.8
Sep. 23.5 23.5 23.4 23.1 23.5 23.6 23.8 24.0
Oct. 18.8 19.5 20.2 20.7 18.8 19.5 20.5 21.4
Nov. 12.0 12.5 14.4 15.9 12.5 13.4 14.9 16.4
2016 Date
Monthly Average Temperature (°C)
MJY Gate
2015
Referring to the soil temperature map of Tokyo by the National Institute for Agro-Environmental Sciences (http://agrimesh.dc.affrc.go.jp/soil_db/temp/temperature_map), provided in basis of numerical simulation, the mean annual soil temperature at 50 cm depth in western Tokyo is estimated as 14–15 °C (mesic regime) and in central Tokyo as 16 – 17 °C (thermic regime). The results from our observation provided a supplement data to understand soil temperature regime in forest area in central Tokyo is classified as thermic regime.
Thermal properties of the soil profiles
The thermal properties of a soil vary with soil type and moisture content (Sandholt et al., 2002).
Ochsner et al. (2001) elucidated that thermal properties are more strongly correlated with volume fraction of air than with that of water or solid, and demonstrated that thermal conductivity can be described as a decreasing linear function of air-filled porosity based on their measurements. They also noted that the traditional viewpoint of considering thermal properties to be functions of the volume fractions of water and solid may not be the most useful perspective. Abu-Hamdeh and Reeder (2000) mentioned that thermal diffusivity increases with increasing soil density and moisture content and with decreasing percentage of soil organic matter. Concerning these points of view, we calculated the thermal diffusivity (cm2 s−1) and thermal conductivity (W m−1K−1) in each profile and examined the correlations with water content and air-filled porosity from the observation results. As previously mentioned, the thermal properties were calculated from the wave amplitude on the assumption that the diurnal change of soils at 2 and 10 cm depths on non-rainfall days are represented by a sinusoidal wave.
Figure 6a shows the thermal diffusivity in relation with the water content in soils of the Gyoen profiles, respectively. The data of water content was taken from the daily mean moisture content at the depth of 10 cm. The water content of the studied profiles ranged from 0.2 to 0.4 m3 m−3 throughout our observation period. In the two forest sites, the average of the thermal diffusivity was 0.83×10⁻³ cm s-1 in the MJY profile and 2.45×10⁻³ cm s-1 in the Gate profile. Thermal diffusivity was larger in the Gate profile than in the MJY profile irrespective to water content. This suggested the increase of heat transfer may prevail in soils with strong consolidation and presence of concrete rubbles. The less total organic carbon in the Gate profile than in the MJY profile may also act to increase the thermal diffusivity of the Gate profile.
The relation of thermal conductivity and fraction of air in the Gyoen profiles is presented in Fig.6b. In the surface soils (2–10 cm) of the Gyoen profiles, the MJY profile having a weak compaction and a relatively high amount of total carbon had lower thermal conductivity (<0.45 W m−1K−1) and had a slight linear dependency between thermal conductivity and fraction of air.
However, in the Gate profile, having strong compaction and lithological discontinuity, the value of thermal conductivity (0.24–1.85 W m−1K−1) ranged almost independently to fraction of air. From the obtained results it was suggested that regulations such as strong compaction, low total carbon content, and presence of concrete rubbles are responsible for increasing thermal conductivity values of the Gate profile.
5. Conclusion
Heat is generally considered to conduct very slowly in soils, so soil temperature anomalies at short time scales in topsoil are considered to be released to the atmosphere through surface exchange and cannot be distributed to deeper layers. Only persistent anomalies in the surface heat
Fig. 6(a) Thermal diffusivity vs Water Content and (b)Thermal conductivity vs Fraction of Air.
budget can propagate to deep soil layers and affect temperature variati––ons in those layers (Hu and Feng, 2004). We elucidated the seasonal characteristics of urban forest soils based on the two year observation of the soil profiles studied in urban forest in Central Tokyo. The soil thermal behavior differed by structural properties of soil profiles; the soil temperature was likely to increase and decrease faster in the soil profile having stronger compaction and containing larger amount of artificial materials. The soil temperature regime of the forest soils in the Gyoen, central Tokyo was defined as thermic.
The values of thermal properties such as thermal diffusivity and thermal conductivity in the lithological-disturbed soils were significantly larger than those in the undisturbed soils. The thermal diffusivity of the examined soils was 0.3–5.3 × 10⁻³ cm2 s−1 in the profile without artifacts and was higher (0.9–7.9 × 10⁻³ cm2 s−1) in the profile containing larger volume of concrete rubbles.
Thermal properties were not influenced by either the water content or fraction of air in the soil. In soils composed of soft, organic-rich, and clay-rich soil, water retention may impede the increase in soil temperature during daytime, whereas nighttime cooling is prevented by the lower heat transmission due to the larger porosity.
From the observation of the two sets of urban forest soils, it became clear that large thermal diffusivity is one of the characteristics of urban soils involved with strong compaction and lithological discontinuity.
Acknowledgment
We thank the Management Office of Shinjuku Gyoen National Garden, Ministry of the Environment for providing us the opportunity for soil temperature observation.
MJYGate MJY
Gate
(a) (b)
References
Abu-Hamdeh, N.H. and Reeder. C.R. 2000. Soil thermal conductivity: Effects of density, moisture, salt concentration, and organic matter. Soil Science Society of America Journal 64(4):
1285–1290.
Craul, P.J. 1985. A description of urban soils and their desired characteristics. Journal of Arboriculture 11: 330–339.
De Kimpe, C.R. and Morel, J.L. 2000. Urban soil management: a growing concern. Soil Science 165: 31–40.
Edmondson, J. L. et al. 2016. Soil surface temperatures reveal moderation of the urban heat island effect by trees and shrubs. www.nature.com/scientificreports 6: 33708;
doi: 10.1038/srep33708.
Genchi ,Y., Otani,T., Amano, H., Osugi, N., Osa, Y., Nagatomo, H., and Komiyama, H. 1998.
Evidence for Urban Heat Island Phenomena in Soil Temperature Profiles in Tokyo. Tenki 45(9): 707–715.*
Hu,Q. and Feng, S. 2004. U.S. soil temperature and its variation. Bull. Am. Meteor. Soc. 85:
29–31.
Kossowski,J. and Usowicz, B. 1995. Temperature and thermal properties of soil in tractor wheel track as the effect of local soil compaction and microrelief. Zeszyty Problemowe Postepow Nauk Rolniczych - Polska Akademia Nauk 419: 39–52.
Lipiec, J., Usowicz, B. and Ferrero, A. 2007. Impact of soil compaction and wetness on thermal properties of sloping vineyard soil. International Journal of Heat and Mass Transfer 50:
3837–3847.
Miyajima,S., Uoi, N., Murata,T., Takeda, M., Morishima, W., and Watanabe, M. 2015. Effect of structural modification on heat transfer through man-made soils in urban green areas. Soil Science and Plant Nutrition 61: 70–87.
Murata, T., Tanaka, H., Kawai, N., Yano, M. and Watanabe, M. 2012. Fluctuations in soil temperatures at different depth in the Institute for Nature Study. Report of Institute of Nature Studies 43: 1–10. (* in Japanese)
National Institute for Agro-Environmental Sciences 2011. Soil Information Data System, Map of Soil temperature Regimes. http://agrimesh.dc.affrc.go.jp/soil_db/temp/temperature_map.
(January 6th, 2017)
Ochsner, T.E., Horton, R., Ren, T. 2001. A new perspective on soil thermal properties. Soil Sci.
Soc. Am. J. 65: 1641–1647.
Sakuma, T. 1987. Temperature Regime of a Coarse-textured Volcanogenous Regosol under a Deciduous Forest. Research Bulletins of the College of Experiment Forests Hokkaido University 44: 567–575.
Sakuma, T. and Kobayashi, N. 1987. Water and Heat Balance of a Deciduous Forest and Their Relation to a Forest Environment. Research Bulletins of the College of Experiment Forests Hokkaido University 44: 507–535.
Sandholt, N., Rasmussen, K., Andersen, J. 2002. A simple interpretation of the surface temperature/vegetation index space for assessment of surface moisture status. Remote Sensing of Environment 79: 213–224.
Savva, Y., Szlavecza, K., Pouyatb, R.V., Groffmanc, P.M. and Heislerd, G. 2010. Effects of Land Use and Vegetation Cover on Soil Temperature in an Urban Ecosystem. Soil Science Society of American Journal 74:469–480.
Shi,B., Tang, C.S., Gao, L., Liu, C. and Wang, B.J. 2012. Observation and analysis of the urban heat island effect on soil in Nanjing, China. Environmental Earth Sciences 67: 215–229.
Soil Survey Staff 1999. Soil taxonomy, A basic system of soil classification for making and interpreting soil surveys. 2nd edition. Natural Resources Conservation Service. U.S.
Department of Agriculture Handbook.
Tokyo Metropolitan Government 1998.Fundamental Land Classification Survey 1:50,000 Soil Map, North western Tokyo.
Turkoglu, N. 2010. Analysis of urban effects on soil temperature in Ankara Environmental monitoring and assessment. Environmental Monitoring and Assessment 169: 439–450.
Uoi, N.,Watanabe M. and Murata,T. 2014. Relation between vertical soil compaction and land use history in urban green space: A case study of Kitanomaru Garden, Kokyo Gaien national Garden. J. Jpn. Soc. Revegetation Technology 39: 412–421.*
Usowicz, B., Lipiec, J. and Ferrero, A. 2006. Prediction of soil thermal conductivity based on penetration resistance and water content or air-filled porosity. International Journal of Heat and Mass Transfer 49: 5010–5017.
(*: in Japanese, **: in Japanese with English abstract)