バンコク市の都市廃棄物管理の現状と課題 高杉正治・後藤孝志 株式会社NJS コンサルタンツ第 3 技術部 要 旨 バンコク市は東南アジア最大の都市で、人口は未登録人口を含め900 万人が居住していると推計されて いる。その市域から排出される都市ごみの量は膨大であり、2010 年で日量 8,900 トンに達している。バ ンコク市の行政機関であるBMA(Bangkok Metropolitan Administration)は、直轄事業として市全域の公共 施設、公共用地から排出されるごみを収集し、一般家庭、事業所のごみは、50 の区役所が、収集・清掃 を担当している。 タイの法制度において、地方自治体のごみ処理に係る責任、権限は保健法(1992)を初めとして幾つか の法律で規定されているが、体系的な廃棄物法が制定されていないため、BMA を含む地方自治体が総 合的な廃棄物管理行政を実施する際の弱点となっている。環境省では廃棄物法に関する草案をすでに策 定しているが、タイ国内政治の混乱もあり草案審議が実施できない状況にある。廃棄物法の制定とは別 に、国家廃棄物管理計画が2003 年に環境法に基づき国家環境委員会で承認されており、各地方自治体は 同計画が示す骨組み並びに達成目標値を基に廃棄物管理を実施している。BMA は、膨大な廃棄物を処 理しているにもかかわらずマスタープランが策定されていないため、現状では、一貫した短期-中期-長 期計画による廃棄物管理が実施できていない。 BMA は 2005 年の機構改革以降、環境部が設立され、その下部組織である固形廃棄物・有害廃棄物・し 尿管理課及び固形廃棄物処分課が廃棄物管理を担当している。バンコク市において、ごみの収集・清掃 に従事する人数は約21,000 人に達する。収集されたゴミは中継施設を経由して隣接県の民間処分場にお いて衛生埋立で処分されている。 都市化により、市域内に最終処分場を確保できない BMA にとってごみの減量化並びに埋め立てごみ量 の削減は廃棄物管理の重点課題である。それを実現する 3R 活動(減量化、再利用、再資源)は学校、 百貨店、コミュニティー等の14 の施設を対処とした 5,862 ヶ所で実施され成果があがっているが、他の 施設並びに区域への拡大促進が課題である。また、最大の排出者である一般家庭を対象とした 3R 活動 参加への取り組みが遅れており、今後は、住民の社会運動としての3R 活動の確立が望まれる。 処分ごみ量の削減において焼却は最大の効果が得られる処理方法である。再生可能エネルギーとして 廃棄物の施策の一つであるWaste to Energy 計画は BMA の廃棄物管理の最大の課題である処分ごみ量の 削減に寄与する。この計画の実施においては全量焼却とせず有機性廃棄物の堆肥化、バイオガス化等の 処理を計画に含め、“最大限の再資源化による最小限の焼却規模”を目標として実施することが課題克服 に有効な手法となる。 1. 都市廃棄物管理に関する背景 現チャクリ王朝の初代国王ラーマ1 世が 1782 年に首都をトンブリーからチャオプラヤ川の対岸のラタナ コシン島に移してからバンコクがタイ王国(以下、タイと呼ぶ)の行政・経済の中心となった。建設か らラーマ5 世時代までは、バンコクはチャクリ王朝の国王による直轄地であった。しかしラーマ 5 世統
治以降、市街地が拡大を始めたため、チャクリ改革によって、バンコクは内務省の管轄に置かれること になった。1970‐1980 年代にはさらなる都市の拡大が起こり、1985 年にバンコク首都府行政組織法が成 立すると、内務省の直轄管理を離れ、現在と同様に住民選挙で選出された知事による自治が行われるよ うになった。 バンコク市域面積は約1,570 ㎞2で、現在50 区に分割統治されている。登録人口は過去 10 年をみるとほ ぼ横ばいの5.7 百万人であるが、未登録人口を含むと 9 百万人が居住していると推計されている。バン コク市内で収集されたごみは1960 年代以降には市内 3 カ所(オンニュット、ノンケム、ラマイントラ) においてオープンダンピングで処分されていた。1980 年代後半には上述 3 カ所の処分場が満杯となった。 都市化の進展に伴い代替の公有地も選定できなくなった影響もあり、1990 年代前半には民間委託契約に よる市内及び隣接県の民有地での衛生埋立て処分が開始され、現在に至っている。 BMA の廃棄物担当部局は、2005 年に機構改革が行なわれ、環境部が行なうこととなった。BMA は現 在のところ50 の行政区に分割されており、各区域内は各々の区が収集を実施している。BMA の直轄に よる収集も実施されており、公共施設や公園等から排出されるごみ収集を行っている。2010 年時点での BMA 及び行政区による収集ごみ量は日平均で 8,700 トンに達する。2004 年の日量 9,400 トンをピークに 減少傾向にあったごみ量はここ数年で再度増加傾向に転じている。収集されたごみは市内の3 カ所にあ る中継施設(オンニュット、ノンケム、サイマイ)で大型輸送車に積み込まれ、オンニュットとサイマ イはナコンパトム県のカンペンセンで、ノンケムはチャチョンサオ県のパノムサラカムに輸送され衛生 埋め立て処分がなされている。 タイでは国家経済社会開発5 ヶ年計画が 1961 年から開始された。第 6 次計画(1987‐1991)以降は天 然資源・環境の悪化に伴い、施設整備により水質汚染、廃棄物問題の改善を図ることを重要課題として いる。5 ヶ年計画は下水道施設整備を促進させてきたが、廃棄物管理に関してはバンコク市も含め自治 体での近代的施設の導入が遅れており、今後における整備・改善計画の実施が急務となっている。 2. 都市廃棄物管理の法制度及び国家計画 2.1 廃棄物管理の法制度 住民や自治体の廃棄物に対する責任は各種の法律、条令で規定されているが、統合的な廃棄物法はい まだ制定されていない。現在、天然資源環境省で廃棄物法草案の策定が策定されており、法案提出、国 会承認、施行が実施されることとなる。以下は都市廃棄物の関連法についての概説である。 2.1.1 保健法(1992) 保健法は1992年に改訂された。下水及び固形廃棄物に関しては第18条‐第20条に規定されている。第 18条は下水及び固形廃棄物の処分に対する地方自治体の権限及び責任が規定され、また適切な理由があ ればその収集、輸送、処分を規制・監視のもとに民間に委託できる権限を有することを規定している。 第19条はいかなる人も地方自治体の許可なしに収集、処理、処分を業務として行うこと及びサービス料 金の徴収の禁止を規定している。第20条は公共の清潔さ秩序の維持の為、地方自治体に条例の制定を認 めている。その認められた項目の中には地方自治体が定めた所定の場所以外での下水、固形廃棄物の排 出を禁止する規定、収集料金の設定などが認められている。従って、現段階において、BMAでは中継基 地から先の処分までを民間会社に委託している。
2.1.2 地方分権化法(1992) 中央政府に集中していた権限を地方自治体に移譲することを定めた法律で、同法の施行により補助金 を含めた行政改革が実施されている。廃棄物に関しては第16‐18条に地方自治体、県自治体、パタヤ市 及びバンコク市の権限及び責任において公共の利益の為に実行する事項が規定されており、その中には 廃棄物及び廃水に関するサービスが含まれる。第23-25条には公共サービスに対して料金を徴収できる ことが定められている。 2.1.3 工場法(1992) 工場法は創設及び運営に関する規定を定めたものであるが、第8条5項に工場運営に関連して基準及び 規制の方法を採用し排出する廃棄物、汚染物質並びにいかなる物が環境に影響を与えないようにしなけ ればならないことが規定されている。 2.1.4 環境保全促進法(1992) 環境質保全促進の為の規制を定めた法律で、国家環境委員会の設立、環境基金の設立、環境アセスメ ントの実施、公害防止指定区域、県環境改善計画の策定、各種環境基準、排水・排出基準、汚染規制委 員会の設立等を定め、包括的にタイの環境管理、自然保護・保全の枠組みを定めている。廃棄物管理に 関連した事項は以下の規定が定められている。 (1) 環境基金 第23条は環境基金を政府機関又は地方自治体の建設・運営する中央処理・処分施設に無償資金として 与える規定がある。また、地方自治体並びに国営企業が単独で行う処理・処分施設に対しては有償資金 として貸し出す規定となっている。汚染防止に対し法律的な義務がある民間人も有償資金が借りられる 規定となっている。 (2) 国家環境管理計画及び県環境管理アクションプラン 第35条に環境大臣は環境質管理計画の策定を行い国家環境委員会の承認を受けることが義務付けられ ている。この計画においてポイントソースからの汚染防止計画を行うことが第36条に規定されており、 廃棄物管理施設の計画も含まれることとなる。この国の計画を受けて、第37条に、公害防止指定区域と して定められた県は県環境質管理アクションプランを策定し国家環境委員会の承認を受ける規定となっ ている。 承認された県環境質管理アクションプランには優先的に環境基金が配分されることを第39条 に定めている。 (3) 環境アセスメント(EIA) 環境大臣は国家環境委員会の承認を得て環境への影響が想定されるプロジェクトに関してその種類、 規模及び活動について規定し、プロジェクト実施者はフィージビリティー調査を行う際に環境アセスメ ント報告書を策定することが第46条に定められている。2009年の省令改訂に示されるEIAの対象となるプ ロジェクトの種類及び規模では廃棄物管理施設は含まれていないが、同省令では資源化ごみの再生工場 はEIAの対象となっている。また、プケット県、チョンブリ県などは独自に廃棄物管理施設のEIAを義務 付けており、処理規模が日量50トン以下はIEAが、50トンを超える場合はEIAの実施が必要となっている。 (4) サービス料金 第88条に政府資金、地方自治体の収入、環境基金を資金源にした中央廃水処理、廃棄物管理施設の公 共サービス料金に関して、国家環境委員会は汚染規制委員会の助言を得て上限を定めることを規定して いる。ポイントソースの所有者又は使用者は汚水又は廃棄物を中央処理施設に送らない場合、またサー
ビス料金の支払いに応じなかった場合には、罰則として設定されたサービス料金の4倍の金額の支払いを 課せられることが第90条に定められている。2011年現在、収集料金の最低額としては年間240バーツを徴 収している。 (5) 省令 同法に関連した省令には公害防止指定区域、環境基準、排水基準、騒音レベル等制定、施行されてい る。廃棄物に関連しては、都市廃棄物の焼却施設に関連し排出基準が制定されている。焼却施設の規模 を1‐50トン/日と50トン/日以上の規模に分けた基準値が浮遊粒子状物質、二酸化硫黄、二酸化窒素塩 化水素、不透過率、ダイオキシンについて制定されている。施設規模が大きい50トン/日の排出基準が 厳しい基準値となっており、浮遊粒子状物質では1‐50トン/日が400㎎/m3で50トン/日以上が120㎎/ m3の排出基準値となっている。 2.1.5 公共清掃・秩序維持法(1992) 公共の場所の清潔、秩序維持を目的とした法律で道路上での洗車、砂や砂利の道路での保管の禁止を 規定している。第33条は何人たりともし尿、ごみ、廃水を道路又は運河に排出することを禁止している。 第44条では自治体の担当官は市区域の清潔さ、秩序を維持するために市民に対して監視、改善・除去命 令、違反者の逮捕などの権限が与えられることが規定されている。 2.1.6 バンコク市条令 バンコク市条令(1978年)は廃棄物となるものを定義しており、第5条では土地、建物、住居の所有者 は廃棄物の容器を設置する義務を課している。 第8条では何人たりとも公共の場所、道路、運河、溝、 池等への廃棄物の排出、投げ捨て、放置することを保健官又は自治体の担当官の許可なしに行ってはな らないと定めている。第14条はBMAの役人以外の人が廃棄物を輸送、ごみ箱を漁る、車両又は船舶で輸 送、または処分場での同様な活動を禁止している。バンコク市条例(1985)は市の権限・責任にについ て27項目を規定しており、その中に市域の清潔さ、衛生の維持・管理が含まれる。また、バンコク市条 令(1998年)は民間セクターが料金を徴収して行う廃棄物の収集、運搬、除去のサービスを行う際にバ ンコク市のライセンスを取得しなければならないことが定められており、ライセンスはバンコク市と同 意書を交わして責務、責任を実行することとなる。 2.2 廃棄物管理の政策 2.2.1 第10 次国家経済・社会開発 5 ヶ年計画(2006~2011) 1997 年のタイ貨幣の変動相場制移行を契機とした東南アジア各国を巻き込む経済危機以降の国民の 経済的打撃に対し現国王は教示を行った。その精神に基づく”Sufficiency Economy”の原理から、第 10 次 5 カ年計画は 4 つの使命の実践により“Green and Happiness Society”の実現を目標としている。使命のひと つに生物多様性の保全及びゆるぎない天然資源の基盤及び環境質の保全が掲げられている。廃棄物に関 連しては都市部において一人一日当たりのごみ発生量を1 ㎏以下とすること、並びにコミュニティーや 産業から排出される有害性廃棄物の少なくとも80%を適切な処分を行うことを目標としている。その実 現のための戦略において下記事項が示されている。 少なくとも30%の廃棄物の再利用・再使用 使用した製品の供給者及び輸入業者による有害性廃棄物回収システムの創設 都市ごみ、E-waste、有害性廃棄物、感染性廃棄物の処分能力の向上を経済的動機付けによる減量、
発生源での分別、コミュニティー又は個人のビジネスへの支援、 有害性廃棄物管理への民間セクターによる投資、 技術支援、財政支援、意識改革などを通じて地方自治体の汚染物処理・処分の向上を図る、 地方自治体の環境管理を支援する為のごみ料金徴収、 施設の開発によりインパクトを受けるコミュニティーへの適切で公正な補償 危険区域、観光地の中央処理処分施設の建設、改善、拡張に対する投資の政府予算配分による支 援 再利用、再使用、有害性廃棄物のビジネスに対する刺激策、低金利融資策等による政府支援 コミュニティーの廃棄物を適切な技術で代替エネルギー源として利用することに対する支援 廃棄物のリサイクリングビジネスを促進させるためのガイドライン及び対策に関する研究 住民による減量化、分別を含むクリーンプロダクション及び消費の為の研究、 2.2.2 国家環境質管理計画(2006‐2011) 環境に関する国家政策並びに計画は環境保全促進法、第35 条、第 36 条で定めている国家環境質管理 計画(1997‐2016)として策定、承認されている。そのより具体的な計画は 5 ヶ年計画として策定され、 現在は第二次環境質管理計画(2007‐2011)の実施期間中である。第二次環境質管理計画(2007-2011 年) は、2007 年 3 月1日に政府広報 142 により布告された。本計画は、環境質管理計画(1997‐2016)を基 本とし、県自治体が地方自治体を含む県環境質管理計画(実行計画)を策定する際の指針として活用す ることを狙いとしている。第二次計画においても第一次計画で採用した天然資源・環境管理への住民を 含むステークホルダーの参加を継承した計画策定となっている。その第二次計画の目標とする項目並び に廃棄物に関連する到達目標を次の通り定めている。 (1) 持続可能な発展の為の天然資源及び脆弱な区域の保護 (2) 住民の生活の質の向上の為の安定した環境質の維持 都市ごみの発生量を1kg/日/人以下に低減、 都市ごみのリサイクル率を30%以上とする、 全国で、都市ごみの40%以上を適切に管理、 都市ごみ中の有害性廃棄物の30%を適切に管理、 各地域に少なくとも1 カ所のクラスターによる廃棄物管理施設を創設し計画を促進、 産業廃棄物総量の95%を適切に管理 (3) 天然資源、環境に関する国際間の責務並びに同意における国益の保護 第二次計画では、計画実施の為の原則、戦略、ツール及び対策を定めており、原則に関しては下記5 項 目を掲げている。 (1) 汚染者負担(PPP) (2) 政府と民間のパートナーシップによる共同責任 (3) 予防的手法の採用、戦略的環境影響評価(SEA)の政策策定時の導入 (4) 情報公開 (5) 受益者負担 同計画の実施においては、全国16 カ所の天然資源・環境管理地方事務所が策定する各地域での環境管 理計画並びに各県が策定する県環境管理計画、さらには各地方自治体が策定、実施するアクションプラ ンがあり、中央政府、県自治体、地方自治体の行政間で整合性のとれた計画となっている。
2.2.3 国家廃棄物管理計画
国家廃棄物管理計画は天然資源環境省の公害管理局(Pollution Control Department: PCD)により草案が 策定され、国家環境委員会により2003 年 10 月 30 日に承認された。国家廃棄物管理計画では 1)全国で 廃棄物発生原単位の削減及び 2)有機性廃棄物及びマテリアルリサイクルを最大限とすることに主眼点 をおいている。その目標とするところは、 バンコク及びパタヤで一人一日発生ごみ量を1 ㎏以下とし、他の市町村では自治体の規模に応 じて一人一日発生ごみ量を0.8 ㎏、0.6 ㎏及び 0.4 ㎏以下にする 廃棄物収集及び輸送の効率を上げ、未収集率をバンコク及びパタヤでは 5%以下とし、その他 の市町村では10%以下とする。 そのための対策としては次の事項を掲げている。 有機性廃棄物の利用、再使用、再利用の促進を図り、全国において30%以上を達成する、 地方自治体を奨励し、各県で中央処理・処分施設の整備を行う しかしながら、有効的で効率的な国家廃棄物管理計画の実施の為には現在の法整備が整っていないこ とから公害管理局で廃棄物法草案を策定し、国会審議・承認を待っているところである。 国家廃棄物計画実施の一環として中央廃棄物処理・処分施設の整備促進のための廃棄物クラスター計 画が策定され、2005 年 11 月に政府の承認を受けている。同計画は単独の市町村で整備を実施する際に 課題となる技術面並びに財政面に対処する方法であるとともに、施設のスケールメリットによるコスト 削減を目指したものである。 2.2.4 バンコク市廃棄物管理政策 過去において JICA がマスタープランを策定、提出しているが、その内容は焼却処理を主体としたも のであり、当時のバンコク市の財政的な理由並びに明確な国及びバンコ市の廃棄物政策の不備等の事情 により採用されていない。関連部局においても廃棄物管理の基本計画を策定していない。従ってバンコ ク市には廃棄物管理に関し、明確な政策・計画のもとで廃棄物行政が実施されてはいない状況となって いる。しかしながら、現市長が打ち出した、バンコク市の環境に関連した政策は次の4 項目であり、廃 棄物関連の2 項目が含まれている。 緑地帯の拡張 充分な数のごみ容器の供給 ゴミ銀行の設立及びWaste to Energy の実施 再生可能なエネルギー利用の促進 また、日々の廃棄物管理業務の実施においては廃棄物管理行政の方向性が窺われる活動が行われてお り、また、環境部が度々行っているプレゼンテーションを集約すると以下の項目が廃棄物管理政策項目 といえる。 発生源での3R 活動 収集場所、時間の設定、分別収集(有機性ごみ、有価物、その他残渣、有害性廃棄物) 感染性廃棄物の焼却、 ごみ質に応じた処理・処分の効率化、 Waste to Energy の促進 処分ごみ量の削減
民間業者の活用 3. 廃棄物管理実施機関の状況 3.1 廃棄物管理に関連する中央政府機関 国家レベルの都市廃棄物管理の責任官庁は天然資源環境省である。天然資源環境省の部局で政策・計 画を担当する部局が天然資源政策・計画局(ONEP)であり、計画の実施においては公害管理局(PCD) が担当することとなる。このほか、県環境管理計画、整備計画の実施、補助金申請において内務省の地 方自治管理局(DOLA)、公共事業局(PWD)、保健省等が中央政府関連機関となっている。実際の地方 自治体への支援、指導、監督等の活動は天然資源環境省の全国16 カ所に設置された天然資源環境地方事 務所が行っている。 3.2 バンコク市廃棄物管理部局 バンコク市の廃棄物管理は清掃部が実施していたが、2005 年に機構改革で環境部が設立され担当部局 となり、環境部の下にある固形廃棄物・有害廃棄物・し尿管理課及び固形廃棄物処分課が廃棄物管理業 務を実施している。 その組織図は図‐1 の通りである。
図1 バンコク市廃棄物関連部局組織図 環境部の職員数は2009 年時点の 4,987 名である。その内、廃棄物関連の職員数は約 45%の 2,760 名で その一部の職員はBMA の直轄収集作業に従事している。 表1 バンコク市環境部の職員数(2009 年) 環境部部局 役職員 正職員 臨時職員 合計 率 固形廃棄物・有害廃棄物・し尿管理部 126 1,266 182 1,574 31.6% 固形廃棄物処分部 87 540 26 653 13.1% 小計(廃棄物関連部局) 213 1,806 208 2,227 44.7% 廃棄物関連以外の部局 313 1,976 471 2,760 55.3% 計(環境部) 526 3,782 679 4,987 100.0%
資料:Bangkok State of Environment 2008-2009, Department of Environment, BMA
4. 民営化(民間委託)の状況 バンコク市の廃棄物業務の民営化は比較的早く 1990 年代前半には民間委託契約による市内及び隣接 県の民有地での衛生埋立て処分が実施されるようになった。また、コンポスト施設の運転維持管理、収 集車両のリース契約などが現在実施されている。既述の国家廃棄物管理計画において政府機関と民間の パートナーシップによる廃棄物管理業務を実施するという戦略を鑑みると、今後において、民営化、民 間委託が推進されることとなる。バンコク市の現在の民間委託は5 年契約を基本として行っており、そ 環境局局長 環境局副局長 (総務) 環境局副局長 (運営維持管理) 秘書室 固形廃棄物・有害性廃棄 物・し尿管理部 固形廃棄物処分部 大気・騒音管理部 政策・計画部 公園事務所 総務課 研究・企画課 有害性廃棄物管理課 廃棄物管理課 清掃課 し尿収集課 オンニュット し尿処理プラント ノンケム し尿処理プラント 管理課 技術課 オンニュット 最終処分センター ノンケム 最終処分センター ソイルマット処分センター
民間最終処分場(衛生埋立) Nakhon Phathom 県 Kampaeng Saen 家庭系 一般廃棄物 事業系 一般廃棄物 家庭系 有害性廃棄物 感染性 医療廃棄物 公共施設 一般廃棄物 50区の各区別収集・輸送 直轄による収集・輸送 直轄による分別収集・輸送 資源ごみ 民間による回収、 収集・運搬 中継施設 ・Sai Mai (2,200t/日) 中間処理施設(On Nut) ・コンポスト施設(1,000t/日) ・医療廃棄物焼却炉(20t/日) 民 間 に よ る 資 源 ご み2 次分別・貯蔵施 設 中継施設 ・Nong Kaem(3,300t/日) 中継施設 ・On Nut (2,300t/日) 民間最終処分場(衛生埋立) Chachoensao 県 Panomsarakham 民間最終処分場 (遮断型埋立) 民 間 の 再 資 源 化 工 場 の概要は表‐2 に示す通りである。 表 2 バンコク市の廃棄物管理民間委託契約一覧(2009 年) 民間契約名称 サイト 実績規模(2009 年) 中継基地及び最終処分場 運営維持管理 Saimai 中継基地(Bangkok)、Kampaeng Saen 最終処分場(Nakhon Phathom 県)
中継基地:2,200t/日 中継基地及び最終処分場
運営維持管理
Nong khaem 中継基地(Bangkok)、 Kampang San 最終処分場(Nakhon Pathom 県) 中継基地:3,300t/日 中継基地及び最終処分場 運営維持管理 On Nut 中継基地(Bangkok), Panomsarakham 最終処分場 中継基地:2,300t/日 コンポストプラント運営 維持管理 On Nut 中継基地隣接地 投入 1,000t/日(製品 300t/日 感染性廃棄物収集及び焼 却 On Nut 中継基地隣接地 収集対象医療施設:2,002 ヶ所、 焼却施設定格 20t/日 収集車両リース バンコク市内 リース車両総数 1,477 台 5. 廃棄物管理の現状と問題点 5.1 廃棄物管理の現状 5.1.1 廃棄物管理全体フロー バンコク市の廃棄物管理の全体像は次の図-2 に示す通りである。 図-2 バンコク市の廃棄物管理全体フロー
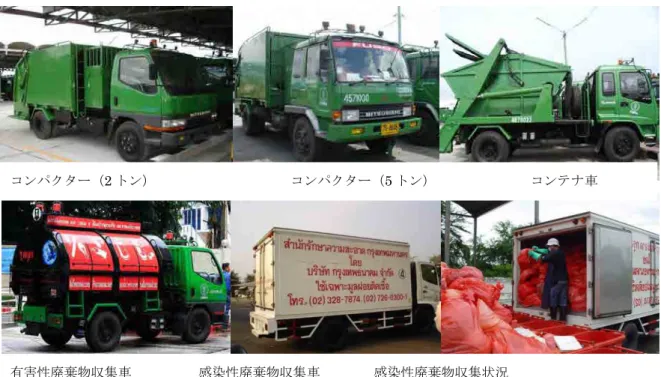
5.1.2 排出、清掃、収集 BMA の清掃は 50 ある区役所及び BMA の環境部、固形廃棄物・有害廃棄物・し尿管理課及び固形廃 棄物処分課が担当している。基本的には戸別収集を行っており、各家庭はごみの排出に区役所が供給又 は個人で調達し家の前に設置した容器にごみを排出している。家庭系の一般廃棄物は混合収集であり、 事業系の一般廃棄物と合わせて50 ある区役所が各々収集を行っている。道路清掃も各区役所の担当業務 となっている。BMA が直轄で収集を行っているのは公共施設、生鮮品市場、サンデーマーケット、公 園、運河・チャオプラヤ河の浮遊ごみ等の収集を行っている。また、分別された家庭系有害性廃棄物及 びクリニックなどからの感染性医療廃棄物の収集も BMA が直轄で収集を実施している。収集は下記ル ールに従い実施されている。 主要道路:午後8 時‐午前 3 時、午前 6 時までに完了 住宅地及び街路:場所に応じ毎日又は隔日収集 厨芥:場所に応じ毎日又は隔日収集 資源ごみ:毎日曜日 家庭系有害性廃棄物:毎月1 日及び 15 日 粗大ごみ等:電話受付 収集車両及び清掃作業員の一覧を表‐3 に示した。また、代表的な収集車両を図‐3 に示した。BMA は約2,000 台の収集車両、7、600 人の収集作業員及び 9,000 人の道路清掃作業員を含む約 21,000 人で収 集を実施していることになる。収集車両の70%以上がリース契約によるものであるが、リース会社が車 両の修理・維持管理を行うことで経費の削減が図られている。 表3 収集車両及び清掃作業員の状況(2010 年) 収集車両の種類 リース契約車両 BMA 車両 合計台数 コンパクター、5 トン 746 342 1,088 コンパクター、2 トン 357 39 396 コンパクター、8m3 172 51 223 サイドローダー、1.5 トン 32 91 123 コンテナー車、6 トン 170 - 170 有害性廃棄物収集車 - N. A. N. A. 感染性廃棄物収集車、3 トン - 2 2 感染性廃棄物収集車、2 トン - 3 3 感染性廃棄物収集車、1 トン - 17 17 収集車両合計 1,477 545 2,022 収集車両運転手 2,587 収集作業員 7,591 道路清掃作業員 9,042 地区の協力者 246 ボランティア 252 資料:パワーポイントプレゼンテーション2010、Mr.Thongchai Bitrakul, Director, Solid Waste, Hazardous
図3 BMA 清掃車両 2005 年度から 2010 年度の一般廃棄物の収集量は表-4 に示す通りである。2010 年度においては日量約 8,900 トンとなっている。バンコク市の収集ごみ量は 1990 年代後半には日量 9 千トンを超えていたが、 1997 年 7 月に始まった通貨危機により一時排出量が減少した。しかしながら表-3 に示すように 2005 年 以降再度ごみ収集量の増加傾向がみられる。 表4 バンコク市ごみ収集量
会計年度 FY2005 FY2006 FY2007 FY2008 FY2009 FY2010
総ごみ収集量(ton/day) 8,496 8,377 8,719 8,780 8,788 8,868 総登録人口(人) 5,658,953 5,695,956 5,716,248 5,710,883 5,702,595 5,701,394 平均人口密度(人/km2) 3,644 3,667 3,680 3,677 3,672 3,671 平 均 面 積 当 り ご み 排 出 量 (ton/km2) 5.5 5.4 5.6 5.7 5.7 5.7 平均一人一日排出量(g/c/day) 1,501 1,471 1,525 1,537 1,541 1,555 資料: ごみ量http://portal.bangkok.go.th/public_files/news/cms_detail/0108446.pdf 人口http://service.nso.go.th/nso/nsopublish/BaseStat/tables/11000_Bangkok/1.1.3-1.xls, 2011.09.10 5.1.3 減量化・再資源化 市域内に最終処分場のないバンコク市の廃棄物管理において減量化・再資源化は重要課題であり、結 果としての最終処分場への搬入量の減量化は焦眉の事項となっている。BMA は減量化への方策として 下記のプログラムを実施している。このプログラムは主としてバンコク市の学校435 校及び専門学校 18 校で実施されている。 プラスチック袋の代わりに布袋を使用することを奨励 発泡スチロール及びプラスチックの減量化の為バイオパッケージング計画を推進 コンパクター(2 トン) コンパクター(5 トン) コンテナ車 有害性廃棄物収集車 感染性廃棄物収集車 感染性廃棄物収集状況
写真提供:Mr.Thongchai Bitrakul, Director, Solid Waste, Hazardous Waste and Night Soil Management Division, Department of Environment, BMA
製造業者及び卸業者に対して包装の減量及び分解可能材料の使用を奨励 再利用の方策としては下記のプログラムを実施している。 再資源化材料を改変して新しい製品にするコンテスト 利用済みのものを寄贈してもらい有効なものに変えるプロジェクト プラスチック袋の代わりに布袋を使用することを奨励 バンコク市の行うリサイクル活動は、発生源での分別及び資源化物の回収を14 の対象グループ、1) BMA の学校、2)BMA 保健所、3)大学、4)銀行、5)百貨店、6)コンビニ、7)市場、8)寺院・宗 教施設、9)コミュニティー、10)住宅団地、11)高層ビル、12)ホテル、13)私立学校及び 14)OBEC の学校等の5,862 カ所で実施している。この活動の中にはゴミ銀行、コンポスト化等の活動も含まれる。 コンポスト化の活動の中にはバイオガスの製造・利用も含み、その際にはコンポスト化は副産物として 製造される。バイオガス製造のタンクは40 基が調達され、主として BMA の学校で試験的に実施されて いる。コンポスト化はコミュニティー及び学校を主体として行われており、ウィンドロー及び高倉方式 による取り組みがなされている。上述の資源物回収に加えて、収集車の作業員及び街をめぐり資源物を 回収する廃品回収人、中継基地での資源物回収、最終処分場で資源物回収も活動的に実施されている。 5.1.4 中間処理 On Nut 中継施設の隣接地において下記の施設により中間処理が実施されている。 コンポスト施設(1,000t/日) 医療廃棄物焼却炉(20t/日) 区役所主導での学校及びコミュニティーレベルでのコンポスト化 コンポスト施設は定格規模の1,000 トン/日で稼働している。混合ごみを原料として受け入れているの で、堆肥化不適物の除去を経て最終的に歩留まりが約 30%の 300 トン/日のコンポストが製造されてい る。コンポストは、主に市内の公園及び公園の植樹の為の苗木作りに利用されている。バンコク市は各 区に設置されている保健所及び民間のクリニックから排出される感染性医療廃棄物を、1 トン車を主体 とした22 台の収集車により分別収集している。感染性廃棄物の収集量は日量 18-20 トンとなっている。 学校及びコミュニティーのボランティアによる有機性廃棄物のコンポスト化は区役所の指導で実施され ているが、すべての区で実施されているわけではなく、原料の有機性廃棄物の利用量に関する資料は整 理されていない。 5.1.5 運搬・最終処分 50 の区役所及びバンコク市が直轄で収集した都市ごみは市内に立地する 3 カ所の中継施設に集められ、 そこから隣接県の民間最終処分場で衛生埋立により最終処分している。中継施設、運搬及び最終処分場 の運営維持管理は民間委託で行われている。合計の最終処分量はコンポスト化施設の不適ゴミを含むと 2010 年で日量 8,600 トンとなる。各中継施設、処分場への搬入量は図-4 に示す通りである。
図4 都市ごみ中継及び最終処分の流れ 5.1.6 廃棄物管理予算 表-5 は 2003 年から 2007 年の 5 年間の廃棄物関連費用及びごみ料金収入を示す。5 年間の平均年間廃 棄物管理経費は約31 億バーツ(約 80 億円:換算 2.6 円/バーツ)で収集がその内 63%で処理祖分が 37% という内訳となっている。ごみ料金収入合計は約 3 億バーツ(7.8 億円)で、トン当たりに換算すると 92 バーツとなり、経費合計に対して 10%弱の収入となっている。 表5BMA 廃棄物関連費用及びごみ料金収入(2003 年-2007 年平均値) (単位:百万バーツ) ごみ量 収集経費 処理・処分経費 合計 ごみ料金収入 3.25 百万トン/年 1,970.8 1,155.8 3,126.6 299.7 トン当たり単価 606 バーツ 356 バーツ 962 バーツ 92 バーツ
資料:パワーポイントプレゼンテーション2010、Mr.Thongchai Bitrakul, Director, Solid Waste, Hazardous Waste and Night Soil Management Division, Department of Environment, BMA 、
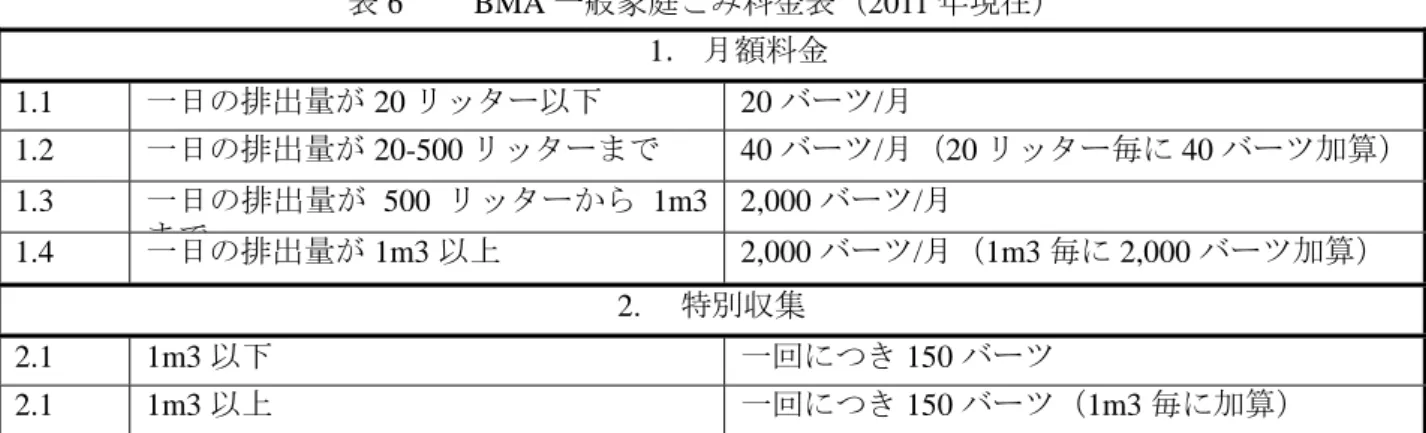
上記、運営維持管理費とは別にプロジェクト予算が計上される。BMA では近年において廃棄物関連 の施設整備を行っていないが、2009 年の予算年度に 14.4 百万バーツ(37.4 百万円)が減量化及び再利用 関連の6 プロジェクトに配分されている。i 表6 に 2011 年時点での一般家庭のごみ料金表を示した。以前の月額料金は 30 バーツであったが減額 され 20 バーツとなった。特別料金は区役所に収集依頼を行うもので、1m3 のごみ量1回についての料 金は150 バーツに設定されている。
表6 BMA 一般家庭ごみ料金表(2011 年現在) 1. 月額料金 1.1 一日の排出量が20 リッター以下 20 バーツ/月 1.2 一日の排出量が20-500 リッターまで 40 バーツ/月(20 リッター毎に 40 バーツ加算) 1.3 一日の排出量が 500 リッターから 1m3 まで 2,000 バーツ/月 1.4 一日の排出量が1m3 以上 2,000 バーツ/月(1m3 毎に 2,000 バーツ加算) 2. 特別収集 2.1 1m3 以下 一回につき150 バーツ 2.1 1m3 以上 一回につき150 バーツ(1m3 毎に加算)
資料:パワーポイントプレゼンテーション2010、Mr.Thongchai Bitrakul, Director, Solid Waste, Hazardous Waste and Night Soil Management Division, Department of Environment, BMA
5.2 廃棄物管理の問題点及び課題 バンコク市の廃棄物管理の最大の問題点はマスタープランが無いままに廃棄物行政、公共サービスが 実施されていることである。BMA は環境に関する記述の上位計画を基に廃棄物管理を実施しているが、 短期‐長期展望を踏まえたアクションプランの策定・承認・実施が今後の廃棄物管理サービスの適性化 の為に必要事項となっている。次項に各々の廃棄物管理活動に関す課題を述べる。 5.2.1 排出、清掃、収集 ごみの排出は一般廃棄物に関しては混合ごみであり、資源ごみ回収の観点からは問題を抱えている。 学校、ホテル、百貨店、コンビニなどの一部で分別による資源回収が行われているが、全市的な活動に は至っていない。収集は、家庭系並びに事業系の一般廃棄物は混合ごみの収集、有害性廃棄物及び感染 性廃棄物の分別収集を実施しており、収集に関しては概ね適正な収集システムが構築されている。排出 から収集における問題点を勘案すると、下記事項が今後の課題となる。 14 の施設で実施している分別収集を他の施設に拡大、 家庭系・事業系一般廃棄物の分別教育の実施並びに分別収集実践 収集車両リース契約の評価及びさらなる経費削減 5.2.2 減量化・再資源化 減量化、再利用、再資源化の3R の活動は特定の 14 の施設・場所で実践されているが、全市的なレベル での活動には至っていない。従って、住民、社会、行政の各々が 3R 活動を担う構図とするにはいくつ かの課題がある。その課題は、行政側、受益者及びリサイクル産業の3 者に存在する。主要な課題を整 理すると、下記の事項が挙げられる。 3R 活動目標値・時間軸の設定 3R 活動の必要性に対する教育・キャンペーンの実施 資源ごみ回収を担う個人、企業とBMA の連携、協力、支援 再資源化工場とBMA の連携、協力、支援 5.2.3 中間処理 On Nut に設置されている日量 1,000 トンのコンポスト施設は BMA が実施する中間処理の唯一のもので
あるが、稼働が中止となることが多い。学校、コミュニティーレベル等では有機性廃棄物のコンポスト 化、バイオガス化が区役所の指導で実施されており、全市的な活動への展開が望まれる。これらコンポ スト化、バイオガス化を含めた中間処理に関する課題を次に示す。 異物を含まない生物分解性廃棄物の分別、収集システムの構築、 学校、コミュニティー等のコンポスト化、バイオガス化活動の拡大、 On Nut コンポスト施設のコンポスト製造歩留まり(30%)の改善、 On Nut の Wrapping 施設(生ごみのプラスチック包装)の有効性検証 Waste to Energy 施設(焼却・バイオガス化・発電)の導入 5.2.4 運搬・最終処分 バンコク市は市域内に処分場を保有しておらず、最終処分は民間委託による隣接県での埋立処分をして おり、廃棄物処分の原則である自己域内処分の考え方を実践できていない。すなわちNIMBY(Not in my backyard)である。今後の社会情勢の変化に対応することも踏まえ、運搬・最終処分の課題は次に示す 事項が挙げられる。 中継施設作業状況の改善(完成している近代的中継施設‐Nong Kaem の稼働開始) 入札、契約、事業運営の透明性確保 埋立作業の改善、モニタリングの強化 海岸埋め立てを含む市域内の埋立用地選定調査、計画、整備 5.2.5 廃棄物管理予算 2010 年において、収集、処理、処分を合わせたトン当たり単価は 962 バーツ(約 2,500 円)であった。 BMA の廃棄物管理における上述の課題を克服するには経費増加が必定となる。廃棄物管理の財政強化 を行うためには次の課題が挙げられる。 現在の活動の有効性及び効率性の検証、 ごみ料金収入の増加(徴収率及びごみ料金) 廃棄物管理会計の実施 施設整備費の確保 6. 国際協力の動向及び課題 現時点で BMA は廃棄物管理に関して国際協力によるプログラムまたはプロジェクトを実施していない。 JICA は過去に 2 回の技術援助により 1982 年及び 1991 年に廃棄物管理マスタープランを策定、提出した が、その計画が BMA のマスタープランとして承認、実施されていない経緯がある。その主な理由とし ては、1980 年代においてはバンコク市には財政的な余裕がなかったことがあり、1990 年代においては水 質汚濁改善のために下水道整備を優先的に行う必要があったことによる。また、JICA は技術援助の他に 専門家派遣、集団研修及び個別研修による研修生受け入れを実施しBMA の廃棄物行政を継続的に支援 している。 日本以外の他国、国際機関の BMA の廃棄物管理に対する実質的な国際協力が実施されて いないのが現状である。今後、BMA が廃棄物管理の近代化を推進するに当たり、国際協力の受入れの 主要課題としては次の事項が挙げられる。 担当部局としてのみならずBMA の施策実施の為の国際協力 実践的技術レベルの習得(計画、設計、工事監理)
廃棄物管理事業運営の習得(事業会計) Good Practice によるプロジェクト実施(3R 活動) 7. ベンチマーク・データ ① サービス受益人口及び全人口に対する サービス受益人口の占める割合(%) 受益人口‐2010 年:5.7 百万人‐登録人口(未登録人口 も含めると9 百万人以上の推計)、収集対象人口:100% ② 年間の都市廃棄物収集量(トン/年) 3.25 百万トン‐2010 年 ③ 代表的なごみ組成 廃棄物の分類 2000 平均 2000-2009 2009 コンポスト化可能ごみ 60.41 52.59 50.1 厨芥 46.88 41.11 44.43 草木 6.77 6.81 5.67 その他 6.76 4.67 0 再資源化可能ごみ 6.38 10.01 10.29 再資源化可能紙類 0 1.17 1.19 再資源化可能プラスチッ ク類 1.73 3.18 3.25 発泡スチロール 0.59 1.17 1.44 ガラス 2.57 2.82 2.7 金属 1.49 1.66 1.71 直接処分ごみ 33.21 37.42 39.7 再資源化不可紙類 8.66 9.89 10.7 再資源化不可プラスチッ ク類 17.15 19.45 19.18 皮革・ゴム類 0.11 1.06 1.95 衣服・繊維類 6.43 5.38 5.52 石・陶器類 0.51 0.63 0.81 骨・貝類 0.35 1.01 1.54 合計 100 100 100
資料:Bangkok State of Environment 2008-2009、
http://203.155.220.239/public_files/news/cms_detail/0143137.pdf, 2011.09.10 代表的なごみ組成
資料: Waste ④ 平均ご ⑤ 排出総 ⑥ 焼却処 焼却量 ⑦ その他 る比率 ⑧ インフ クル率 参考文献 1. 2. 3. 4. :パワーポイ and Night So ごみ収集率(% 総量に対する 処理の有無及 量(率) 他の中間処理 率 フォーマル・ 率 Implemen パワーポイ Hazardou BMA Bangkok, BMA Adm イントプレゼ oil Manageme %) る最終処分率 及び排出総量 理量の発生総 セクターに ntation Plan イントプレゼ us Waste an , State of En ministration ゼンテーショ ent Division, 率(%) 量に対する 総量に対す によるリサイ n 2555 (AD ゼンテーショ nd Night So nvironment n Plan 2552 ン、Mr.Tho Department ごみ収集 散乱ごみが 2010 年の 施設での処 の推計値、 と、8,900 処分率が算 ては12% 焼却は感染 るが、一般 学校、コ 化、バイオ 記録は整理 民間によ 計されてい 2009), BMA ョン2010、M oil Managem t 2008-2009 2-2555(2009 ngchai Bitrak of Environm 区域は全区域 が5%程度と の日平均収集 処理1,000 ト 、堆肥化不適 0-1000+700) 算定できる。 %となる。 染性医療廃棄 般廃棄物は焼 ミュニティー オガス化が試 理できていな る資源回収は いる。 A Mr.Thongcha ment Divisio 9 9-2012) kul, Director ment, BMA 域を対象とし と推計されて ごみ量8,900 トン/日、資源 適物が700 ト /(8,900+ 。従って、W 棄物を 18- 焼却していな ー等での有機 試験的に試み ない。 は排出(収集 ai Bitrakul, on, Departm r, Solid Wast しているが、 ている。 0 トンに対し 源ごみ回収率 トン/日から算 +890)=88% Waste Diversio 20 トン/日 ない。 従っ 機性廃棄物の みられている 集)ごみ量の Director, S ment of Env te, Hazardou 自己処理、 しコンポスト 率が10%程度 算式を求める %として最終 on Ratio とし 日処理してい って0%。 のコンポスト るが処理量の の約10%と推 olid Waste, vironment, s ト 度 る 終 し い ト の 推
5. BMA Development Plan 2552-2563(2009-2020) 6. BMA Action Plan 2552-2555 (2009-2012)
Solid Waste Management in Metro Manila, Philippines: Status and Challenges Vella ATIENZA
Environment and Natural Resource Studies Group, Inter-Disciplinary Studies Center, Institute of Developing Economies- Japan External Trade Organization (IDE-JETRO),
3-2-2 Wakaba, Mihama-ku, Chiba-shi, Chiba, 261-8545 Japan; Tel: +81-43-299-9603; Fax: +81-43-299-9000; Email: [email protected]; [email protected]
Abstract
Like other mega-cities, Metro Manila (MM), has also been facing various challenges on how to address the gargantuan problems on waste in the past decades. The growing population, industrialization, and urbanization contribute to the increasing generation of waste. MM has the smallest land area among all the regions representing only 0.21% (636 km2) of the country’s total land area (299,764 km2) (MMDA, 2007; Lapid, 2007); but it is the second most populous region with 11.5 million inhabitants which is about 13% of the country’s population of 88.57 million (MMDA, 2007; NSO, 2011).
Based on the estimated national solid waste generation data from 2000-2010, MM generates about 4,953 tons per day (2000) and 6,844 tons per day (2010) which is about a quarter of the country’s generation of waste (NSWMC, 2005). However, the study on the composition and sources of waste in MM shows that about 90% of wastes generated are biodegradables and recyclables; and that 74.14% of the MM’s waste comes from households and 16.9% comes from commercial establishments (MMDA, 2007). This reveals that if only households and commercial establishments will segregate waste properly and practice recycling, only very little amount of waste needs to be dumped in disposal sites. This approach will not only address the environmental and health problems due to improper waste disposal, but it will also contribute to alleviate poverty especially in the urban cities. It was reported that there are about 4,000 individuals in MM who are depending on scavenging, buying and selling waste for survival (DENR/ADB, 2003 as cited in Atienza, 2009).
In this paper, the author will provide a review of the current status of solid waste management (SWM) in MM, some benchmark information, the recent programs and initiatives, and the challenges towards effective implementation of SWM in the city.
Introduction
The rise of mega-cities‡ since the Second World War has contributed to the growing problems of waste.In the early 1960s, only about 20% of the populations of the developing countries lived in cities (Rapten, 1998). At that time, there were only four cities in Asia (Tokyo, Shanghai, Beijing, and Osaka) which had populations of more than 5 million. Metro Manila, the capital city of the Philippines, with less than 3 million peopleat that time was
not even included among the thirty biggest cities in the world (Laquian, 2005). By 2001, the number of mega cities had increased to eighteen and twelve of these were in Asia, including Metro Manila. This growing concentration of population in large cities is mainly due to the continuous migration of people from rural to urban areas in search for better opportunities and for other sources of livelihood. As most of the economic activities are concentrated in urban areas, this has attracted many rural dwellers to migrate to the cities.
Urbanization has brought about an alarming growth in the occurrence of poverty in urban areas (Badshah, 1996). This tremendous increase in the urban population over the years has resulted in extreme conditions in the city. While it can be considered the center of industrialization and economic growth, it is also a place where severe poverty and poor sanitation are prevalent. Due to the great demand in cities, many national governments have not been able to provide for the basic needs of the people, such as enough dwellings, food and water, and a clean environment. Another concern in most mega-cities is the increasing volume of solid waste generated per day, brought about by modernization and urbanization. Due to limited resources, particularly in most developing countries, the government has usually failed to provide basic services to the community especially, the proper collection and disposal of waste in the city. Oftentimes, only waste from the commercial establishments and the residences of the middle class who are capable of paying for waste services are collected regularly. Thus, piles of garbage from the rest of the city, especially the slums and inner city areas, are left uncollected and are being dumped illegally in already congested and polluted places.
The occurrence of various tragedies in the past years highlights this poor condition in most urban areas and the hazards brought about by improper waste management. For example, the Payatas tragedy in 2000 which killed about 200 people mostly scavengers when the heavy rains caused a landslide on the former Payatas open dumpsite. In 2009, the destructive Typhoon Ondoy also hit Metro Manila wherein it caused many lives, affected thousands of people and damaged millions of pesos worth of properties and infrastructures. Two years after that disaster, another Typhoon Pedring also brought severe damage in the region just recently. It is believed that rampant garbage damping that clogs creeks and esteros is one of the reasons for causing heavy floods during typhoons especially in urban areas like Metro Manila.
Given this condition in urban city and the challenges it poses on how to improve the condition in the city particularly on waste management, this paper will focus on the experience of Metro Manila, Philippines experience. The first part presents the background of the city, its features and the problems on waste management. The second part reviews the solid waste management system including the laws, institutions and organizations involved and the partners both local and international. It also provides the important facts on solid waste generation and the activities conducted by the city from collection to final disposal. The third part provides the status of compliance to RA 9003 by cities and municipality in Metro Manila. The next part presents the recent initiatives towards sound waste management based on the experiences of selected LGUs, NGOs, community based programs, and activities by the business sector. It also provides the updates on the recent programs by the Philippine government to integrate the informal sector in the waste management system and improve their
condition. Based on the previous discussion, the last part is the concluding remarks and some challenges on how to replicate good practices and to improve the waste management system in the NCR.
1. Metro Manila: Background and the Problems on Waste
Background of the City
Metro Manila (MM), or the National Capital Region (NCR) of the Philippines, is the 19th largest city in the world and it is projected to be the 15thlargest in 2015. It is composed of 16 cities and 1 municipality. Its adjacent provinces are Bulacan, Rizal, Laguna and Cavite (MMDA, 2007). Metro Manila is the country’s premier urban center and has made this region the political, administrative, commercial and industrial center of the country (Nemoto et al. 2001).
Special Features
The NCR has the smallest land area among all the regions in the Philippines representing only 0.21% (636 km2) of the country’s total land area (299,764 km2) (MMDA, 2007; Lapid, 2007). However in terms of population, it is the second most populous region in the country with 11.5 million inhabitants which is about 13% of the country’s population of 88.57 million (MMDA, 2007; NSO. 2011). As of 2010, MMDA reported that MM already reached 12.3 million population with an average household size of 4.62 and 2.7 million households (Ayala Foundation USA, 2010).
The Problems on Waste Management
For the past decades, just like other mega-cities, Metro Manila has also been facing various challenges on how to address the gargantuan problems on waste and its hazardous effects on the environment and human health. Although several policies have been implemented in the past, still solid waste management continues to be one of the pressing environmental problems in the region. The increasing population, industrialization, urbanization and modern living contribute in the increasing generation of solid waste. Of the 6,720 tons of waste generated each day in Metro Manila, only 1% is collected by MMDA, 13% by the LGUs, and the remaining 86% by private contractors. Thus, Metro Manila spent more than PhP3.54 billion annually for waste collection and disposal. Its LGUs spend between 5%-24% of their annual budgets on solid waste management and the largest percentage of this amount goes to the private hauling services (DENR/ADB, 2003).
Table 1. Estimated Solid Waste Generated in the Philippines
Region
2000 2005 2010
Tons/day % Tons/day % Tons/day %
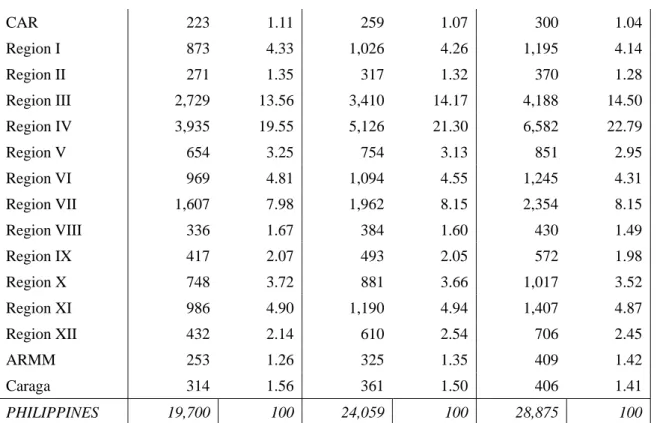
CAR 223 1.11 259 1.07 300 1.04 Region I 873 4.33 1,026 4.26 1,195 4.14 Region II 271 1.35 317 1.32 370 1.28 Region III 2,729 13.56 3,410 14.17 4,188 14.50 Region IV 3,935 19.55 5,126 21.30 6,582 22.79 Region V 654 3.25 754 3.13 851 2.95 Region VI 969 4.81 1,094 4.55 1,245 4.31 Region VII 1,607 7.98 1,962 8.15 2,354 8.15 Region VIII 336 1.67 384 1.60 430 1.49 Region IX 417 2.07 493 2.05 572 1.98 Region X 748 3.72 881 3.66 1,017 3.52 Region XI 986 4.90 1,190 4.94 1,407 4.87 Region XII 432 2.14 610 2.54 706 2.45 ARMM 253 1.26 325 1.35 409 1.42 Caraga 314 1.56 361 1.50 406 1.41 PHILIPPINES 19,700 100 24,059 100 28,875 100
Source: National Solid Waste Status Report, December 2004; National Solid Waste Management Framework, Pre-final Draft, March 2005 as cited in NSWMC 2005, “Technical Guidelines on Solid Waste Disposal Design and Operation.”
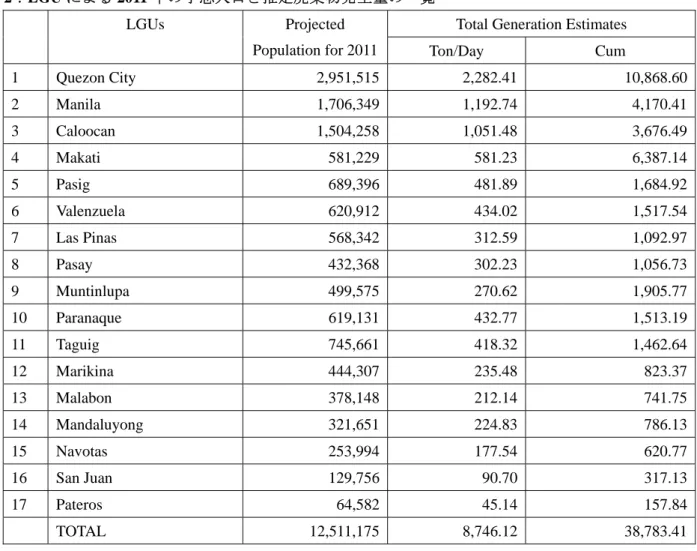
Based on the estimated national solid waste generation data from 2000-2010, MM generates about 4,953 tons per day (2000) and 6,844 tons per day (2010) which is about a quarter of the country’s generation of waste (Table 1) (NSWMC, 2005). MMDA also reveals that based on the LGU’s projected population and waste generation estimates for 2011, MM generates 8, 746 tons per day, the highest among the regions in the country (MMDA, 2011a).
Table 2. Summary of LGU’s Projected Population and Waste Generation Estimates for 2011
LGUs Projected
Population for 2011
Total Generation Estimates
Ton/Day Cu.m 1 Quezon City 2,951,515 2,282.41 10,868.60 2 Manila 1,706,349 1,192.74 4,170.41 3 Caloocan 1,504,258 1,051.48 3,676.49 4 Makati 581,229 581.23 6,387.14 5 Pasig 689,396 481.89 1,684.92 6 Valenzuela 620,912 434.02 1,517.54 7 Las Pinas 568,342 312.59 1,092.97 8 Pasay 432,368 302.23 1,056.73 9 Muntinlupa 499,575 270.62 1,905.77
10 Paranaque 619,131 432.77 1,513.19 11 Taguig 745,661 418.32 1,462.64 12 Marikina 444,307 235.48 823.37 13 Malabon 378,148 212.14 741.75 14 Mandaluyong 321,651 224.83 786.13 15 Navotas 253,994 177.54 620.77 16 San Juan 129,756 90.70 317.13 17 Pateros 64,582 45.14 157.84 TOTAL 12,511,175 8,746.12 38,783.41
Source: MMDA. 2011a
Notes: Population based on the National Statistics Office (NSO) data for 2007 Population (Census reference date was August 1, 2007); Generation per capita is projected from the baseline study of MMDA and 1999 JICA’ Study on Solid Waste Management for Metro Manila..
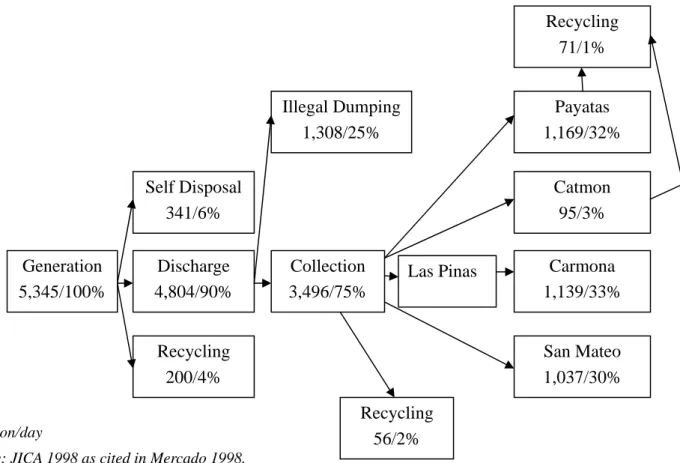
Figure 1 shows that out of 5, 345 tons/day waste generation only 75% are collected and the remaining 25% are dumped illegally (JICA, 1998 as cited by Mercado, 1998). A lack of awareness and technical knowledge about proper waste management, inadequate facilities and infrastructure to support waste management activities, a lack of political will among leaders, weak implementation of policies, and application of inappropriate technologies are common constraints on the effective implementation of solid waste management in many developing countries.
Generation
5,345/100%
Self Disposal
341/6%
Discharge
4,804/90%
Recycling
200/4%
Illegal Dumping
1,308/25%
Collection
3,496/75%
Las Pinas
Recycling
71/1%
Payatas
1,169/32%
Catmon
95/3%
Carmona
1,139/33%
San Mateo
1,037/30%
Recycling
56/2%
Unit: ton/day
Source: JICA 1998 as cited in Mercado 1998.
Figure1. Waste Flow in Metro Manila
The absence of clear national guidelines on waste management in the past have resulted in improper waste disposal practices such as the open dumps, and open or curbside street piles which cause environmental and health hazards to the community. The severity of the negative impacts of these practices and the lack of a strategic approach in addressing the solid waste management problems were highlighted in the premature closure of the Carmona and San Mateo landfills in 1998 and 2005 respectively due to environmental and social considerations, and the Payatas dumpsite tragedy in 2001 in which 200 people were killed in a landslide (World Bank, 2001). Table 3 presents the impact and threats brought about by dumpsites and landfills in Metro Manila.
As shown in Figure 1, most of the MM’s waste was being dumped in these disposal sites, thus the closure of these disposal sites significantly affected the waste management system in the region. It was also observed that after the closure of the Payatas open dumpsite, there was an increase in crime rates in the area. This could be attributed to a lost or lack of livelihood opportunities that caused them to resort to illegal means to survive (Personal Interview with Luis Sabatera, 25 August 2009).There are about 4,000 scavengers and waste pickers in the area who are also dependent on this waste for their survival (DENR/ADB, 2003).
Table 3. Impact of Dumpsites in Metro Manila
Dumpsite Impacts and Threats Payatas Dumpsite, Quezon City Opened in 1973 22 hectares Solid waste: 2,200 tons/day
For the past 30 years, the solid-waste dump has most likely been releasing leachates into the ground water and river systems, an amount currently estimated at 2 liters/ second or 63 million liters each year.
Garbage landslide occurred in July 2000, killing more than 200 residents.
Catmon, Malabon Opened in 1986 5 hectares
Solid waste: 210 tons/day
Located in a dense residential area prone to flooding, the site has most likely been generating leachate for the past 17 years with unknown consequences.
Lupang Arenda, Taytay Opened in 1995
40 hectares, expandable to 170
Solid waste: amount unknown
Illegal dumpsite located on the north shore of Laguna Lake. Waste used as fill to raise the surface above flood elevation. Housing
resettlement for 25,000 households on dumps. Acute public health and environmental threats.
Rodriguez Landfill, Rodriguez Opened in 2002 14 hectares Solid waste: 1,200 tons/day
Each year, this facility generates over 63 million liters of leachate, enough to fill more than 28 Olympic-size swimming pools, the bulk of which flows into Marikina River system.
Along with Payatas, it generates an estimated 26kg of lead and 76kg of arsenic annually.
Tanza, Navotas Landfill Opened in 2002
11 hectares, expandable to 100
Solid waste: 800 tons/day
Constructed on former fishpond and surrounded by floods.
Risks seriously contaminating nearby fish and shrimp ponds, a major food resource for Metro Manila.
Source: Lapid(2007). “National Reports: Philippines,”in Environmental Management Centre, Mumbai, India, eds. Solid Waste Management: Issues and Challenges in Asia.
2. Review of the Metro Manila Solid Waste Management System
The Implementation of the Philippines Republic Act 9003 (RA 9003)
In response to the critical condition of solid waste management problem and the threat it poses to the environment and human health if it remains unsolved, the Philippines’ Republic Act 9003 (RA 9003), also known as the Ecological Solid Waste Management Act of 2000 came into force on January 26, 2001. Unlike previous environmental policies that used a piecemeal approach, it takes a holistic approach to the problems of solid waste management. It is considered the most comprehensive law on solid waste management that has been implemented in the country. It declares the intention of the state to adopt a systematic, comprehensive and ecological solid waste management program that will ensure the protection of public health and environment (Republic of the Philippines, RA 9003, Article 1, Section 2).
Institution and Implementing Organization of Solid Waste Management in the City
In support to the effective implementation of RA 9003, the National Solid Waste Management Commission (NSWMC) was created under the Office of the President, primarily to prescribe policies to attain the objectives of the Act and to oversee the overall implementation of the solid waste management programs. The NSWMC is chaired by the Secretary of Department of Environment and Natural Resources (DENR) with members from 14 government sectors and three members from the private sector including from the non-government organizations (NGOs), the recycling industry, and from the manufacturing and packaging industries (Republic of the Philippines, RA 9003).
Pursuant to the Philippine Local Government Code, it is mandated in RA 9003 that the LGUs will be the primary responsible units in the implementation of the Act (Section 10). They are given the task of establishing
provincial an plan for thei allows anyon against gover Source: A Alt private secto Management recycling ind Source: Agui
Nati
Manag
(P
L
nd city/munic ir community ne to file a c rnment offici Aguinaldo 20 though the LG or and the co t Board in ev dustry, and ma inaldo 2010.P
SW
ional Solid
gement Com
Policy Maki
Local Gover
Units
(Implement
cipal solid w y (Sections 1 civil, crimina ials who viola010. Philippin
GUs are the p ommunity is very province anufacturing
Provincal
WM Board
Waste
mmission
ing)
rnment
s
tation)
E
waste managem 1, 12, and 16 al or adminis ate or fail to c ne Solid Wast Figure 2 primary respo also encoura e, city or mu or packagingCity/M
SWM
Ecological
Managem
ment boards 6). To encou strative action comply with t te Manageme 2. Institution onsible in the aged (Section unicipality sh g industries (Sunicipal
Board
Solid Waste
ment Act
and preparin urage greater n against any the law (Sectent Program: al Structure e implementat n 5q). Thus, i hould have a Sections 11, 1
Baran
SW
Comm
Waste Ge
DENR-E
(Techn
and E
e
ng a 10-year participation y individual, tion 52). RA 9003 Sta tion of the Ac it also manda representativ 12).ngay
M
mittee
enerators/Ci
EMB-NSW
nical Suppo
Enforcemen
solid waste m n by the citiz institution o atus of Implem ct, the partici ates that the ve from the Nitizens
WMC
ort
nt)
management zens, the Act or agency, ormentation.
pation of the Solid Waste NGO sector,
Figure 3. Institutional Mechanism (Local Level)
In the case of Metro Manila, the Metro Manila Solid Waste Management Board acts as the provincial SWM board composed of all Mayors in MM, four private sectors and the Metro Manila Development Authority (MMDA) as the chairman. The MMDA was created in 1995 with the passing of the Philippines Republic Act 7924.§ The Act declares the policy of the state “to treat Metro Manila as a special development and administrative region and certain basic services affecting or involving Metro Manila as metro-wide services more efficiently and effectively planned, supervised and coordinated by a development authority as created therein, without prejudice to the autonomy of the affected local government units” (Republic of the Philippines, RA 7924).
Laws on Waste Collection, Treatment and Disposal
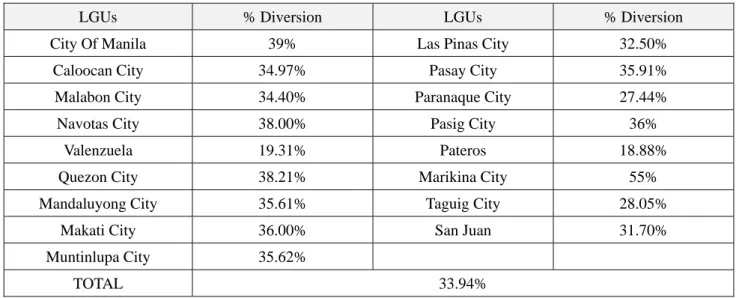
As mandated by RA 9003, the LGUs should divert 25% of their generated waste within five years (2006) after the implementation of the Act through composting, re-use and recycling activities. It further states that the reduction should be increased every three years (Section 20). It also promotes the implementation of the segregation of solid waste at source (Section 21) and the creation of the material recovery facility (MRF) in every barangay or cluster of barangays (Section 32). The Act also states that the collection, segregation and recycling of biodegradable, recyclable, compostable and reusable wastes is the responsibility of the barangays. On the other hand, the collection of residual and special wastes is the responsibility of the municipalities and cities, except in Metro Manila where disposal is within the mandate of the MMDA (Section 10).
RA 9003 also prohibits the operation and establishment of open dumpsites upon the coming into force of the Act. It further states that all open dumpsites should be converted into controlled dumpsites after three years (2004), and that all controlled dumpsites should be closed within five years (2006) of the implementation of the Act (Section 37). As an alternative, the construction of sanitary landfill (SLF) is allowed as a final disposal site for residual wastes but it should be in accordance to the criteria provided by the Act (Sections 40, 41, and 42).
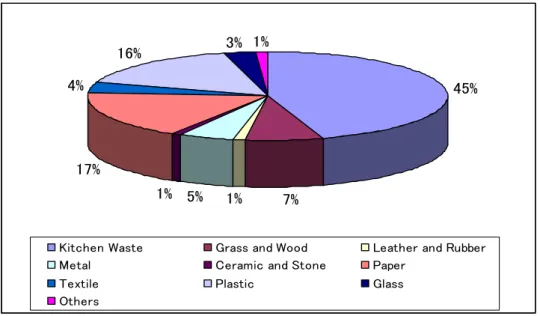
Composition and Sources of Waste in Metro Manila
Based on the composition and sources of waste in MM, it shows that about 90% of wastes generated are biodegradables and recyclables (Figure 4). Also, study shows that 74.14% of the MM’s waste comes from households and 16.9% comes from commercial establishments (Figure 5) (MMDA, 2007). This reveals that if only households and commercial establishments will segregate waste properly and practice recycling as mandated by RA 9003, only very little amount of waste needs to be dumped in disposal sites. This would be because kitchen waste can be turned into compost and the recyclables can be stored in the barangay’s MRF for marketing or can be
§RA 7924 is “An Act Creating the Metro Manila Development Authority, Defining Its Powers and Functions, Providing Funding Therefor and for Other Purposes.”
used as raw materials in the production of recyclable products.
Source: MMDA. 2007. Door-to-Door Garbage Collection in Metro Manila.
Figure4. Waste Composition in Metro Manila
Source: Ibid.
Figure 5. Sources of Waste in Metro Manila
In this way, it would not only reduce the volume of waste to be dumped in disposal sites but it would also save a large amount of money in the hauling services and at the same time would create an additional source of income for the barangays and communities as well. But the next question is how to implement waste segregation at source and how to promote recycling given the various considerations such as the political, social, financial, and
45% 7% 1% 5% 1% 17% 4% 16% 3% 1%
Kitchen Waste Grass and Wood Leather and Rubber Metal Ceramic and Stone Paper
Textile Plastic Glass
Others