Stability of amorphous Ta-O nanotubes prepared
by anodization : thermal and structural
analyses
著者
Nakamura R., Asano K., Ishimaru M., Sato K.,
Takahashi M., Numakura H.
journal or
publication title
Journal of Materials Research
volume
29
number
6
page range
753-760
year
2014-03-31
権利
Copyright (C) Materials Research Society 2014
Published online: 31 March 2014
URL
http://hdl.handle.net/10466/15021
1
Stability of amorphous Ta-O nanotubes prepared by anodization: thermal and
structural analyses
R. Nakamuraa,*, K. Asanob, M. Ishimaruc, K. Satod, M. Takahashia, H. Numakuraa
aDepartment of Materials Science, Graduate School of Engineering, Osaka Prefecture University,
Gakuen-cho 1-1, Naka-ku, Sakai 599-8531, Japan
b
National Institute of Advanced Industrial Science and Technology (AIST), AIST Central-5, 1-1-1 Higashi, Tsukuba, Ibaraki 305-8565, Japan
c
Department of Materials Science and Engineering, Kyushu Institute of Technology, Tobata, Kitakyushu, Fukuoka 804-8550, Japan
d
Institute for Materials Research, Tohoku University, Katahira 2-1-1, Sendai 980-8577, Japan
Amorphous Ta-O nanotubes (NTs) prepared by anodization in a sulfuric-acid-based solution have been found to contain considerable amounts of extra oxygen and sulfur. Their structural and thermal stability has been studied by combining X-ray diffractometry, transmission electron microscopy, and thermal analysis. The amorphous Ta-O, whose composition was estimated to be Ta2O6.6S0.7,
crystallizes into orthorhombic β-Ta2O5 at temperatures around 1073 K by an endothermic reaction, at
which excess oxygen and impurity sulfur are released. The amorphous NTs were found to be thermally more stable than stoichiometric amorphous Ta2O5, whose crystallization temperature is around 973 K.
Excess oxygen and impurity sulfur, which form chemical bonds with Ta atoms in the amorphous solid, must be the origin of the stability. The crystallization follows the out-diffusion of oxygen and sulfur from the solid at temperatures where the mobility of atoms is high enough, indicating that the crystallization is kinetically arrested.
2
1. Introduction
Nanoporous oxides have attracted much attention as potentially useful materials for ion exchange, molecular separation, catalysis, chromatography, and energy storage, as the large surface-to-volume ratio is expected to improve performance pertinent to these characteristics [1,2]. Fabrication of highly ordered, self-organized nanoporous oxides has stimulated substantial research, since Masuda et al. [3] reported hexagonally ordered porous alumina structures on Al surface in acidic solutions. Nowadays, electrochemical anodization is recognized as a useful technique to obtain a variety of self-organized nanoporous oxides on the surface of metals such as Ti [4], Nb [5], Zr [6], Hf [7], W [8], and Ta [9].
With its wide band gap, of 3.8 to 4.3 eV [10], Ta2O5 is not advantageous for solar
light-harvesting. However, modification with other oxides such as NiO and RuO2 can improve its
photocatalytic ability for water-splitting under UV irradiation [11]. In addition, providing a large surface area is also effective for the same purpose. It has stimulated attempts to render nanoporous structures to Ta2O5. Owing to recent developments in electrochemical anodization processing, it is
now easy to obtain ordered arrays of nanotubes (NTs) [12,13] or free-standing NTs [14,15] of Ta2O5.
The photocatalytic activity of Ta2O5 NTs for hydrogen production from a water/ethanol solution under
UV irradiation has been evaluated [15].
In general, anodized NTs are amorphous and post-annealing is required to obtain crystalline NTs, which are more useful in such applications as photocatalysis. Oxide NTs prepared in fluoride- and sulfide-containing electrolytes often contain fluorine and sulfur as impurities [14,15]. For example, Gonçalves et al.[15] prepared Ta-O NTs in an electrolytic solution of H2SO4 and HF electrolyte and
found the product contained impurity sulfur and more oxygen than the stoichiometric composition, Ta2O5. As reported by Allam and El-Sayed [16], furthermore, dopants and impurities from the
electrolyte change the transition temperature of oxide NTs. Effects of extra atoms (including impurities) on the thermal stability of amorphous NTs are, therefore, worthy of investigation.
The crystallization temperature (Tx) of amorphous Ta-O has been reported by several
researchers. Tx of Ta2O5 thin films prepared by sputtering a Ta2O5 crystalline target is above 973 K
[17]. On the other hand, Tx for anodized Ta-O depends on the preparation condition. For amorphous
NT arrays on a tantalum substrate prepared in H2SO4 + HF including some additives such as H3PO4,
ethylene glycol, or dimethyl sulfoxide, it is in the range of 573-823 K [12,13]. For free-standing NTs prepared in a H2SO4-based electrolyte including a smaller amount of HF, on the other hand, it is above
3
1023 K [14,15]. The large discrepancy in Tc suggests that possibly external effects from a substrate
may blind internal factors on thermal stability such as the effects of extra atoms included in amorphous NTs. To study the origin of the thermal stability of anodized NTs, therefore, free-standing NTs are convenient to use, because they are free from substrates. The roles of the extra atoms will be clarified by comparing the crystallization behavior of between free-standing NTs and impurity-free amorphous Ta2O5 prepared by sputtering.
For this purpose, a combination of thermal analysis and structural analysis techniques was used in this work in order to quantitatively analyze thermal events caused by structural change and/or reaction. Furthermore, analysis of the atomic structure in terms of radial distribution function (RDF) by transmission electron microscopy (TEM), using nano-sized electron beam, was performed because it provides the information on chemical bonds of the amorphous solid with excess atoms [18,19]. Based on these analyses, we discussed the thermal stability of amorphous Ta-O NTs, focusing on the chemical bonds formed by extra atoms.
2. Experimental Procedure
Amorphous tantalum oxide NTs were grown by electrochemical anodization of a 0.5mm-thick tantalum sheet (99.9%purity, Nilaco) in a solution of H2SO4 + 1 vol% HF + 4 vol% H2O (98% H2SO4,
48% HF, distilled water) [14,15]. Tantalum and platinum sheets, both in 20×20 mm2, were used as
anode and counter electrode, respectively. They were spot-welded on a tantalum wire of 0.5 mm in diameter and 100 mm in length. Prior to anodization, the tantalum and platinum sheets were degreased by sonication in acetone and ethanol, followed by rinsing with distilled water. The anodization was performed under a constant voltage of 50 V for 1-10 h at room temperature, with the distance between the tantalum and platinum electrodes being maintained at 20 mm. Immediately after anodization, the tantalum sheet, on which an oxide layer was grown, was carefully immersed in distilled water. As reported by Gonçalves et al.[15], the oxide NTs could be removed easily from the tantalum substrate; they were collected in a form of powder after rinsing carefully with distilled water.
Thermal analyses of the powders were performed by thermogravimetry-differential thermal analysis (TG-DTA) and differential scanning calorimetry (DSC) using Rigaku TG8120 and Netzsch DSC404F3, respectively. The former is equipped with a quadrupole mass spectrometer (M-QA100TS, Anelva), which makes it possible to identify desorbed molecules. Measurements were carried out in a stream of argon in the temperature range between 300 and 1300 K with the heating and cooling rates
4
of 3-30 K min−1. Samples of around 20 mg and around 2 mg were subjected to the TG-DTA and DSC measurements, respectively.
The structure and morphology of as-anodized and annealed NTs were examined by X-ray diffractometry (XRD) and transmission electron microscopy (TEM). XRD profiles were measured using a Rigaku RINT 2500V diffractometer with CuKα radiation over a 2θ range from 3º to 100º. The microstructure and composition were examined using a JEOL 3000F TEM and a FEI Titan 80-300 TEM equipped with an energy-dispersive X-ray spectrometer (EDS). To avoid contamination, electron diffraction intensities and EDS specrta were measured at a cryogenic temperature using a cooling holder. For the radial-distribution-function analysis of the amorphous structure, electron diffraction patterns from a single nanotube were recorded on an imaging plate (Eu2+-doped BaFBr). The electron diffraction patterns were analyzed quantitatively using an imaging-plate processor (Digital Micro-Luminography FDL 5000 system, Fuji Film).
3. Results and discussion 3.1. Structure and morphology
Fig. 1 shows XRD profiles of as-anodized samples (a) and those heated up to 1058 K (b) and 1128 K (c) in an argon atmosphere. (The latter two are those used for the TG-DTA measurements (Sec. 3.2), where the heat treatment was given.) The broad maxima around 30º and 54º in the profiles of as-anodized samples and those annealed up to 1058 K (b) (in the lower frame) indicate that they are essentially amorphous. After annealing up to 1128 K (c) (in the upper frame), the amorphous oxide transformed into a crystalline phase. All the peaks, including small ones, are identified as those corresponding to the low temperature phase, orthorhombic β-Ta2O5 [20]; the largest five peaks of them
correspond to 100 (2θ=22.9º), 0111(28.4º), 1111 (36.8º), 200 (46.7º), and 2111 (55.5º). The crystallization behavior is in good agreement with the result by Gonçalves et al.[15] At temperatures below 1058 K, the amorphous structure was virtually maintained, although weak diffraction peaks corresponding to 100, 0111, and 1111 of β-Ta2O5 appeared, as indicated by arrows. It should be noted
that the shape and intensity of the broad diffraction maxima around 30º in a profile (b) clearly differ from those in (a), suggesting that some changes occurred in the amorphous structure during the annealing. Detailed discussion is given in Sec. 3.4 on the basis of radial-distribution-function analyses.
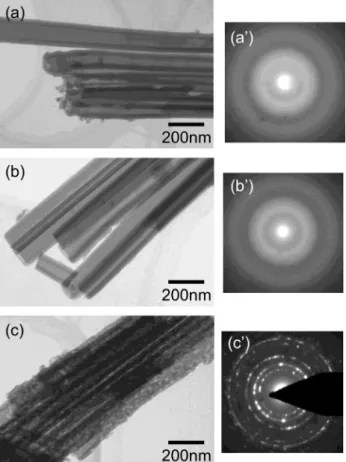
Fig. 2 shows bright-field electron-microscopy images and selected-area electron diffraction patterns of as-anodized samples (a, a’), and those annealed up to 1058 K (b, b’) and 1128 K (c, c’).
5
The as-prepared samples are amorphous and have uniform NT structures with inner and outer diameters of ~80 and ~170 nm, respectively. Samples annealed up to 1128 K (c, c’) fully crystallized into Ta2O5 with nano-sized grains, retaining the NT morphology.
Fig. 3 shows a low-energy portion of characteristic X-ray spectra observed by TEM-EDS. The intensities are normalized to that of Ta Mα at around 1.75 keV. The characteristic X-rays of C and Cu come from contamination and from the grid, respectively. The S Kα peak was observed in (a) and (b), but not in (c). The intensity of S Kα peak is almost unchanged from (a) to (b), i.e., by annealing up to 1058 K. It is also the case for the O Kα peak. After annealing up to 1128 K (c), S Kα peak disappeared and the intensity of O Kα peak decreased, indicating that impurity sulfur and excess oxygen were released on crystallization. The presence and release of impurity sulfur and excess oxygen were also reported by Gonçalves et al. [15]. Fig. 4 shows intensity line-profiles of the characteristic X-rays of Ta, O, and S obtained across a single nanotube in (a) an as-anodized sample and (b) a sample annealed up to 1058 K. The position, x=0, corresponds to the center of the nanotube, as shown in the corresponding BFI (a’) to the profile (a). The arrow in (a’) indicates a trace by beam-scanning. The thickness near edges of the nanotubes is too small to detect sufficient X-ray intensity by line-scanning. The intensities of O Kα and S Kα lines normalized to that of Ta Mα except the edges are almost constant. The relative intensities of O Kα and S Kα to that of Ta Mα from an edge area were observed to be comparable to those from an entire nanotube. Therefore, oxygen and sulfur are not concentrated near the surfaces of a nanotube but distributed homogeneously.
3.2. Thermal analysis
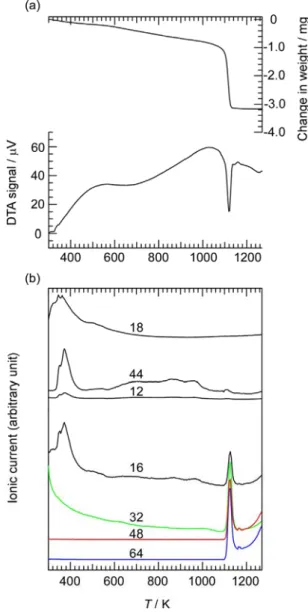
Fig. 5 (a) shows a TG-DTA profile, obtained at a heating rate of 10 K min-1 in a stream of argon,
of the amorphous Ta-O NTs. An endothermic peak appears at around 1100 K, where the weight of the sample, 21.7 mg, decreased by 2.2 mg. The simultaneously obtained thermal desorption spectra, shown in Fig. 5 (b), indicate desorption of molecules of specific mass of 16, 32, 48 and 64 in the same temperature range as the endothermic peak. At 3 K min-1, the endothermic peak started at 1058 K and
completed at 1128 K. The anodized samples were subjected to heating in the TG-DTA instrument up to 1058 and 1128 K, respectively, and then furnace-cooled to ambient temperature. The results of XRD and TEM analyses, shown in Figs. 1-4 and 6, were obtained from those samples. The molecular species detected at temperatures around 400 K must be C (12), H2O (18), and CO2 (44), which are all likely
6
NTs contain impurity sulfur and excess oxygen. The molecules detected at the temperature of the endothermic reaction, of specific mass 16, 32, 48 and 64, are most probably related with excess oxygen and sulfur contained in the amorphous NTs, and are identified as O, O2, SO, and SO2, respectively.
Transformation of a metastable amorphous solid to its crystalline counterpart is usually an exothermic reaction. The observed endothermic peak must be due to the removal of the oxygen and sulfur from the amorphous oxide; the loss of the chemical bonding energies associated with these extra constituents was probably larger in magnitude than the lowering of the enthalpy on the crystallization. This point is further discussed in Sec. 3.5.
The enthalpy of the endothermic reaction was estimated from the enclosed area of the peak, obtained by DSC measurement at 5, 10, 20, and 30 K min-1, to be 13.4 ± 0.9 kJ per mol of Ta2O5.
3.3 Composition of anodized amorphous Ta-O
From the results of the thermal and XRD analyses, the endothermic reaction that occurs at around 1073 K must be described as
Ta2O5+xSy (amorphous) → β-Ta2O5 + xO + yS – 13.4 kJ mol-1 (1)
The amounts of extra oxygen, x, and impurity sulfur, y, can be evaluated from the weight reduction before and after the endothermic reaction in the TG measurement and the intensities of characteristic X-rays of sulfur and oxygen measured by EDS. As the specific mass of oxygen, sulfur and Ta2O5, are
16, 32 and 441.8 g mol-1, respectively, x and y satisfy the following relation
16 32 /441.8 / (2)
where md and mc are the total mass of desorbed oxygen and sulfur, and the mass of Ta2O5, respectively.
The molar ratio of sulfur to total oxygen in the amorphous oxide is roughly estimated from the intensities of the characteristic X-rays in the EDS spectra to be 0.11, i.e.,
/ 5 0.11 (3)
7
Eqs. (2) and (3), x and y are calculated to be 1.6 and 0.7, respectively; the composition of the amorphous Ta-O NTs was Ta2O6.6S0.7.
3.4 Pair distribution analysis
As mentioned earlier, the evolution of the broad maxima of the amorphous Ta2O6.6S0.7
(a-Ta2O6.6S0.7) in the XRD profiles (Figs. 1 (a) and (b)) suggests structural changes during annealing. To
characterize them quantitatively, the short-range atomic structures were evaluated in terms of radial distribution functions by analyzing the selected-area electron diffraction patterns taken from a single NT in the electron beam of ~300 nm in diameter. To avoid contamination, electron diffraction intensities were measured at a cryogenic temperature using a cooling holder. From the recorded intensity profiles, reduced interference functions, F(Q), were calculated. Here, Q is the scattering vector defined as Q=4π sinθ/λ, where θ and λ are the scattering angle and the electron wavelength, respectively. The details of distribution function analysis using electron diffraction are described elsewhere [18,19].
The atomic pair distribution function, g(r) of a-Ta2O6.6S0.7, extracted by the Fourier transform
of F(Q), is shown in Fig. 6 (a). For comparison, g(r) of in amorphous Ta2O5 (a-Ta2O5) prepared by
sputtering [21] is shown in Fig. 6 (b). Peaks appear at around 0.19, 0.27-0.28, 0.34 and 0.37 nm. It is known that the truncation of scattering vector (Qmax) in the reciprocal lattice space sometimes leads to
spurious termination ripples, the so-called “ghost” peak, in radial distribution functions [22-24]. We confirmed that the locations of the peaks and shoulders remain unchanged regardless of Qmax,
suggesting that the peaks and shoulders discussed here are not ghost but real ones. These peaks are in good agreement with the bond lengths of Ta-O, O-O, Ta-Ta(1), and Ta-Ta(2), respectively (the number in the parenthesis indicates the shorter and longer distance), in a-Ta2O5 [21,25]. Therefore, the atomic
distribution in a-Ta2O6.6S0.7 prepared via anodization is essentially similar to that in a-Ta2O5. The bars
at the bottom of Fig. 6 (b) indicate the bond-length ranges of Ta-O, O-O, Ta-Ta(1), and Ta-Ta(2) in crystalline β-Ta2O5 (a=0.389 nm, b=4.029 nm, c=0.620 nm [20]). The bond-lengths in its large unit
cell are widely distributed and are located at longer distances than in the amorphous structure. Although the peak intensity for Ta-O, Ta-Ta(1), and Ta-Ta(2) bonds increases slightly by annealing, g(r) of annealed a-Ta2O5 is almost consistent with that of as-deposited a-Ta2O5. This
tendency is true of amorphous transition-metal oxides such as Al2O3 [26], WO3 and Nb2O5 (R.
8
differs clearly from that of the as-anodized one. A notable feature is that the broad peak in g(r) corresponding to Ta-O and Ta-Ta (2) in the as-anodized state becomes sharper by annealing. A considerable amount of sulfur, whose concentration is 7.5 at.%, is contained in the NTs. Thus, sulfur-related configurations such as Ta-S or O-S probably exist. In fact, the distance between Ta and S is known to be around 0.24 nm in the stable phase of tantalum sulfide, TaS2, and in related compounds
[27-29]. In addition, a large amount of excess oxygen may be located at positions deviating from the Ta-O configuration around 0.19 nm; excess oxygen may contribute to the broadening of the Ta-O peak. It is probable, therefore, that the shoulder at 0.24 nm of the as-anodized sample is due to S and Ta-O bonds, and their bond length becomes closer to that of the distribution around 0.19 nm as a result of atomic rearrangements at elevated temperatures. As can be seen in the partial pair distribution function of Ta-O bonds in a-Ta2O5 [25], the correlation corresponding to second nearest Ta-O bonds appears
weakly around 0.38 nm, which is close to the peak position of Ta-Ta(2). In the case of a-Ta2O6.6S0.7
with higher concentration of oxygen than a-Ta2O5, the correlation of second nearest Ta-O bonds is
expected to be stronger and appear near the Ta-Ta(2) peak. The rearrangement of oxygen and sulfur by annealing makes the peak intensity for not only Ta-O but also Ta-Ta(2) increase. This can be interpreted as a unique structural change which occurs owing to excess oxygen and sulfur. Radial distribution analysis revealed that excess oxygen and sulfur are introduced with a variety of bond lengths around Ta cations by the anodization process and then are rearranged by annealing towards a regular amorphous structure.
3.5 Origin of the thermal stability
Amorphous Ta2O5 thin films prepared by sputtering start to crystallize at 973 K and fully
crystallize at 1023 K in 1 h in air [17]. With the same heat treatment, the amorphous structure of the a-Ta2O6.6S0.7 is maintained, as shown in the XRD profiles of Fig. 1; in terms of the crystallization
temperature, a-Ta2O6.6S0.7 NTs are more stable than a-Ta2O5 films. The stabilization is most probably
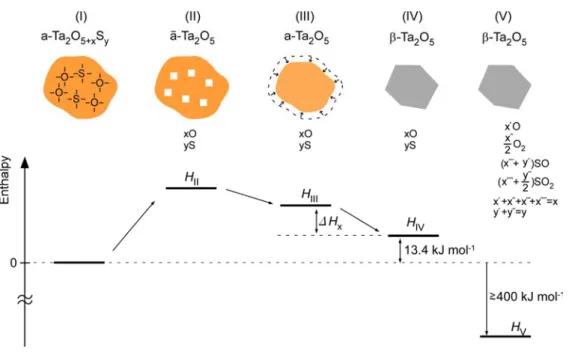
due to the presence of excess oxygen and impurity sulfur introduced in the anodization process. The transformation of the anodically fabricated oxide to the stoichiometric crystalline phase by annealing is schematically illustrated in Fig. 7, including some hypothetical states, with the changes in enthalpy. The oxide contains excess oxygen and impurity sulfur in the as-prepared state (I). By annealing at around 1073 K it releases extra oxygen and sulfur and crystallizes into stoichiometric β-Ta2O5 (IV), whose enthalpy is higher than the initial state by 13.4 kJ mol-1. For convenience, we
9
consider two hypothetical states, II and III, between them. First, the extra oxygen and sulfur are removed from state I (II), and next the volume of the material is reduced, by eliminating the vacancies, to be the same as the ordinary stoichiometric amorphous oxide (III). The enthalpy is raised in state II by the loss of chemical bonds associated with the extra constituents. It is compensated to some extent in III (by elimination of vacancies) and IV (by crystallization), but not fully to the original level, leaving 13.4 kJ mol-1, which was observed in the DSC. The oxygen and sulfur atoms released from
the oxide must form stable molecules such as O2, SO and SO2, as observed by mass spectroscopy, and
leave the sample cell (state V). Since the sum of the heats of formation of those molecules is estimated to be at least 400 kJ mol-1 *, the enthalpy of the final state (V) is far lower than the initial state (I) so that the reaction (1) proceeds inevitably and irreversibly.
The enthalpy difference between a-Ta2O6.6S0.7 and a-Ta2O5, HIII, is due to chemical bonds by
the extra oxygen and impurity sulfur. The difference between HIII and HIV, i.e., crystallization enthalpy,
ΔHx, of a-Ta2O5, is unknown. Here we assume it to be of similar magnitude to the crystallization
enthalpy of other amorphous oxides, TiO2, Nb2O5 and Al2O3, which is is in the range of 17-40 kJ mol -1
[30-32]. With this assumption, the decrease in enthalpy of a-Ta2O5 per an extra atom is estimated to
be 0.16-0.23 eV†, which is a few percent of the bond energy, or the cohesive energy of a-Ta2O5, 5.34
eV [33].
Both the enthalpy and entropy of a-Ta2O5 (state III), which corresponds to a-Ta2O5 prepared by
sputtering, are higher than those of crystalline β-Ta2O5 (state IV), and so is the free energy. For
a-Ta2O5, therefore, the driving force of crystallization, that is, the difference in free energy, must be
negative. In contrast, it turned out that the enthalpy of a-Ta2O6.6S0.7 (I) is 13.4 kJ mol-1 lower than that
of β-Ta2O5 (IV), as discussed above, while the entropy of a-Ta2O6.6S0.7 must be higher than that of
β-Ta2O5. As a result, the free energy of a-Ta2O6.6S0.7 is apparently lower than that of β-Ta2O5 (IV).
However, the free energy of a-Ta2O6.6S0.7 is far higher than that of β-Ta2O5 with desorbed molecules
(V). Therefore, a-Ta2O6.6S0.7 is not thermodynamically stabilized. The desorption of impurity sulfur
and excess oxygen, which occurs simultaneously with the crystallization, rather indicates that the
*
If all the excess O of 1.6 mol form O2 molecules of 0.8 mol, the heat of formation amounts to
– 494 kJ mol 0.8 mol – 400 kJ per mol of Ta O .
†
Decrease in enthalpy (per mol of Ta2O5) per mole extra atoms (1.6 mol of O and 0.7 mol of S) is
∆ 13.4 kJ mol
10
transformation is kinetically limited. For the reaction (1) to proceed, impurity sulfur and excess oxygen are to be released from the amorphous solid, which is possible only at temperatures where atomic mobilities are high enough. At such high temperatures, the extra atoms diffuse out, leaving the composition of the solid closer to stoichiometry, and then crystallization eventually occurs.
4. Summary and conclusions
Thermal stability of amorphous Ta-O NTs prepared by anodization in a sulfuric solution was studied by combining thermal and structural analyses.
Considerable amounts of excess oxygen and impurity sulfur are contained in the amorphous NTs, whose composition was determined to be a-Ta2O6.6S0.7. Radial-distribution-function analysis
revealed a unique structural change which arises from the excess oxygen and sulfur; broad bond-length distribution for Ta-O (around 0.19 nm) and Ta-Ta (around 0.37 nm) of as-anodized a-Ta2O6.6S0.7
sharpens with annealing. Broad distribution of bond length around Ta in the as-anodized a-Ta2O6.6S0.7
is due to chemical bonds formed by excess oxygen and sulfur. The structural change with annealing is caused by the rearrangement of excess oxygen and sulfur.
Amorphous Ta2O6.6S0.7 crystallizes into β-Ta2O5 simultaneously as the impurity sulfur and
excess oxygen desorb at around 1073 K with a positive change in enthalpy of 13.4 kJ mol-1. The observed enthalpy change is attributed to the loss of chemical bonds, Ta-O and Ta-S, under compensated by the lowering of enthalpy due to reduction in volume and crystallization. Amorphous Ta2O6.6S0.7 NTs are more stable than stoichiometric amorphous Ta2O5, which crystallizes around 973
K. The stabilization is of kinetic origin; the crystallization begins to occur only when the out-diffusion of extra oxygen and impurity sulfur become possible.
Acknowledgements
The author (RN) would like to thank Dr. S. Hayashi (AIST) for the measurement of TG-DTA with a mass spectrometer. He also shows his appreciation to Dr. H. Tsuchiya (Osaka University) and Dr. S. Semboshi (Tohoku University) for useful advices on sample preparation and Mr. S. Ueno (Osaka Prefecture University) for supporting preliminary TG-DTA measurements. The TEM observations were carried out at the Comprehensive Analysis Center of Institute of Scientific and Industrial Research, Osaka University. A portion of this study was performed under the inter-university cooperative research program of the IMR, Tohoku University. This work was financially supported by
11 Grant-in-Aid for Young Scientists (B) (No. 24760574).
References
[1]C. T. Kresge, M. E. Leonowicz, W. J. Roth, J. C. Vartuli, and J. S. Beck: Ordered mesoporous molecular sieves synthesized by a liquid-crystal template mechanism, Nature 359,710 (1992) . [2] S. A. Johnson, P. J. Ollivier, and T. E. Mallouk: Ordered mesoporous polymers of tunable pore size from colloidal silica templates, Science 283, 963 (1999).
[3] H. Masuda and K. Fukuda: Ordered metal nanohole arrays made by a two-step replication of honeycomb structures of anodic alumina, Science 268, 1466 (1995).
[4] D. Gong, C.A. Grimes, O.K. Varghese, W. Hu, R.S. Singh, Z. Chen, E.C. Dickey: J. Mater. Res. 16, 3331 (2001).
[5]I. Sieber, H. Hildebrand, A. Friedrich, and P. Schmuki: Formation of self-organized niobium porous oxide on niobium, Electrochem. Comm. 7, 97 (2005).
[6] H. Tsuchiya, J. M. Macak, A. Ghicov, L. Taveira, and P. Schmuki: Self-organized porous TiO2 and
ZrO2 produced by anodization, Corr. Sci. 47, 3324 (2005).
[7] H. Tsuchiya and P. Schmuki: Self-organized high aspect ratio porous hafnium oxide prepared by electrochemical anodization, Electrochem. Comm. 7, 49 (2005).
[8] H. Tsuchiya, J. M. Macak, I. Sieber, L. Taveira, A. Ghicov, K. Sirotna, and P. Schmuki: Self-organized porous WO3 formed in NaF electrolytes, Electrochem. Comm. 7, 295 (2005).
[9]W. Wei, J. M. Macak, and P. Schmuki: High aspect ratio ordered nanoporous Ta2O5 films by
anodization of Ta, Electrochem. Comm. 10, 428 (2008).
[10] I. Paramasivam, H. Jha, N. Liu, and P. Schmuki: Small 8, 3073 (2012).
[11] X. Chen, S. Shen, L. Guo, and S. S. Mao: Semiconductor-based photocatalytic hydrogen generation, Chem. Rev. 110, 6503 (2010).
[12] N. K. Allam, X. J. Feng, and C. A. Grimes: Self-Assembled Fabrication of Vertically Oriented Ta2O5 Nanotube Arrays, and Membranes Thereof, by One-Step Tantalum Anodization, Chem. Mater.
20, 6477 (2008).
[13] X. Feng, T. J. LaTempa, J. I. Basham, G. K. Mor, O. K. Varghese, and C. A. Grimes: Ta3N5
nanotube arrays for visible light water photoelectrolysis, Nano Lett. 10, 948 (2010).
[14] J. E. Barton, C. L. Stender, P. Li, and T. W. Odom: Structural control of anodized tantalum oxide nanotubes, J. Mater. Chem. 19, 4896 (2009).
12
[15] R. V. Gonçalves, P. Migowski, H. Wender, D. Eberhardt, D. E. Weibel, F. v. C. Sonaglio, M. J. M. Zapata, J. Dupont, A. F. Feil, and S. R. Teixeira: : Ta2O5 nanotubes obtained by anodization: Effect of
thermal treatment on the photocatalytic activity for hydrogen production, J Phys. Chem. C 116, 14022 (2012).
[16] N. K. Allam and M. A. El-Sayed: Photoelectrochemical water oxidation characteristics of anodically fabricated TiO2 nanotube arrays: Structural and optical properties, J.Phys. Chem. C 114,
12024 (2010).
[17] R. Nakamura, K. Tanaka, M. Ishimaru, K. Sato, T. J. Konno, and H. Nakajima: Self-elongated growth of nanopores in annealed amorphous Ta2O5 films, Scr. Mater. 66, 182 (2012).
[18] Y. Hirotsu, M. Ishimaru, T. Ohkubo, T. Hanada, and M. Sugiyama: Application of nano-diffraction to local atomic distribution function analysis of amorphous materials, J. Electron Microscopy 50, 435 (2001).
[19] M. Ishimaru: Electron-beam radial distribution analysis of irradiation-induced amorphous SiC, Nucl. Instru. Methods Phys. Res. B, 250, 309-314 (2006).
[20] R. S. Roth, J. L. Waring, and H. S. Parker: Effect of oxide additions on the polymorphism of tantalum pentoxide. IV. The system Ta2O5-Ta2WO8, J. Solid State Chem. 2, 445 (1970).
[21] R. Nakamura, M. Ishimaru, K. Sato, K. Tanaka, H. Nakajima, and T. J. Konno: Formation of highly oriented nanopores via crystallization of amorphous Nb2O5 and Ta2O5, J. Appl. Phys. 114,
124308 (2013).
[22] Y. Waseda, The Structure of Non-Crystalline Materials (McGraw-Hill, International Book Co., NY, 1980).
[23] S. R. Elliott, Physics of Amorphous Materials, 2nd ed. (Longman Scientific & Technical, UK, 1990).
[24] M. Ishimaru, Y. Zhang, and W. J. Weber: Ion-beam-induced chemical disorder in GaN, J. Appl. Phys. 106, 053513 (2009).
[25] R. Bassiri, K. B. Borisenko, D. J. H. Cockayne, J. Hough, I. MacLaren, S. Rowan: Probing the atomic structure of amorphous Ta2O5 coatings, Appl. Phys. Lett. 98, 031904 (2011).
[26] R. Nakamura, M. Ishimaru, K. Sato, K. Tanaka, and H. Nakajima, T. J. Konno: Enhancement of nanovoid formation in annealed amorphous Al2O3 including W, J.Appl. Phys. 114, 124308 (2013).
[27] F. Jellinek: The system tantalum-sulfur, J. Less Common Metals 4, 9 (1962).
13
diffraction study of intercalates AgxTaS2, phys. status solidi (a) 107, 873 (1988).
[29] A. Suzuki, T. Yamashita, K. Matsui, and M. Doyama: Thermal and structural measurements of the mixed crystal 1T-TaS2-xSe1-x, J. Phys. Soc.Jpn. 57, 1707 (1988).
[30] H. Xie, Q. Zhang, T. Xi, J. Wang, and Y. Liu: Thermal analysis on nanosized TiO2 prepared by
hydrolysis, Thermochim. Acta 381, 45 (2002).
[31] S. E. Filippova and L. A. Reznitskii: The temperature and enthalpy of crystallization of amorphous niobium oxide, Russian J. Inorganic Chem.46, 1640 (2001).
[32] M. Tane, S. Nakano, R. Nakamura, H. Ogi, M. Ishimaru, H. Kimizuka, and H. Nakajima, Nanovoid formation by change in amorphous structure through the annealing of amorphous Al2O3 thin
films, Acta Mater. 59, 4631 (2011).
[33] A. G. Gad-Allah, H. A. Abd El-Rahman, and M. M. Abou-Romia: Influence of oxide bond energies on the kinetics of chemical dissolution of anodic oxides on valve metals, J. Appl. Electrochem.18, 532 (1988).
Fig. 1. XRD profiles of (a) as-anodized and (b,c) annealed Ta-O nanotubes: (b) up to 1058 K and (c) up to 1128 K.
Fig. 2. Bright-field electron-microscopy images of as-anodized Ta-O nanotubes (a), and those annealed up to 1058 K (b) and 1128 K. (a’-c’) The corresponding selected-area electron diffraction patterns.
Fig. 3. Energy-dispersive X-ray spectra at lower energy region for the anodic Ta-O corresponding to the Fig. 2. (a) as-anodized Ta-O nanotubes and those annealed (b) up to 1058 K and (c) 1128 K. These spectra are normalized to the peak height of Ta Mα.
Fig. 4 Line-profiles of characteristic X-ray intensity obtained across a single nanotube of (a) as-anodized Ta-O and (b) that annealed up to 1058 K. Intensity of O Kα and S Kα normalized to that
Fig. 5. (a) TG-DTA profile of anodic amorphous Ta-O NTs, measured at a heating rate of 10 Kmin-1
in a stream of high purity argon. (b) Simultaneously measured desorption curves. The number on each profile indicates the mass number of the detected species.
Fig. 6. Atomic pair distribution function g(r) of (a) a-Ta2O6.6S0.7 and (b) a-Ta2O5 prepared by
sputtering [21]. Dotted black and red solid lines represent as-anodized (as-sputtered) and annealed samples, respectively. The experimental details for sputtered samples are in Ref. [16,21]. g(r) of annealed a-Ta2O5 is an original data for this publication.
Fig. 7. Schematic diagrams for enthalpy at various stages of transformation, including hypothetical states: (I) a-Ta2O6.6S0.7, (II, III) amorphous Ta2O5, and (IV, V) β-Ta2O5. State II contains an extra
volume due to the removal of extra oxygen and sulfur from a-Ta2O6.6S0.7. State V includes released


![Fig. 6. Atomic pair distribution function g(r) of (a) a-Ta 2 O 6.6 S 0.7 and (b) a-Ta 2 O 5 prepared by sputtering [21]](https://thumb-ap.123doks.com/thumbv2/123deta/8515466.1805852/20.892.270.630.223.693/fig-atomic-pair-distribution-function-ta-prepared-sputtering.webp)