Drug Pipelines and Pharmaceutical Licensing Junichi Nishimura†, Yosuke Okada† and Toshiro Takatori†† † : Hitotsubashi University, Office of Pharmaceutical Industry
Research
†† : Office of Pharmaceutical Industry Research
OPIR Research Paper Series No.45 April 2009
1
Drug Pipelines and Pharmaceutical Licensing
*
Junichi Nishimura†
(Hitotsubashi University, Office of Pharmaceutical Industry Research) Yosuke Okada
(Hitotsubashi University, Office of Pharmaceutical Industry Research) Toshiro Takatori
(Office of Pharmaceutical Industry Research)
April 2009
* The earlier version of this paper was presented at the Applied Econometric Association, Hitotsubashi University, and at the Japanese Economic Association. We appreciate the helpful comments provided by Hiroyuki Okamuro, Hideo Owan, and Yoshindo Takahashi. We also appreciate the valuable efforts of Masami Ohkubo who provided excellent research assistance. The views expressed herein are those of the authors and do not necessarily reflect those of the Office of Pharmaceutical Industry Research. All remaining errors are solely the responsibility of the authors.
2
Abstract
We examine how drug pipelines (drug candidates and post-market product lines) affect pharmaceutical licenses, controlling firm size, diversity, and competition. The data collected comprises 347 license-outs and 604 license-ins closed by 54 Japanese pharmaceutical companies between 1997 and 2007. We classify licensing contracts into four stages: (i) drug discovery, (ii) early development, (iii) late development, and (iv) marketing. Estimates from random effect IV models reveal that fewer drug candidates in either late development or marketing stages accelerate license-ins in various stages. On the other hand, richer pipelines in any stage facilitate license-outs in that stage. In addition, theoretical implications are discussed.
3 1. Introduction
Understanding the mechanism of the technology market enables us to enhance the rate of return on research and development (R&D) through the outsourcing of knowledge across a firm’s boundary (Penrose, 1959; Williamson, 1985). There are two effects of license-out on profit: (i) revenue effect (rents earned by the licensor in the form of royalty) and (ii) rent dissipation effect (the erosion of profits due to competition of the licensee). A majority of previous studies on the technology market examine the manner in which complementary assets affect licensing propensity (Teece, 1986; Cohen Levinthal, 1989, 1990; Arora et al. 2001; Shane, 2001; Arora and Fosfuri, 2003; Kollmer and Dowling, 2004; Arora and Ceccagnoli, 2006; Fosfuri, 2006).
However, there are few empirical studies that explore the effect of R&D portfolio on licensing. This paper examines the manner in which R&D portfolios, which is reflected in drug pipelines of pharmaceutical firms (product lines and drug candidates under development stages), influence the activity of inward and outward licensing, controlling firm size, diversity, and the degree of competition at either the drug development or product market stage.
In a recent theoretical study, Chan et al (2007) provided a model of project selection that explicitly incorporates R&D pipelines, transaction costs, and downstream co-specialized assets (Williamson 1985) such as distribution channels and brands. By using a dynamic programming technique, they examined the investment and licensing decisions. They indicate that the state of R&D pipelines and the existence of downstream co-specialized assets affect the optimal R&D portfolio as well as incentive to use the technology market at different R&D stages. For example, research-oriented firms with no downstream complementary assets are likely to sell their research outcomes to downstream licensees.
Accordingly, we expect that pharmaceutical firms with fewer drug candidates are likely to outsource external seeds at a later stage, while research-oriented firms with no downstream assets are not likely to buy drug candidates1 at a later stage. On the other hand, we suspect that richer pipelines in a certain stage facilitate license-outs in that stage,
1 In similar vein, Higgins and Rodriguez (2006) and Danzon et al. (2007) explore the incentive for
mergers and acquisitions (M&A) in the U.S. pharmaceutical industry as a method to obtain external R&D outcomes.
4
although the rent dissipation effect aggravates the incentive to license out to firms with downstream complementary assets.
The data we collected comprises 347 license-outs and 604 license-ins closed by 54 Japanese pharmaceutical companies between 1997 and 2007 with various types of counterparts such as horizontal rivals, bio-ventures, and universities. Furthermore, we define a portfolio of drug pipelines and classify the process of pharmaceutical R&D into four stages: (i) drug discovery, (ii) early development, (iii) late development, and (iv) marketing.
Estimates from random effect IV models reveal that fewer drug candidates in either the late development or marketing stage accelerate license-ins in various stages. On the other hand, richer pipelines in any stage facilitate license-outs in that stage. Thus, we find a significant R&D portfolio effect on licensing, as theoretically indicated by Chen et al. (2007). Moreover, we find that pharmaceutical firms with larger sales are more likely to introduce external drug seeds at any stage, although they are not likely to license out at all stages except marketing. Arguably, the propensity to license-in may be strengthened by downstream complementary assets, whereas the propensity to license-out may be weakened by the rent dissipation effect.
This paper is organized as follows. In the next section, we indicate the trend of pharmaceutical licensing and present the classification of licensing stages and drug pipelines. In section 3, we overview the theoretical background and propose our hypotheses. In section 4, we explain variable construction and the empirical model. In section 5, we present the empirical results. In section 6, we conclude our findings.
5 2. Pharmaceutical licensing in Japan 2.1. Trend of pharmaceutical licensing
Figure 1 presents the trend of pharmaceutical licensing in Japan from 1997 to 20072. The number of license-ins and license-outs fluctuated virtually in a similar manner. However the number of license-ins always exceeds that of license-outs, and increased steeply between 2000 and 2002. During this period, Japanese pharmaceutical firms are indicated as being rather active in terms of inward licensing from bio-ventures and other pharmaceutical firms3. This may partially reflect the laggard introduction of molecular biology in pharmaceutical R&D in Japan (Henderson et al. 1999).
2.2. Drug pipelines and licensing stages
New drug development is a sequential process. Figure 2 presents the typical process of pharmaceutical R&D. Quite a few drug candidates at the discovery stage will be screened for synthesis by chemists and biologists in order to develop concepts for new compounds. Once a new compound has been synthesized, it will be screened for pharmacologic activity and toxicity in vitro and animals (pre-clinical testing), and thereafter in humans.
Human clinical testing typically comprises three distinct stages, i.e., phase I, phase II, and phase III, each of which involves different types of testing on safety and efficacy. Phase I is performed on a small number of healthy human subjects in order to obtain information on toxicity and safe dosage ranges. Phase II is performed on a larger number of humans who are patients for whom the drug is intended to be prescribed. Phase III involves large-scale trials on patients. The later a clinical trial is conducted, the greater its cost. Therefore, it is rather important for a pharmaceutical firm to screen promising seeds as efficiently as possible (DiMasi et al., 2003). Finally, a pharmaceutical firm will submit the drug candidate that passes phase III to the Ministry of Health, Labor and Welfare (MHLW), and an approved drug is brought to the market after registration with MHLW.
It is rather probable that a large pharmaceutical firm has at least one drug candidate at almost every stage, while it is rather likely that a smaller firm has no drug candidates at certain stages. In order to examine the manner in which a drug portfolio affects licensing decisions of various types of pharmaceutical firms, we divide drug candidates into the
2 Data sources are explained in Appendix A.
6
following three categories: (i) early development, (ii) late development, and (iii) marketing. Since clinical testing on patients in phases II and III is much more costly than in pre-clinical and phase I, we divide the development stage into the early and late development stages, as shown in Figure 2. The early development stage comprises pre-clinical and phase I, whereas the late development stage comprises phases II and III. Under such a slightly rough classification, we are able to examine the stage-specific incentive to license with sufficient observations for each stage. Although we do not have information on the number of drug seeds at the discovery stage due to data constraints, we can identify the number of licensing contracts at the discovery as well as the development stages.
2.3. Stage-specific pharmaceutical licensing
Table 1 presents the stage-specific licensing activities and drug pipelines of 54 Japanese pharmaceutical firms for the years 1997–2007. The number of license-ins and license-outs are classified by firm size (i.e., drug sales) in 2005. Note that since several firms underwent mergers and acquisitions (M&A) in 2005, the total number of firms as of 2005 is 41.
Table 1 presents the salient characteristics of pharmaceutical licensing that are worth noting. First, larger firms are more likely to license in. Over one-third of total inward licensing is conducted by large pharmaceutical firms with drug sales of over 500 billion, and annual average license-ins per firm (3.59) is much higher than that in other smaller size categories. Second, it appears that richer pipelines in the initial development stage may facilitate licensing-out at that stage. On the other hand, the number of drug candidates at the late development stage appears to have no relationship with outward licensing. Third, it is likely that richer pipelines at every stage facilitate inward licensing. Finally, the number of license-outs at the discovery stage is 18, which is much smaller than those at other stages. This may be due to missing observations. Therefore, the incentive to license out must be carefully examined at the discovery stage.
7 3. Hypotheses formulation
This section explains our hypotheses regarding the relationship between licensing and the state of drug pipelines, controlling firm size, therapeutic diversity, and market competition.
3.1. Drug pipelines and licensing
As indicated by Chan et al (2007), we expect that pharmaceutical firms with fewer drug candidates at a later stage are likely to outsource external drug seeds at that stage, while research-oriented firms with no downstream assets are not likely to insource drug candidates at a later stage. On the other hand, we assume that richer pipelines in a certain stage facilitate license-outs at that stage. Therefore, we formulated the following hypothesis:
Hypothesis 1: Richer drug pipelines at any stage of pharmaceutical R&D facilitate license-outs at that stage.
Hypothesis 2: Fewer drug pipelines at either the late development or market stage accelerate license-ins.
Hypothesis 1 implies that firms with richer drug pipelines at any stage can exploit in-house seeds by outward licensing, i.e., revenue effect facilitates license-outs. On the other hand, firms may be reluctant to license out at the late development stage due to the rent dissipation effect. Namely, license-outs at the late development stage may intensify product market competition in the future.
Hypothesis 2 implies that pharmaceutical firms with fewer drug candidates at either the late development or market stages have to maintain downstream assets (such as statisticians, collaborative network with physicians, and medical representatives) by replenishing external drug seeds at the late development stage.
There are very few empirical studies that examine the relationship between R&D pipelines and licensing. However, in a recent interesting study, Higgins and Rodriguez (2006) evaluated the state of R&D portfolios and found that firms with thin R&D pipelines are more likely to be engaged in M&A. M&A and license-in can be regarded as complementary strategies for introducing external knowledge, although recently there
8
have been quite a few merger cases in the Japanese pharmaceutical industry.
3.2. Firm size and outward licensing
Arora and Fosfuri (2003) developed a model that demonstrates that firms conduct license-outs when the revenue effect (rents earned by the licensor in the form of royalty) is higher than the rent dissipation effect (the erosion of profits due to licensee’s competition). Their model indicates that the rent dissipation effect becomes smaller if the licensor has a small market share because the licensor suffers a lower loss from generating competitors. In similar vein, Fosfuri (2006) indicates that firms with large market shares do not tend to license out.
There are numerous factors that influence the extent of revenue and/or rent dissipation effect. For example, a large transaction cost causes a smaller revenue effect and makes license-out a less attractive strategy (Teece, 1986). Stronger patent protection may raise the revenue effect. Furthermore, the rent dissipation effect becomes smaller if the market of a licensee is strongly segmented from that of a licensor.
Teece (1986) discusses the role of complementary assets to reduce the propensity to license out. A broad range of empirical literature suggests that a large vertically integrated firm that owns downstream complementary assets is reluctant to license out. For example, Shane (2001), Kollmer and Dowling (2004), Ohnishi and Okada (2005), Arora and Ceccagnoli (2006), Motohashi (2006), and Gambardella et al (2007), among others, provide evidence that is consistent with Teece (1986). These studies lead us to formulate the following hypothesis.
Hypothesis 3: Larger firms are less likely to license out internal drug seeds.
Contrary to Hypothesis 3, it may be also possible that larger firms are willing to license out their internal technologies. As argued by Gallini (1984), a dominant firm may strategically license out its technologies in order to prevent competitors from developing better technologies. Rockett (1990) developed a similar argument that a large firm licenses out its technologies to a weak rival in order to crowd out other stronger competitors. Furthermore, Kim (2004) suggested that a larger firm may not be worried with regard to an increase in competitors because of its dominant market position. In similar vein, Nakamura and Odagiri (2005), Kim and Vonortas (2006), and Nagaoka and
9
Kwon (2006) suggested that larger firms are more likely to be involved in license-outs. Thus, there are no robust findings regarding the relationship between firm size and propensity for outward licensing. Hypothesis 3 continues to be an important empirical question that must be examined.
3.3. Firm size and inward licensing
With regard to the relationship between firm size and license-ins, Cohen and Levinthal (1989, 1990) convincingly argued that large firms have greater absorptive capacity to assimilate and exploit existing outside information. Moreover, Fosfuri (2006) argue that larger firms have greater bargaining power over smaller firms in negotiating licensing conditions. Nakamura and Odagiri (2005) find that larger firms are likely to license in, and indicate that firm size as a proxy for organizational capability is positively associated with the value of license-ins. This argument may be verified in the form of the following hypothesis.
Hypothesis 4: Larger firms are more likely to license in external drug seeds.
3.4. Therapeutic Diversity
Pharmaceutical firms dealing with a large number of therapeutic fields may have better organizational capability to assimilate external knowledge. Specifically, co-specialized assets used in R&D, manufacturing, and marketing may be an important source of scope economies (Henderson and Cockburn 1996; Cohen and Levinthal 1989, 1990). Therefore, it will be much easier for more diversified firms to assimilate a wide range of external knowledge. Thus, we present the following hypothesis:
Hypothesis 5: Firms with diverse therapeutic fields are likely to license in.
On the other hand, as far as we know, there are no solid theoretical predictions as well as empirical findings regarding the relationship between therapeutic diversity and outward licensing. Therefore, we additionally hypothesize that firm diversity may have some positive impact on license-outs.
10
This may happen because of various reasons. For example, it may be much easier for diversified firms to find licensee partners (as well as licensors), as in a random matching game. Furthermore, internal resource constraints would raise the opportunity cost of in-house R&D and enhance the revenue effect of exploiting internal knowledge through license-outs. In order to further examine these possibilities, we require additional information regarding a combination of a licensor and licensee. Unfortunately, this type of data is not available in the present study.
3.5. Market competition
The degree of competition at either the development or the marketing stage may have a significant impact on licensing decisions. Arora and Fosfuri (2003) indicate that outward licensing is less likely if there are few competitors in R&D, other things being equal. For example, R&D competition may raise the profitability of license-outs. If there are a large number of rivals in R&D, it is rather difficult to appropriate the outcome of R&D by a single firm. Similarly, Arora and Fosfuri (2003) indicate that product market competition also facilitates outward licensing because a large number of competitors in a product market make it difficult to appropriate the R&D outcome in a product market. In other words, the revenue effect tends to overcome the rent dissipation effect when there are a greater number of competitors. This consideration produces the following hypothesis. Hypothesis 7: Market competition is likely to increase the incentive to license out.
We will define the extent of competition across therapeutic categories in detail in the next section. Recent empirical studies demonstrated the significant role of competition in the technology and product markets. For example, Fosfuri (2006) and Kim and Vonotras (2006) indicate that competition stimulates outward licensing using competition indices such as the number of potential licensors (Fosfuri, 2006) and four-firm concentration ratio (Kim and Vonotras, 2006).
On the other hand, there are no empirical studies examining the competition effect on inward licensing. Market competition may have some positive impact on license-in. Fierce competition, particularly at a later stage, would make it difficult for a pharmaceutical firm to retain sufficient cash-flow to maintain R&D investment. Thus, we put forward the following hypothesis:
11
Hypothesis 8: Market competition is likely to increase the incentive to license in.
As indicated in Figure 1, Japanese pharmaceutical firms actively contracted license-ins between 2000 and 2002. This may have been because of the prospect of severe market competition and exhaustion of drug pipelines in the near future.
12 4. Empirical analysis
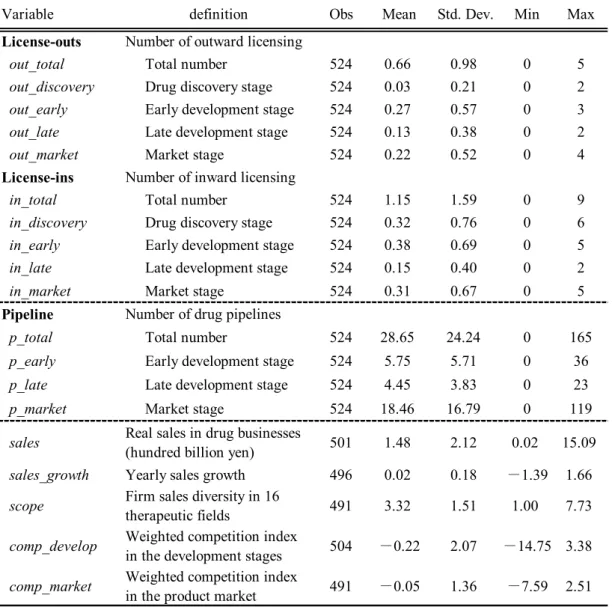
Table 2 summarizes variable definitions and basic statistics. In this section, we will first explain variable constructions of dependent and independent variables. Then, we will present empirical specifications.
4.1. Dependent variable: Outward and inward licensing
The variable in_total is the total number of license-ins at all stages. We also define the variables in_discovery, in_early, in_late, and in_market as the number of license-ins at a corresponding stage of the R&D process. Similarly, we construct the dependent variables for license-outs as out_total, out_discovery, out_early, out_late, and out_market.
Furthermore, we will redefine these dependent variables as a binary value in a probit type specification. In other words, if a firm enters into a license contract, the dependent variable takes on the value of unity, and zero otherwise.
4.2. Independent variable Drug pipelines
The variables p_total, p_early, p_late, or p_market denote the number of drug candidates at the corresponding stage.
Firm size
We employ the variable sales (drug sales) as a proxy for firm size and complementary assets. We use Corporate Goods Price Index (CGPI) given by the Bank of Japan as a deflator of drug sales.
Therapeutic diversity
The variable scope is the diversity index of sales. We classified drug sales into 16 therapeutic fields according to the Anatomical Therapeutic Classification (ATC)4. We first calculated the Herfindahl index H based on the sales share of each firm and created the diversity index as H1/ .5
4 See Appendix A in detail. 5 See Appendix B in detail.
13
Market competition
We construct two types of competition index according to the development stage and product market. Unfortunately we have no information on the therapeutic category of drug seeds for each licensing contract. Considering this data restriction, we construct the Herfindahl index weighted by drug sales in ATC sub-markets at the development or marketing stage denoted by the variables comp_develop or comp_market, respectively.6 Other control variables
Further, we introduce two control variables, sales growth (sales_growth) and year dummies (d_year), in accordance with Fosfuri (2006).
4.3. Empirical specification
Using firm-year panel data, we employ probit and panel tobit regressions taking into consideration a large number of zero values of dependent variables. In addition, we conduct logit and negative binomial regressions for the sole purpose of conducting a robustness check7. The regressions support random effect models according to Hausman specification tests. The basic specification of a random effect probit model is as follows.
it it it X Y* =β +ε it ε ~N (0, 1), 1 = it Y if * >0 it Y , and 0 = it Y otherwise,
where i denotes firm and t denotes year. X includes the independent variables explained in the previous section. The variable *
it
Y is a latent variable that represents an unobservable index of ability or desire on the part of pharmaceutical firm i to license out or in with alliance partners at time t. If the measure is positive, we assume that Y takes it on the positive value of one. We consider the random effect model on the composite error term in the following manner:
6 See Appendix B in detail.
7 The results of alternative estimations are not considerably different from basic empirical results.
14 i it it =v +e ε , [ ] 2 2 e v it Var ε =σ +σ , Corr[εit,εis]=ρ =σvσe.
We suppose that v and it e are independent and identically distributed. If the i correlation ρ is zero, it may be possible to run a pooled probit regression. However, according to the LM-test, estimates in various specifications support the random effect model at least at the 5% significance level. Thus, our empirical specification is
it it it it it it s it s it year d market comp develop comp scope growth sales sales pipeline license ε δ β β β β β β
∑
+ + + + + + + = _ _ _ _ 6 5 4 3 2 1 .The superscript s represents the distinct stage of license activity and/or drug pipelines, as described in Section 2.
4.4. Endogeneity issue
There may be a serious endogeneity problem of reverse causality with regard to drug pipelines because drug pipelines influencing a firm’s license activity are themselves influenced by a firm’s license activity. In order to cope with this endogeneity problem and check the robustness of our basic model, we further estimate the random effect instrumental variable and bivariate probit models.
First, we conduct a 2SLS (IV) estimation. This can be done by obtaining the predicted values of drug pipelines, regressing against the instrumental variable that is correlated with drug pipelines but exogenous to the dependent variable. We use one-year lagged variables of drug pipelines as the instrumentals because they are assuredly correlated with present drug pipelines but are not likely to be correlated with present licensing decisions.
Next, firms may conduct licensing at some stage taking into consideration the pipelines of other stages. In this case, the disturbances do not satisfy the i.i.d. condition. In order to control this endogeneity problem, we conduct a bivariate probit model where two different arbitrary dependent variables are permitted to be correlated with each other. In our unreported work, we obtained virtually similar results to the random effect probit and tobit regressions. Thus, we will only report the estimation results of probit, tobit, and 2SLS (IV) regressions in the next section.
15 5. Estimation results
5.1. Determinants of license-outs
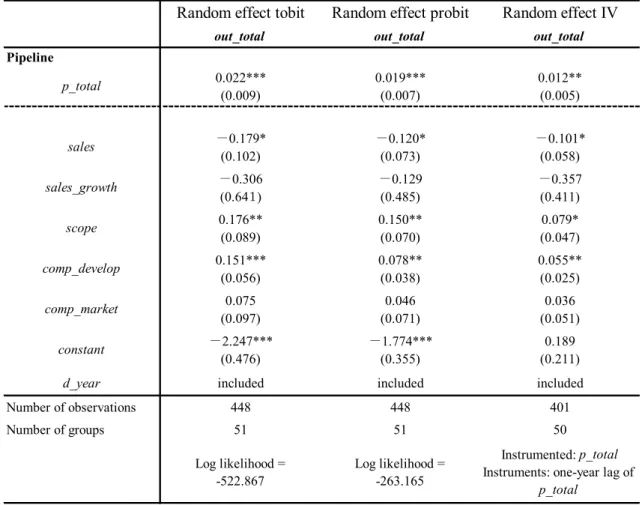
First, we employ regressions with the total number of outward licensing (out_total) as a dependent variable. Table 3 presents the estimation results of random effect probit, random effect tobit, and random effect IV regressions. We use p_total, sales, sales_growth, scope, comp_develop, comp_market, and d_year as independent variables. The results indicate that all the coefficients of p_total are significantly positive at the 1% or 5% significance level. This is consistent with Hypothesis 1.
Several other independent variables are also significant. First, the coefficient of sales is significantly negative at the 10% significance level. Although the significance level is rather weak, this may indicate that the rent dissipation effect dominates the revenue effect, as is expected from Hypothesis 3.8 This result is consistent with Fosfuri (2006) and Arora and Ceccagnoli (2006). However, it must be noted that our sample comprises relatively large pharmaceutical firms with downstream complementary assets. This feature of our dataset may affect the likelihood of drug seeds being exploited in-house.
With regard to therapeutic diversity, the relevant variable scope is significantly positive at the 5%–10% level. This positive coefficient is consistent with Hypothesis 6. It may be easier for a pharmaceutical firm with drug candidates across diverse therapeutic fields to find potential licensees.
Finally, the coefficient of comp_develop is positive and strongly significant. It would be difficult to keep technologies secret if there are numerous competitors and potential licensors at the development stage. Thus, the expected return of a drug seed in the future may become lower and pharmaceutical firms are more likely to license their technologies out in order to obtain license royalties (Arora and Fosfuri, 2003). This result is consistent with Hypothesis 7.
Stage-specific propensity to license out
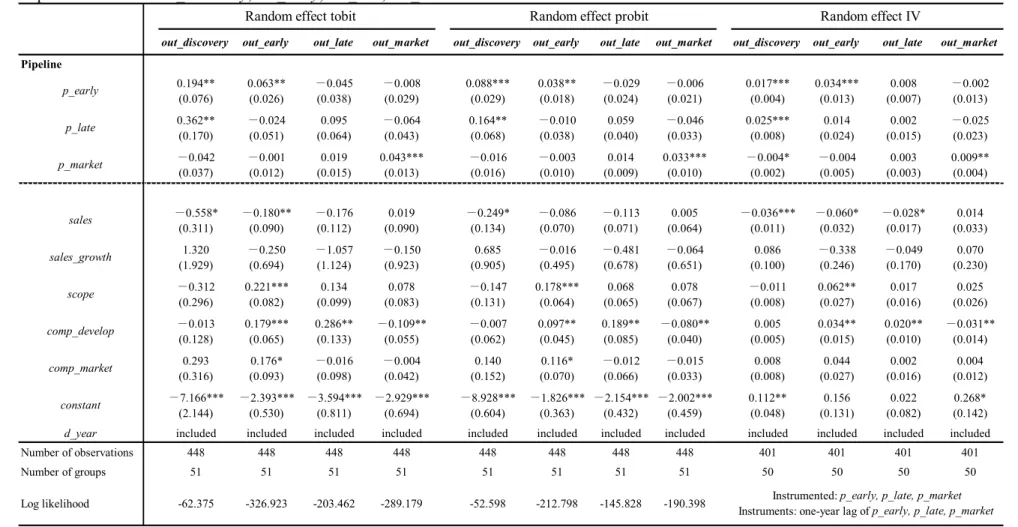
Table 4 summarizes the results of stage-specific determinants of license-outs. We
8 There may be multicollinearity between sales and drug pipelines, particularly at the market stage.
However, even if we exclude either one of these variables, the estimation results are virtually the same as those of our basic model.
16
employed regressions stage by stage. The dependent variable is out_discovery, out_early, out_late, or out_market. We use the information on drug pipelines as independent variables with three distinct stages p_early, p_late, and p_market. Other independent variables are the same as those given in Table 3. The main estimation results are summarized as follows.
First, the coefficients of p_early and p_late are significantly positive at the discovery stage in all specifications. If the relevant technologies in the discovery stage are general-purpose, the potential number of licensees may be larger and expected revenues from license-outs are higher. In this case, it is more attractive for licensors to sell their technologies than keep these technologies in-house (Gambardella et al., 2007).
Second, the coefficient of p_early is significant and positive in the early development stage. Similarly, the coefficient of p_market is positive and significant in the market stage. These results suggest that the incentive to stage-specific license out depends on the corresponding number of in-house drug seeds.
However, the coefficient of p_late is not significant in all specifications. As is expected from the summary statistics in Table 1, there is no clear relationship between license-outs and drug pipelines in the late development stage. Pharmaceutical firms may be reluctant to license out at that stage even if they have numerous drug candidates because they expect higher revenues ex post in the late development stage through in-house development and it is also advantageous to maintain downstream complementary assets.
Third, the coefficient of comp_develop is significantly positive at both the early and late development stages, whereas it is significantly negative at the marketing stage. In other words, pharmaceutical firms that face severe competition at the development stage are more likely to license out at the development stage. On the other hand, at the marketing stage, pharmaceutical firms hesitate to license out their post-market products if they face severe competition at the development stage.
The following are the possible reasons for the salient results with regard to the variable comp_develop. First, it is difficult for pharmaceutical firms that are facing fierce development competition to keep technologies secret. Therefore, they want to introduce their drug candidates into the product market as soon as possible (Arora and Fosfuri, 2003). On the other hand, under fierce development competition, pharmaceutical firms
17
may expect that potential competitors will enter the market in the near future. Therefore, they expect that the rent dissipation effect is heightened by license-outs at the marketing stage.
5.2. Determinants of license-ins
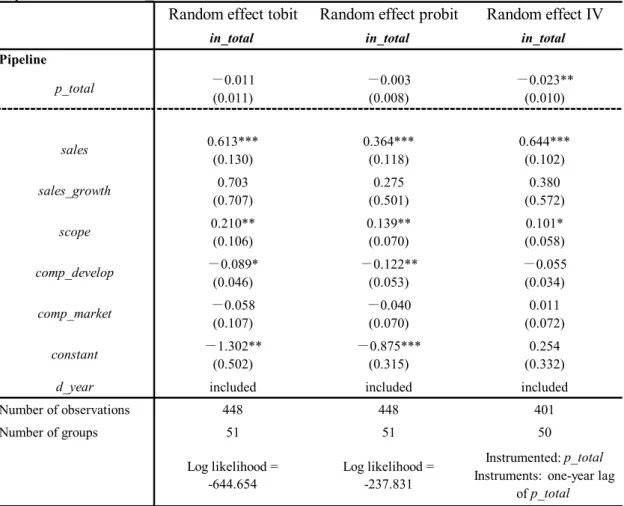
First, we employ regressions with the total number of inward licensing (in_total) as a dependent variable. Table 5 presents the estimation results of random effect probit, random effect tobit, and random effect IV regressions. We use p_total, sales, sales_growth, scope, comp_develop, comp_market, and d_year as independent variables. The coefficient of p_total is negative but not significant in both the tobit and probit models. However, it is negative and significant at the 5% level in the random effect IV regression. This implies that firms with fewer drug pipelines tend to accelerate license-ins. This result supports Hypothesis 2.
The coefficients of sales and scope are significantly positive at the 1% or 5% level. These results support Hypotheses 4 and 5. Firms with greater capacity of R&D, manufacturing, and marketing are able to absorb external resources more easily, which enable such firms to be more likely to license in. This result is consistent with the empirical results in Nakamura and Odagiri (2005).
Finally, the coefficient of comp_develop is negative; however, the significance level is rather low in the tobit and probit models. This may imply that firms that face severe competition at the development stage do not have a tendency to license in. However, this variable is no longer significant in the random effect IV model. These results are inconsistent with Hypothesis 8. Thus, we do not have any robust results regarding the relationship between market competition and license-ins.
Stage-specific propensity to license in
Table 6 summarizes the results of stage-specific determinants of license-ins. The dependent variables are in_discovery, in_early, in_late, or in_market. The independent variables are the same as those provided in Table 4.
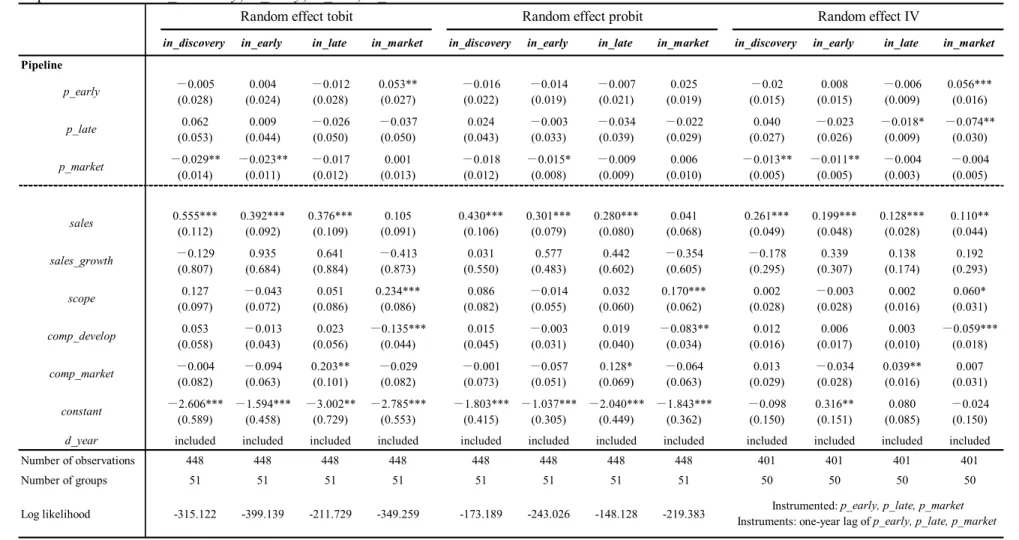
The estimation results of the tobit and probit models indicate that the coefficients of drug pipelines are not significant in a majority of the cases. However, the results in the random effect IV model partially support Hypothesis 2. Hereafter, we focus on the
18
random effect IV results.
First, the coefficient of p_late is weakly significant and negative at either the late development or marketing stage. In other words, firms with fewer drug candidates at the late development stage are more likely to license in at either the late development or marketing stage.
Second, the coefficient of p_market is significantly negative at both the discovery and early development stages. Hence, firms with fewer drug seeds at the marketing stage tend to license in at either the discovery or early development stage.
Third, the coefficient of p_early is unexpectedly positive and significant at the marketing stage. This is inconsistent with Hypothesis 2. However, in order to convincingly interpret this result, there are numerous missing links between the drug seeds at the early stage and the propensity to license in at the marketing stage that must be established.
Fourth, the coefficient of sales is significantly positive at the 1% or 5% level. Thus, Hypotheses 4 is strongly supported.
Finally, the coefficient of comp_market is significantly positive at the late development stage. This suggests that firms facing severe market competition are more likely to license in at the late development stage. This is consistent with Hypothesis 8. On the other hand, the coefficient of comp_develop is significantly negative at the marketing stage. This is inconsistent with Hypothesis 8. In order to interpret these results, the comparison with the estimates of license-out may be useful. As indicated in Table 4, tougher competition at the development stage reduces the number of both license-outs as well as license-ins at the marketing stage. This symmetric evidence suggests that the rent dissipation effect deters inward as well as outward licensing at the marketing stage.
19 6. Conclusion
The present paper examines the manner in which drug pipelines affect pharmaceutical licenses. As is consistent with theoretical literature, we find that the state of drug pipelines significantly affects licensing decisions.
Several implications have been derived in this paper. First, license-in and license-out are differently affected by the state of drug pipelines. Roughly speaking, we found within-stage interactions between pipelines and license-outs, particularly at the early development and marketing stages. On the other hand, across-stage interactions between pipelines and license-ins are observed, particularly at the late development and marketing stages.
Second, firm size, therapeutic diversity, and market competition are also related with licensing decisions. It is more important for organizational capability to be related with inward licensing, while rent dissipation effect is more relevant to outward licensing.
This paper has several limitations. First, our dataset mainly includes licensing contracts with drug candidates. We do not have sufficient information on the licensing of research tools such as biotechnologies. This may underestimate the significant role of technology licensing in the pharmaceutical industry.
Second, the present study does not consider the value of licensing contracts. The value of each drug candidate differs significantly according to the relevant stage of the R&D process. However, changing features of option values at different stages would complicate further exploration. Patent statistics could offer possible clues for examining the option values of drug candidates.
Finally, we consider both aspects of license-in and license-out at the same time. However, we do not analyze the pairwise controls of the characteristics of licensors and licensees, as is done by Kim and Vonotras (2006), mainly due to data restriction. This requires broader and more comprehensive data collection, although information on pharmaceutical licensing is generally difficult to obtain because of the strong propensity to secrecy among pharmaceutical firms, particularly in Japan. Any further analysis must take these limitations into consideration.
20 References
Arora, A., Ceccagnoli, M. (2006), Patent protection, complementary assets, and firm’s incentives for technology licensing, Management Science 52, 293–308.
Arora, A., Fosfuri, A. (2003), Licensing the market for technology, Journal of Economic Behavior and Organization 52, 277–295.
Arora, A., Fosfuri, A., Gambardella, A. (2001), Markets for technology: The economics of innovation and corporate strategy, MIT press.
Chan, T., Nickerson, J.A., Owan, H. (2007), Strategic management of R&D pipelines with cospecialized investments and technology markets, Management Science 53, 667–682.
Cohen, W., Levinthal, D. (1989), Innovation and learning: The two faces of R&D, Economic Journal 99, 569–596.
Cohen, W., Levinthal, D. (1990), Absorptive capacity: A new perspective on learning and innovation, Administrative Science Quarterly 35, 128–152.
Danzon, P., Epstein, A., Nicholson, S., (2007), Mergers and acquisitions in the pharmaceutical and biotech industries, Managerial and Decision Economics 28, 307–328.
DiMasi, J.A., Hansen, R.W., Grabowski, H.G. (2003), The price of innovation: New estimates of drug development costs, Journal of Health Economics 22, 151–185. Fosfuri, A. (2006), The licensing dilemma: Understanding the determinants of the rate of
technology licensing, Strategic Management Journal 27, 1141–1158.
Gallini, N.T. (1984), Deterrence through market sharing: A strategic incentive for licensing, American Economic Review 74, 931–941.
Gambardella, A. (2008), Ideas for rent: An overview of markets for technology, Paper to be presented at the 25th Celebration Conference 2008 on Entrepreneurship and Innovation—Organizations, Institutions, Systems and Regions.
Gambardella, A., Giuri, P., Luzzi, A. (2007), The market for patents in Europe, Research Policy 36, 1163–1183.
Henderson, R., Cockburn, I. (1996), Scale, scope, and spillovers: The determinants of research productivity in drug discovery, Rand Journal of Economics 27, 32–59. Henderson, R., Orsenigo, L., Pisano, G. P. (1999) “The pharmaceutical industry and the
21
revolution in molecular biology: Interactions among scientific, institutional, and organizational change,” in D. C. Mowery and R. R. Nelson eds., Sources of Industrial Leadership, Cambridge University Press, 267–311.
Higgins, M.J., Rodriguez, D. (2006), The outsourcing of R&D through acquisitions in the pharmaceutical industry, Journal of Financial Economics 80, 351–383.
Kim, Y. (2004), Market structure and technology licensing: Evidence from US manufacturing, Applied Economics Letters 11, 631–637.
Kim, Y., Vonortas, N.S. (2006), Technology licensing partners, Journal of Economics and Business 58, 273–289.
Kollmer, H., Dowling, M. (2004), Licensing as a commercialization strategy for new technology-based firms, Research Policy 33, 1141–1151.
Motohashi, K. (2006), Licensing or not licensing?: Empirical analysis on strategic use of patent in Japanese firms, RIETI Discussion Paper Series 06-E-021.
Nakamura, K., Odagiri, H. (2005), R&D boundaries of the firm: An estimation of the double-hurdle model on commissioned R&D, joint R&D, and licensing in Japan, Economics of Innovation and New Technology 14, 583–615.
Nagaoka, S., Kwon, H.U. (2006), The incidence of cross-licensing: A theory and new evidence on the firm and contract level determinants, Research Policy 35, 1347–1361.
Odagiri, H. (2003), Transaction costs and capabilities as determinants of the R&D boundaries of the firm: A case study of the ten largest pharmaceutical firms in Japan, Managerial and Decision Economics 24, 187–211.
Ohkubo, M. (2008), The trend of inward pharmaceutical licensing in Japan, OPIR Views and Actions 25, 13–17, Office of Pharmaceutical Industry Research, Japanese Pharmaceutical Manufacturers Association (in Japanese).
Ohnishi, K., Okada, Y. (2005), The determinants of contractual formation in licensing: Firm size and patent thicket, JCER Economic Journal 52, 44–66 (in Japanese). Penrose, Edith T. (1959), The theory of the growth of the firm, Basil Blackwell (Third
edition, Oxford University Press, 1995).
Rockett, K. (1990), Choosing the competition and patent licensing, Rand Journal of Economics 21, 161–171.
22
1173–1190.
Teece, D.J. (1986), Profiting from technological innovation, Research Policy 15, 285–305.
Williamson, O.W. (1985), The economics institutions of capitalism: Firms, markets, and relational contracting, Free Press.
23 Appendix A
Data Sources
Our data comprises three data sets: license-outs and license-ins, drug pipelines, and firm characteristics. First, we select 54 pharmaceutical firms that participate in the Japan Pharmaceutical Manufacturers Association (JPMA). JPMA is a voluntary organization of research-based pharmaceutical manufacturers that has 69 members as of October 1, 2008. From among 69 firms, we exclude 15 firms that are foreign-affiliated and whose main business is generic drug, medical device, or Chinese herbal medicine. Certain firms in our sample underwent M&A. Thus, we obtain firm characteristics at the time when licensing contracts are awarded.
Next, we investigated the license activity of these 54 firms through the websites of each company, financial reports, and Asuno Shinyaku (the database of drug developments and alliances of firms). As a result, we collected 347 license-out and 604 license-in contracts with various types of counterparts such as horizontal rivals, biotechs, and universities between 1997 and 2007. The data on license-outs and license-ins is categorized into four stages of pharmaceutical R&D process, as discussed in section 2.2.
Second, we collect the information on the drug pipelines of 54 firms. Drug pipeline data is gathered through Pharmaprojects, the database by Informa UK Ltd. Drug pipelines are also classified into three stages. Moreover, drug pipelines can be divided into 16 therapeutic fields by the Anatomical Therapeutic Classification (ATC) prepared by the European Pharmaceutical Market Research Association: 1) Alimentary T.& Metabolism, 2) Blood & B.Forming Organs, 3) Cardiovascular System, 4) Dermatologicals, 5) G.U.System & Sex Hormones, 6) Systemic Hormones, 7) Systemic Anti-Infectives, 8) Hospital Solutions, 9) Antineoplast & Immunomodul, 10) Musculo-Skeletal System, 11) Central Nervous System, 12) Parasitology, 13) Respiratory System, 14) Sensory Organs, 15) Diagnostic Agents, and 16) Various.
Finally, we collect and construct firm characteristics such as size and therapeutic diversity. We use drug sales as a proxy for firm size derived from Katsudou Gaikyou Chousa (the annual questionnaire survey by JPMA). We also collect sales data in 16 therapeutic fields by ATC from IMS World Review (IMS Health). Using this data, we calculate the inverse of Herfindahl index of sales share and construct the therapeutic diversity and competition index of firms.
24 Appendix B
Variable construction on therapeutic diversity and market competition Therapeutic diversity
We calculate sales share T in each of the 16 therapeutic fields of ATC. ikt
∑
=k ikt
T 1 ,
where k represents therapeutic fields (1, 2, …K), i is firm (1, 2, … N), and t is year. Then, we construct the therapeutic diversity scope of the firm as follows.
∑
= k it ikt H T2 , it it H scope = 1 . Market competitionWe first calculate sales share S in each of the 16 therapeutic fields of ATC. ikt
∑
=i ikt
S 1 ,
where k represents therapeutic fields (1, 2, …K), i is firm (1, 2, … N), and t is year. The sales data in each therapeutic field of all firms in the pharmaceutical industry are derived from IMS World Review (IMS Health). Thereafter, we create the diversity index D in kt each therapeutic field through the Herfindahl index B . kt
∑
= i ikt kt B S2 , kt kt B D = 1 .Finally, we can obtain the competition index in the product market comp_market based on these indexes. We normalize sales share S and diversity index ikt D by subtracting kt their average from raw data.
) )( ( _ kt kt t k ikt it S S D D market comp =
∑
− − kt i ikt S S N∑
= 1 t k kt D D K∑
= 1 .25
sub-markets. By calculating S by the share of drug pipelines at development stages, we ikt also obtain the competition index at the development stage comp_develop.
26
Figures and Tables
Figure 1: Division of licensing and drug pipeline stages
Figure 2: Trend of licensing by pharmaceutical firms in Japan
0 10 20 30 40 50 60 70 80 90 1997 1998 1999 2000 2001 2002 2003 2004 2005 2006 2007 license-in license-out
Data source: See Appendix A
Discovery
Early stage Late stage
27
Table 1: Stage-specific licensing and drug pipelines
Firm size Drug sales (billion yen)
Number
of firms total discovery early late market total discovery early late market total early late market
224 87 53 29 55 52 3 15 8 26 4534 941 881 2712 (3.59) (1.40) (0.85) (0.46) (0.88) (0.83) (0.05) (0.24) (0.12) (0.41) (73.12) (15.17) (14.20) (43.74) 137 41 48 18 30 121 7 52 24 38 5143 948 1023 3172 (1.05) (0.31) (0.36) (0.13) (0.23) (0.93) (0.05) (0.40) (0.18) (0.30) (39.56) (7.29) (7.86) (24.40) 243 38 96 32 77 174 8 76 37 53 5337 1124 1118 3095 (0.72) (0.11) (0.29) (0.09) (0.23) (0.52) (0.02) (0.23) (0.11) (0.16) (16.07) (3.38) (3.36) (9.32) 604 166 197 79 162 347 18 143 69 117 15014 3013 3022 8979 (1.15) (0.32) (0.37) (0.15) (0.31) (0.66) (0.03) (0.27) (0.13) (0.22) (28.65) (5.75) (5.76) (17.13)
License-ins License-outs Drug pipelines
sales≧500 4
Total 41
500>sales>100 10
100≧sales 27
Note 1: Firms are classified by drug sales as of 2005.
Note 2: Annual average number of licensing and drug pipelines is given in parenthesis. Data source: See Appendix A.
28
Table 2: Definition and basic statistics of variables (units: 54 firms, year: 1997–2007)
Variable definition Obs Mean Std. Dev. Min Max
License-outs Number of outward licensing
out_total Total number 524 0.66 0.98 0 5
out_discovery Drug discovery stage 524 0.03 0.21 0 2
out_early Early development stage 524 0.27 0.57 0 3
out_late Late development stage 524 0.13 0.38 0 2
out_market Market stage 524 0.22 0.52 0 4 License-ins Number of inward licensing
in_total Total number 524 1.15 1.59 0 9
in_discovery Drug discovery stage 524 0.32 0.76 0 6
in_early Early development stage 524 0.38 0.69 0 5
in_late Late development stage 524 0.15 0.40 0 2
in_market Market stage 524 0.31 0.67 0 5
Pipeline Number of drug pipelines
p_total Total number 524 28.65 24.24 0 165
p_early Early development stage 524 5.75 5.71 0 36
p_late Late development stage 524 4.45 3.83 0 23
p_market Market stage 524 18.46 16.79 0 119
sales Real sales in drug businesses
(hundred billion yen) 501 1.48 2.12 0.02 15.09
sales_growth Yearly sales growth 496 0.02 0.18 -1.39 1.66
scope Firm sales diversity in 16
therapeutic fields 491 3.32 1.51 1.00 7.73
comp_develop Weighted competition indexin the development stages 504 -0.22 2.07 -14.75 3.38
comp_market Weighted competition index
in the product market 491 -0.05 1.36 -7.59 2.51 Note 1: See section 2.2 for the division of licensing and pipeline stages.
29
Table 3: Determinants of license-outs of pharmaceutical firms Dependent variable: out_total
Random effect tobit Random effect probit Random effect IV
out_total out_total out_total
Pipeline 0.022*** 0.019*** 0.012** (0.009) (0.007) (0.005) -0.179* -0.120* -0.101* (0.102) (0.073) (0.058) -0.306 -0.129 -0.357 (0.641) (0.485) (0.411) 0.176** 0.150** 0.079* (0.089) (0.070) (0.047) 0.151*** 0.078** 0.055** (0.056) (0.038) (0.025) 0.075 0.046 0.036 (0.097) (0.071) (0.051) -2.247*** -1.774*** 0.189 (0.476) (0.355) (0.211)
d_year included included included
Number of observations 448 448 401 Number of groups 51 51 50 Log likelihood = -522.867 Log likelihood = -263.165 Instrumented: p_total Instruments: one-year lag of
p_total constant p_total sales sales_growth scope comp_develop comp_market
Note 1: Level of significance: *** 1%, ** 5%, * 10%. Note 2: Standard error is given in parenthesis.
30
Table 4: Determinants of license-outs at four stages of pharmaceutical firms Dependent variable: out_discovery, out_early, out_late, out_market
out_discovery out_early out_late out_market out_discovery out_early out_late out_market out_discovery out_early out_late out_market
Pipeline 0.194** 0.063** -0.045 -0.008 0.088*** 0.038** -0.029 -0.006 0.017*** 0.034*** 0.008 -0.002 (0.076) (0.026) (0.038) (0.029) (0.029) (0.018) (0.024) (0.021) (0.004) (0.013) (0.007) (0.013) 0.362** -0.024 0.095 -0.064 0.164** -0.010 0.059 -0.046 0.025*** 0.014 0.002 -0.025 (0.170) (0.051) (0.064) (0.043) (0.068) (0.038) (0.040) (0.033) (0.008) (0.024) (0.015) (0.023) -0.042 -0.001 0.019 0.043*** -0.016 -0.003 0.014 0.033*** -0.004* -0.004 0.003 0.009** (0.037) (0.012) (0.015) (0.013) (0.016) (0.010) (0.009) (0.010) (0.002) (0.005) (0.003) (0.004) -0.558* -0.180** -0.176 0.019 -0.249* -0.086 -0.113 0.005 -0.036*** -0.060* -0.028* 0.014 (0.311) (0.090) (0.112) (0.090) (0.134) (0.070) (0.071) (0.064) (0.011) (0.032) (0.017) (0.033) 1.320 -0.250 -1.057 -0.150 0.685 -0.016 -0.481 -0.064 0.086 -0.338 -0.049 0.070 (1.929) (0.694) (1.124) (0.923) (0.905) (0.495) (0.678) (0.651) (0.100) (0.246) (0.170) (0.230) -0.312 0.221*** 0.134 0.078 -0.147 0.178*** 0.068 0.078 -0.011 0.062** 0.017 0.025 (0.296) (0.082) (0.099) (0.083) (0.131) (0.064) (0.065) (0.067) (0.008) (0.027) (0.016) (0.026) -0.013 0.179*** 0.286** -0.109** -0.007 0.097** 0.189** -0.080** 0.005 0.034** 0.020** -0.031** (0.128) (0.065) (0.133) (0.055) (0.062) (0.045) (0.085) (0.040) (0.005) (0.015) (0.010) (0.014) 0.293 0.176* -0.016 -0.004 0.140 0.116* -0.012 -0.015 0.008 0.044 0.002 0.004 (0.316) (0.093) (0.098) (0.042) (0.152) (0.070) (0.066) (0.033) (0.008) (0.027) (0.016) (0.012) -7.166*** -2.393*** -3.594*** -2.929*** -8.928*** -1.826*** -2.154*** -2.002*** 0.112** 0.156 0.022 0.268* (2.144) (0.530) (0.811) (0.694) (0.604) (0.363) (0.432) (0.459) (0.048) (0.131) (0.082) (0.142)
d_year included included included included included included included included included included included included
Number of observations 448 448 448 448 448 448 448 448 401 401 401 401
Number of groups 51 51 51 51 51 51 51 51 50 50 50 50
Log likelihood -62.375 -326.923 -203.462 -289.179 -52.598 -212.798 -145.828 -190.398 Instruments: one-year lag of p_early, p_late, p_marketInstrumented: p_early, p_late, p_market
sales sales_growth scope comp_develop comp_market constant
Random effect tobit Random effect probit Random effect IV
p_early p_late p_market
Note 1: Level of significance: *** 1%, ** 5%, * 10%. Note 2: Standard error is given in parenthesis.
31
Table 5: Determinants of license-ins of pharmaceutical firms Dependent variable: in_total
Random effect tobit Random effect probit Random effect IV
in_total in_total in_total
Pipeline -0.011 -0.003 -0.023** (0.011) (0.008) (0.010) 0.613*** 0.364*** 0.644*** (0.130) (0.118) (0.102) 0.703 0.275 0.380 (0.707) (0.501) (0.572) 0.210** 0.139** 0.101* (0.106) (0.070) (0.058) -0.089* -0.122** -0.055 (0.046) (0.053) (0.034) -0.058 -0.040 0.011 (0.107) (0.070) (0.072) -1.302** -0.875*** 0.254 (0.502) (0.315) (0.332)
d_year included included included
Number of observations 448 448 401 Number of groups 51 51 50 Log likelihood = -644.654 Log likelihood = -237.831 Instrumented: p_total Instruments: one-year lag
of p_total constant p_total sales sales_growth scope comp_develop comp_market
Note 1: Level of significance: *** 1%, ** 5%, * 10%. Note 2: Standard error is given in parenthesis.
32
Table 6: Determinants of license-ins at four stages of pharmaceutical firms Dependent variable: in_discovery, in_early, in_late, in_market
in_discovery in_early in_late in_market in_discovery in_early in_late in_market in_discovery in_early in_late in_market
Pipeline -0.005 0.004 -0.012 0.053** -0.016 -0.014 -0.007 0.025 -0.02 0.008 -0.006 0.056*** (0.028) (0.024) (0.028) (0.027) (0.022) (0.019) (0.021) (0.019) (0.015) (0.015) (0.009) (0.016) 0.062 0.009 -0.026 -0.037 0.024 -0.003 -0.034 -0.022 0.040 -0.023 -0.018* -0.074** (0.053) (0.044) (0.050) (0.050) (0.043) (0.033) (0.039) (0.029) (0.027) (0.026) (0.009) (0.030) -0.029** -0.023** -0.017 0.001 -0.018 -0.015* -0.009 0.006 -0.013** -0.011** -0.004 -0.004 (0.014) (0.011) (0.012) (0.013) (0.012) (0.008) (0.009) (0.010) (0.005) (0.005) (0.003) (0.005) 0.555*** 0.392*** 0.376*** 0.105 0.430*** 0.301*** 0.280*** 0.041 0.261*** 0.199*** 0.128*** 0.110** (0.112) (0.092) (0.109) (0.091) (0.106) (0.079) (0.080) (0.068) (0.049) (0.048) (0.028) (0.044) -0.129 0.935 0.641 -0.413 0.031 0.577 0.442 -0.354 -0.178 0.339 0.138 0.192 (0.807) (0.684) (0.884) (0.873) (0.550) (0.483) (0.602) (0.605) (0.295) (0.307) (0.174) (0.293) 0.127 -0.043 0.051 0.234*** 0.086 -0.014 0.032 0.170*** 0.002 -0.003 0.002 0.060* (0.097) (0.072) (0.086) (0.086) (0.082) (0.055) (0.060) (0.062) (0.028) (0.028) (0.016) (0.031) 0.053 -0.013 0.023 -0.135*** 0.015 -0.003 0.019 -0.083** 0.012 0.006 0.003 -0.059*** (0.058) (0.043) (0.056) (0.044) (0.045) (0.031) (0.040) (0.034) (0.016) (0.017) (0.010) (0.018) -0.004 -0.094 0.203** -0.029 -0.001 -0.057 0.128* -0.064 0.013 -0.034 0.039** 0.007 (0.082) (0.063) (0.101) (0.082) (0.073) (0.051) (0.069) (0.063) (0.029) (0.028) (0.016) (0.031) -2.606*** -1.594*** -3.002** -2.785*** -1.803*** -1.037*** -2.040*** -1.843*** -0.098 0.316** 0.080 -0.024 (0.589) (0.458) (0.729) (0.553) (0.415) (0.305) (0.449) (0.362) (0.150) (0.151) (0.085) (0.150)
d_year included included included included included included included included included included included included
Number of observations 448 448 448 448 448 448 448 448 401 401 401 401
Number of groups 51 51 51 51 51 51 51 51 50 50 50 50
Log likelihood -315.122 -399.139 -211.729 -349.259 -173.189 -243.026 -148.128 -219.383 Instruments: one-year lag of p_early, p_late, p_marketInstrumented: p_early, p_late, p_market
sales sales_growth scope comp_develop comp_market constant
Random effect tobit Random effect probit Random effect IV
p_early p_late p_market
Note 1: Level of significance: *** 1%, ** 5%, * 10%. Note 2: Standard error is given in parenthesis.