Photothermal Steel Hardness Measurements - Results and
Perspectives
H.G.Walther*, D.Fournier
1, J.C.Krapez
2, M.Luukkala
3, B.Schmitz
4, C.Sibilia
5, H.Stamm
6,
J.Thoen
7*Institut fuer Optik und Quantenelektronik, Max-Wien-Platz 1,07743 Jena, GERMANY,
1ESPCI
Paris, FRANCE,
2ONERA Paris, FRANCE,
3University Helsinki, FINLANDIA,
4ILM Ulm,
GERMANY,
5University di Roma "La Sapienza",Roma, ITALY,
6JRC Ispra, ITALIA,
7University Leuven,
BELGIUM,
In the frame of a European Thematic Network the feasibility of photothermal steel hardness measurement was studied by joint research activities of scientific institutes and industrial enterprises. The gap between mechanical hardness and thermal conductivity was bridged by careful microstructure investigations and by using calibration curves. The measuring conditions for successful photothermal hardness depth profiling were studied. Novel inversion techniques have been applied for depth profile retrieval.
(Received on June 29, 2000, accepted on October 27 , 2000)
The performance of surface hardened parts is a major issue in automotive and aerospace industries. There is, therefore, a strong need of hardening companies to improve the quality control of their products by introducing new measurement systems which allow for non-destructive and non-contacting hardness profile measurements as an alternative to the presently used destructive inspection methods. It was the aim of the European Thematic Network HARDPHOTOTEC to focus activities to the development of a remote, non-destructive and photothermal measurement methodology and to the design of a photothermal hardness measurement equipment. This paper gives a brief summary of the main activities done within the ETN.
The work coordinated in this network for the validation of photothermal methods for hardness measurements included the following activities: i) preparation of defined samples, ii) investigations of the hardened steel's microstructure, iii) measurement of the correlation between hardness and thermal properties, iv) studying appropriate inversion techniques, v) improvement of the experimental setup and vi) performance of representative round-robin-measurements.
Sample preparation
Several sets of case hardened specimens with different well-defined hardness states were delivered from industrial network partners accompanying the project. Surface hardness as well as hardness profiles were determined by conventional Vickers hardness measurements performed in five different laboratories. Fig.1 shows conventionally estimated Vickers hardness profiles obtained for 18MnCr5 steel samples. The hardness depths (defined for 550 HV) vary within 0.3 ..2 mm.
Microstructure investigations
For understanding of the correlation between mechanical hardness and thermal transport properties the microstructure modification due to the hardening process were studied by microscope, X-ray diffraction and ultrasonics. Austenite, ferrite and martensite , and therefore non-hardened and hardened steel, exhibit different microstructure as shown by the microphotos in Fig.2. In the martensitic steel the increased hardness is correlated with high internal stress, high density of internal
interfaces due to smaller grains and decreased bulk modulus.
Hardness - thermal diffusivity correlation
The correlation between hardness and thermal diffusivity was experimentally determined by independent methods: i) A set of fully hardened, homogeneous specimens with different hardness was produced by appropriate heat treatments. Thermal diffusivities were estimated by common laser flash technique. ii) Along the cross section of sewed and polished hardened steel samples hardness depth profiles were estimated from microindentations and thermal diffusivity profiles were measured by laterally scanning photothermal microscope as reported in [1]. The results from both methods were in good agreement to each other. Thermal conductivity of fully hardened samples was also measured conventionally using stationary heat flux technique. It was confirmed that thermal conductivity is proportional to thermal diffusivity. The measured calibration curve ”Thermal Conductivity Versus Hardness” for one type of austenite steel (18MnCr5) is shown in Fig3. Because of the constant density we believe that hardness is predominantly correlated to thermal conductivity. Calibration curves like that
0 100 200 300 400 500 600 700 800 900 1000 0 1 2 3 4 5 6 7 8 9 10 Lateral Scan (mm) Hardness HV 10
Fig.1 Hardness profiles of a set of reference samples prepared for round robin experiment. The y-axis shows Vickers hardness HV 0.2.
2001 © The Japan Society for Analytical Chemistry
s165
ANALYTICAL SCIENCES APRIL 2001, VOL.17 Special Issue
of Fig. 3 can provide the basis for photothermal hardness estimation. We presently only know that such calibration curves exist. They have of course to be estimated for each type of steel as well as for each hardening technology.
Improved inversion techniques
Remote photothermal measurements were performed both in frequency and time domain to probe for thermal diffusivity changes in the subsurface region. In order to retrieve the hardness profile from photothermal data the correlation between hardness and thermal conductivity has to be used. Moreover, efficient algorithms for the solution of the 'inverse problem' were developed and adapted to determine property profiles from surface temperature measurements. Methods for diffusivity and conductivity profile reconstruction were developed by coordinated efforts and in close collaboration of all network partners. In particular, following novel approaches for profile reconstruction [2] could be validated:
• Neural network based inversion method • Thermal Wave Back Scattering method
• Laplace effusivity inversion applied to time domain transient response
All these methods together with earlier reported sequential least square fit technique [3] were applied to determine hardness profiles from measurement data obtained in this network.
Results from these techniques were in good correspondence to each other. This is demonstrated in Fig.4 where a simple "target" profile was retrieved using different inversion techniques.
Improved radiometric setup
Several series of photothermal measurements were carried out in different laboratories using different photothermal equipment. To compare the data we organized a round robin experiment performed on the same set of specimens. The results of the first measurement campaign were quite frustrating: big discrepancies between the different partners's results were obtained which did not match the theoretical predictions. The disagreement was partially due to the violation of one-dimensionality, e.g. due to the narrow beam width of the heating laser and/or due to parasitic infrared sources (see [4]). From the rather high noise levels it was inferred that more powerful heating lasers and Fig.2: Microphotos of non-hardened (above) and
hardened (below) areas of case hardened steel.
0 0,2 0,4 0,6 0,8 1 1,2 300 400 500 600 700 800 900 Vickers hardness normalised parameters density conductivity diffusivity
Fig.3 Experimentally estimated correlation between thermal diffusivity (α), thermal conductivity (k) and density on mechanical hardness (HV for case hardened steel 18MnCr05. Ordinate data are normalised with respect of non-hardened steel (α= 0.12 cm2/s; k= 33.2 W/Km; ρ=7.76g/cm3)
Fig.4 Retrieved thermal conductivity profiles resulting from different inversion techniques (Neural networks, TWBS, sequential fit) demonstrating the coherence between them.
Hardness depth
more sensitive detectors were needed. These requirements led to a new prototype of a radiometric system. Fig. 5 shows the set-up as it was installed at ILM Ulm: a fiber coupled 20W diode laser acts as heating source, illuminating a 16mm wide spot on the
sample. A 2-lens optics enables a high aperture imaging of the infrared flux onto the MCT detector. Now the measurements from different sets of specimens provided results which were in good agreement with the theoretical predictions and could be used for hardness profile reconstruction. A second radiometric scheme using Ruby laser flash heating was built up at ONERA, Paris.
Results of the Round-Robin-Experiment
A set of 8 case hardened reference samples with different hardness profiles was distributed among the network partners
for photothermal inspection. In the labs of Ulm, Jena, Rome, Ispra and Helsinki modulated infrared radiometry was used whereas at ONERA Paris a pulsed radiometric technique was applied. Using standardized measuring conditions and polished surfaces we could get data which are comparable and consistent with theory. It was necessary to use wide spot illumination (diameter > 16mm) to ensure plane thermal wave generation. The decisive influence of heating spot size on phase contrast is illustrated in Fig.6.
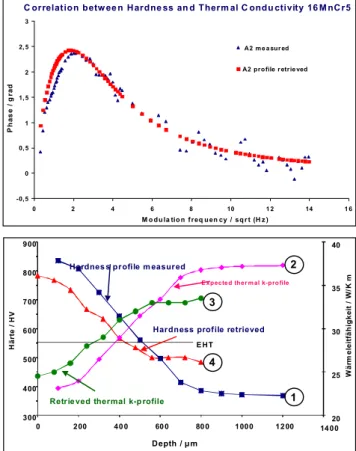
An example of radiometric hardness profile estimation is given in Fig.7: From the photothermally measured amplitude ratios and phase differences (dates are related to the bulk values) the thermal conductivity profile was retrieved (curve 3) using multisequential fit procedure [3]. Then the thermal conductivity profile was "translated" into the hardness depth profile (curve 4) using the correlation curve in Fig.3. This can be compared with the conventionally estimated Vickers hardness profile (curve 1). Using this hardness profile and the correlation curve of Fig.3 we calculated the theoretical thermal conductivity profile (curve 2) and the expected phase contrast curve ("retrieved profile" in Fig.7, above). We have to notice slight deviations between curves 1 and 4 which are the consequences of uncertainties of the correlation curve in Fig.3. Better results should be expected when structure-property correlation curves for carburized steel IR-detector LN2 cooled laserdiode P= 20 W Lock-in amplifier I/U-converter sample, e.g. hardened specimen Peltier -cooling
imaging lens
for excitation imaging lens
for detection fibre coupling
Fig. 5 Radiometric setup using fiber coupled 20W laser diode heating. -0,5 0 0, 5 1 1, 5 2 2, 5 3 0 2 4 6 8 10 1 2 14 1 6
M o du la tio n f req uen cy / sq r t (H z )
P h as e / g rad A2 me a sur ed A2 profile r etrie ved
C orrelation betw ee n Hardne ss an d Therm al C ondu ctivity 16 M nC r5
300 400 500 E HT 600 700 800 900 0 200 400 600 800 1000 1200 1400 20 25 30 35 40 Depth / µ m W ä rm el e it fäh ig ke it / W /K m Hä rt e / HV
Hardnes s profile m easured
Hardness profile retrieved
Retrieved thermal k-p rofile
E xpected ther mal k-pro file 3
4
2
1
Fig.7 Example of photothermal hardness profile retrieval. Above: Measured phase contrast compared with simulation results. Below: Retrieved profile of k from which the hardness profile was calculated. Conventionally measured hardness profile is depicted for comparison. EHT indicates the hardness depth @ 550HV.
0 5 10 15 20 25 30 35 -1.0 -0.5 0.0 0.5 1.0 1.5 2.0 3mm 6mm 16mm ph as e co nt ra st / de gr ee sqrt Frequenz [Hz]
Fig.6 Radiometrically measured phase contrast from case hardened steel (hardness depth 1mm) using different heating spot sizes (3, 6, 16mm).
s167
ANALYTICAL SCIENCES APRIL 2001, VOL.17 Special Issue
(before quenching) are used [5].
When comparing modulated and pulsed photothermal methods with respect of measuring time we find frequency domain measurements are more time consuming. Photothermal time domain measurements last less than 10 min to deliver reproducible data for hardness profile estimation. To speed up hardness estimation the profile can be satisfactorily characterized by only 2 numbers: surface hardness and hardness depth. Both numbers can be obtained within 10 min by modulation techniques too if reference data are known.
Summary
In conclusion, the ETN "HARDPHOTOTEC" activities were successful in reaching the goals set out at its beginning. Noncontact photothermal hardness profiles could be estimated as it is demonstrated for example in Fig.7. Laboratory prototypes for photothermal measurements based on the time and the frequency domain approach have been assembled. This was an important step for further developments and the transfer of this method to industrial application.
For reliable application of photothermal hardness measurement in technology several topics have to be worked out in more detail in the future:
• spending more effort for estimating calibration curves of a wider variety of different steel types
• checking more carefully the identity of local and global correlation between hardness and thermal conductivity • reducing the measuring time by appropriate choice of
modulation frequencies or by using the cross correlation technique
• continuing the application of built-up photothermal devices for hardness characterization.
Acknowledgement
The authors wish to point out the valuable results contributed directly by C.Glorieux, R.LiVoti, S.Paoloni, A.Salmi, P.Mayr and F.Lakestani.
The work was supported by European grant No. BRRT-CT-5032.
References
[1] D.Fournier, contribution at this conference ICPP Kyoto 2000 [2] C.Glorieux, R.LiVoti, J.C.Krapez, several contributions at his conference ICPPP Kyoto 2000
[3] T..Lan, H.G.Walther, Journ.Appl.Phys. 80 (1996), 5289 [4] M.C.Larciprete, P.Mayr, S.Paoloni, B.Schmitz, H.G.Walther contribution at this conference ICPPP Kyoto 2000, [5] A.Mandelis, private information, July 2000.